
 [[{“value”:”
What homebuilder Taylor Morrison said about the costs of mortgage-rate buydowns v. actual price cuts.
By Wolf Richter for WOLF STREET.
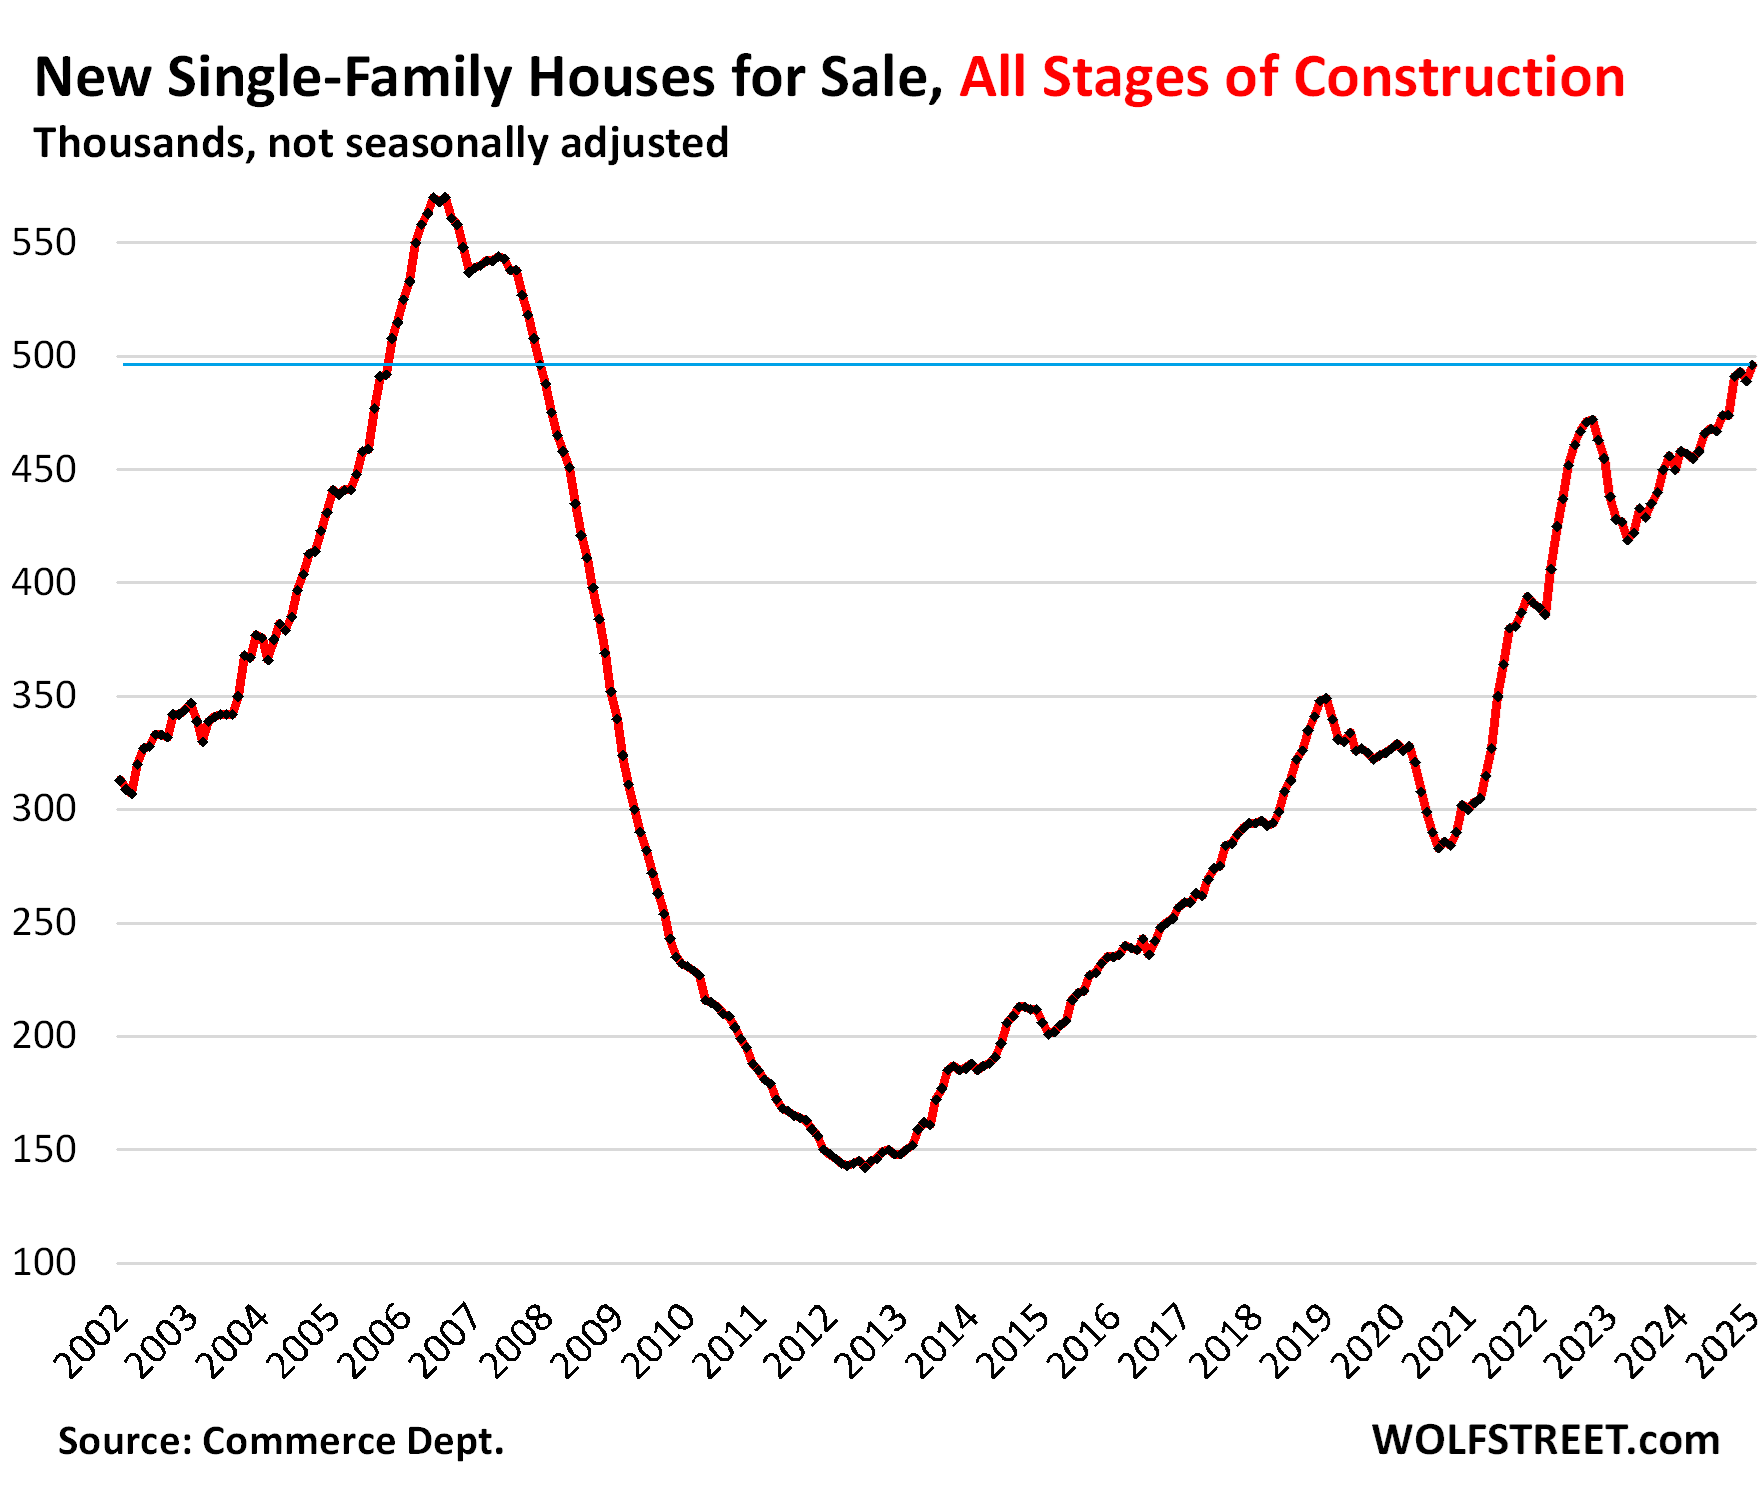
Unsold inventories of new single-family houses for sale at all stages of construction in January rose by 8.3% from the already hugely bloated levels a year ago, and by 42% from January 2019, to 496,000 houses, the highest since December 2007 during the Housing Bust. Supply rose to nearly 9 months.
The overall housing market needs this onslaught of new supply. It’s competition for homeowners selling their homes, or thinking about it, including their vacant homes they’d moved out of years ago but didn’t put on the market to ride up the price spike all the way.
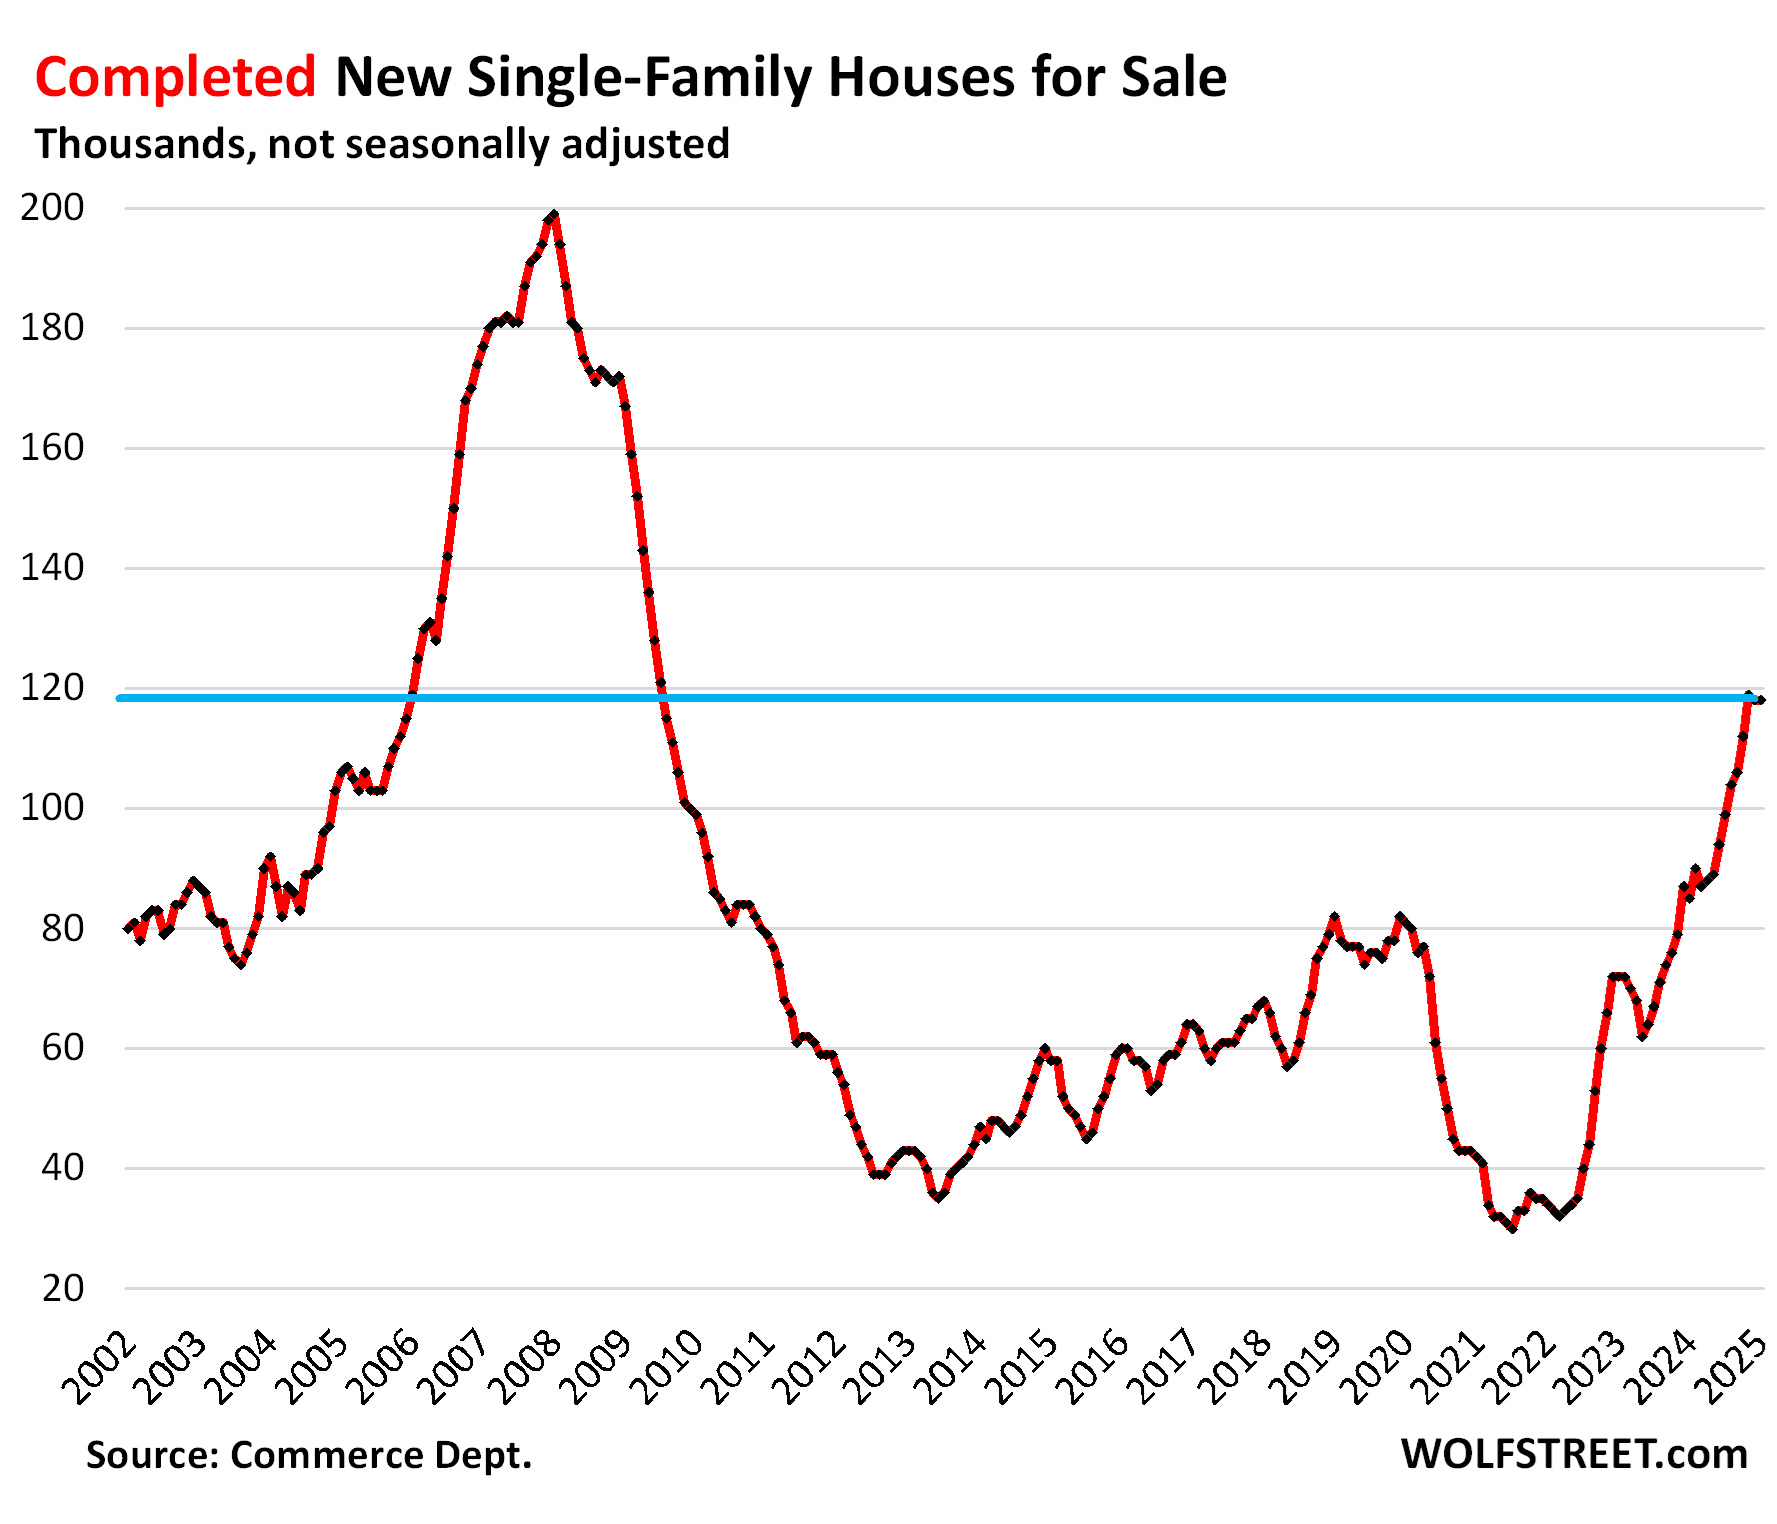
Completed new single-family houses for sale have formed a huge pile of around 118,000 houses for the third month in a row, the highest since August 2009 on the way down, and the same as January 2006 on the way up, as the Housing Bust was taking off.
These are “spec houses” that were built without buyers lined up. Homebuilders need to sell this inventory of spec houses quickly because they’ve sunk a lot of capital into it.
These inventory levels are up by 39% from a year ago, and 44% from January 2019, according to data from the Census Bureau today.
Homebuilders have been putting substantial efforts into selling down their inventory, including price cuts, mortgage rate buydowns, and other incentives, as we can see in their earnings calls and ads.
Here is a screenshot of an ad from Lennar that ran earlier in February for the Dallas-Fort Worth area. We’ll discuss the tiny print of the footnotes below:
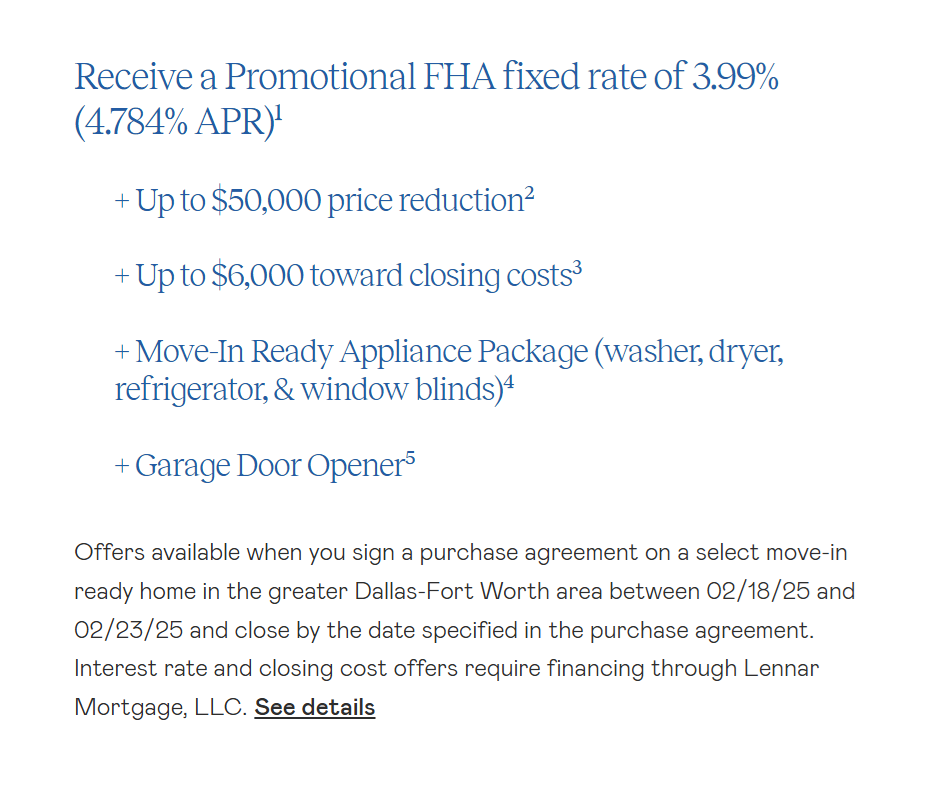
According to the tiny print of the footnotes, the offer is available “on select move‑in ready homes.”
- Footnote #1: the 3.99% mortgage rate is “for a home price of $240,999,” with a minimum of 3.5% down, a minimum credit score of 680, and an owner-occupancy requirement.
- Footnote #2: “Up to $50,000 Price Reduction is valid towards the total purchase price (prices listed reflect reductions).”
- Footnote #3: up to $6,000 credit for closing costs “as determined on your Loan Estimate, excluding prepaids.”
- Footnote #4: incentives of up to $7,720 retail value in form of Lennar’s appliance package. “If you are obtaining a loan, the lender may reduce the purchase price of the home on a dollar for dollar basis for the value of these items(s).”
- Footnote #5, garage door opener, retail value not to exceed $770.
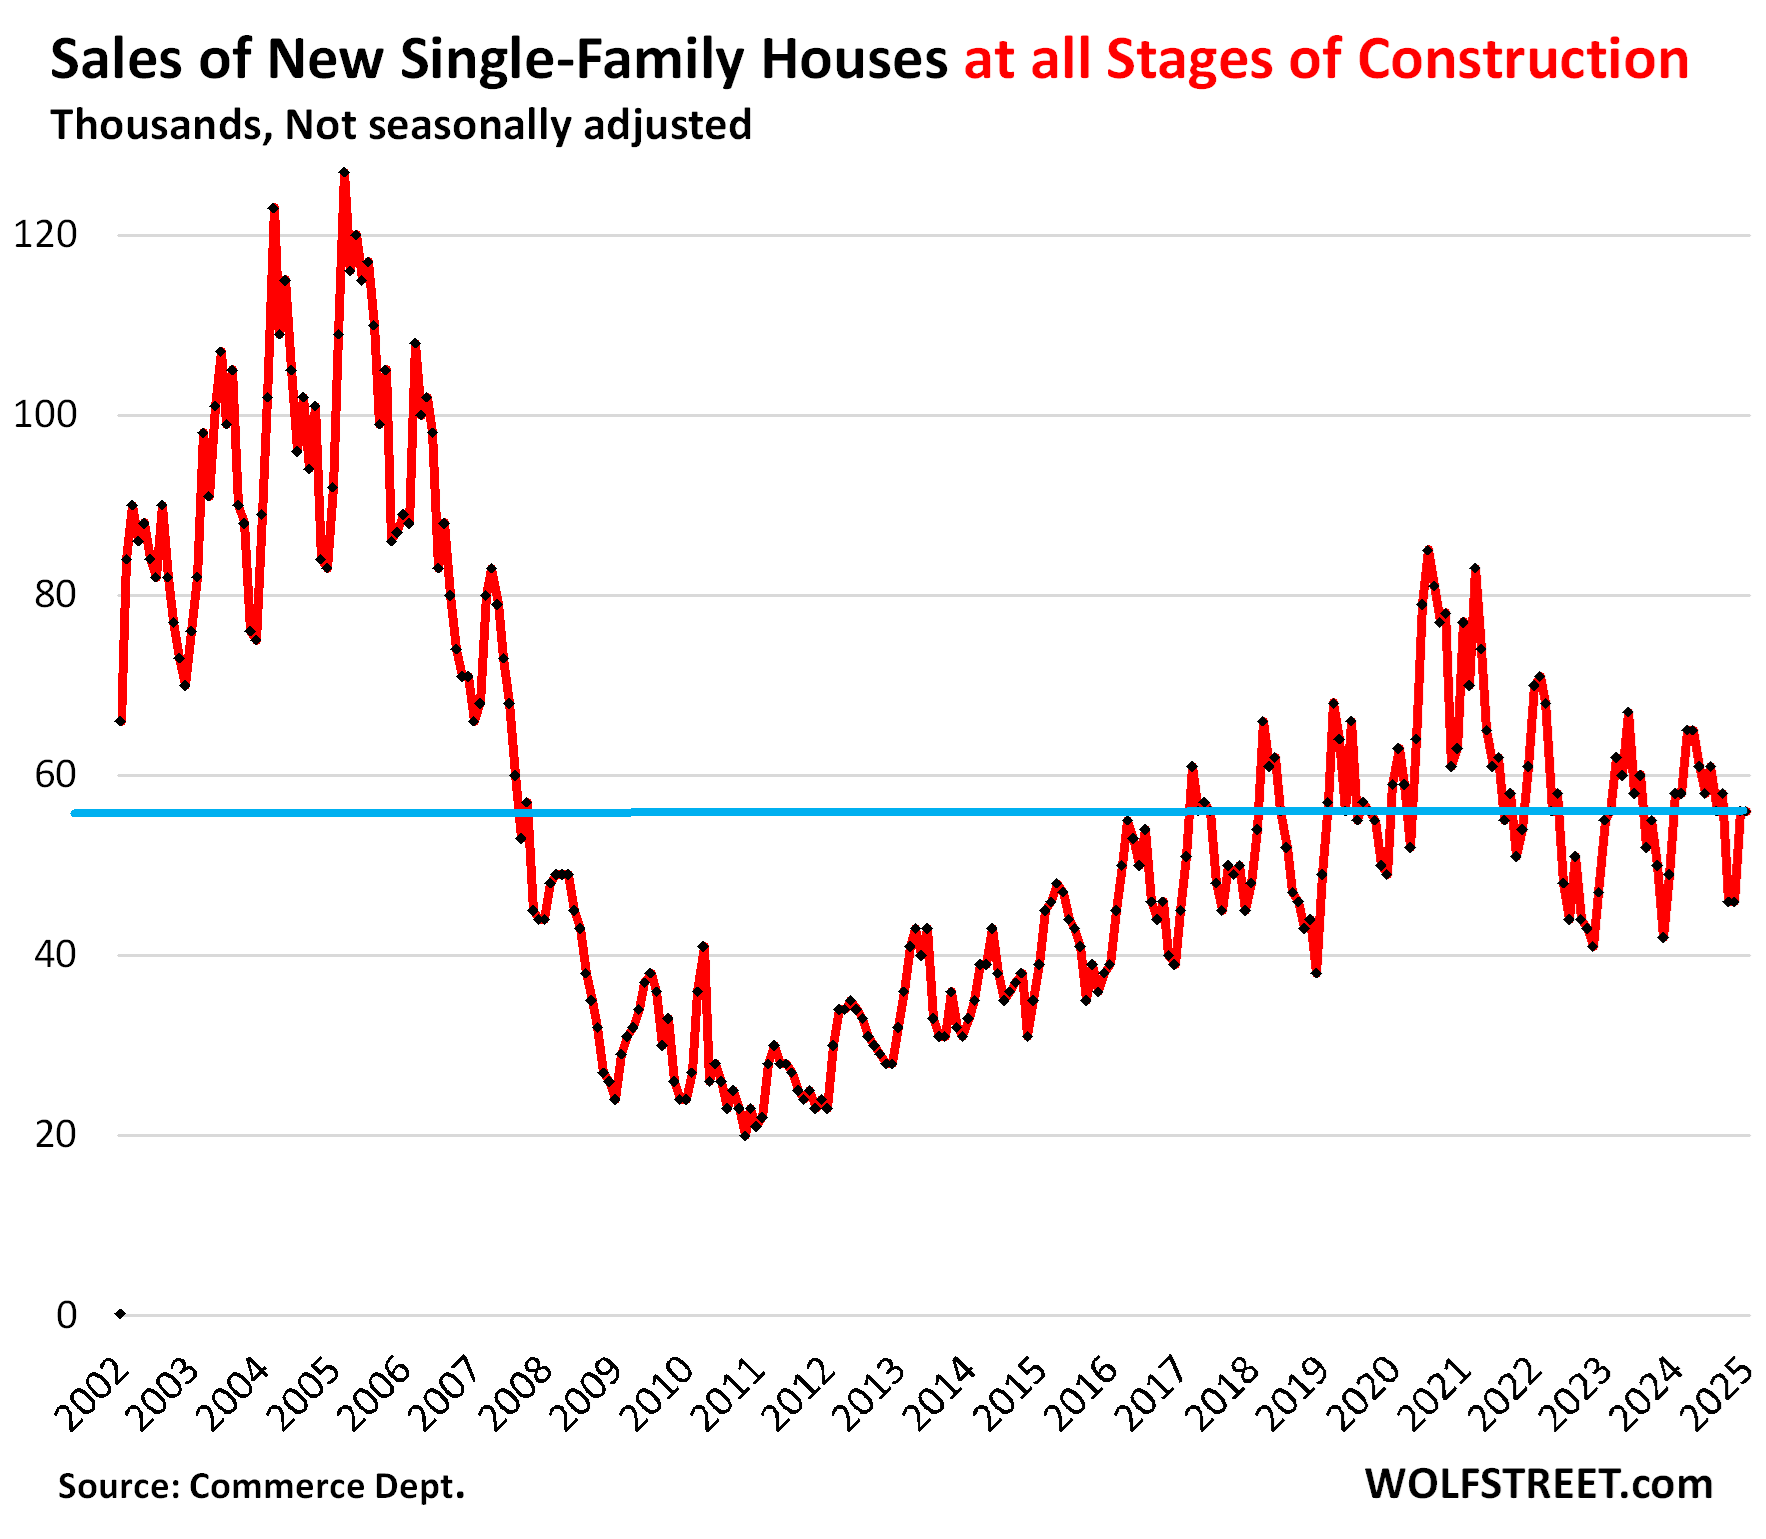
Overall sales dip despite reduced prices & higher incentives.
Sales of new houses at all stages of construction dropped by 3.4% from a year ago, and by 11% from January 2019, to 56,000 houses, not seasonally adjusted, despite all the promos out there. Last year, they had held up at decent levels. This comes as sales of existing homes in January also fell, after having tanked last year to the lowest level since 1995.
Homebuilders have been selling houses at a slower clip than they’ve been building them, which is why inventory levels have surged.
These sales are based on contract sales, not on closed sales. Things can happen that prevent contracts from closing, such as not being able to get affordable insurance.
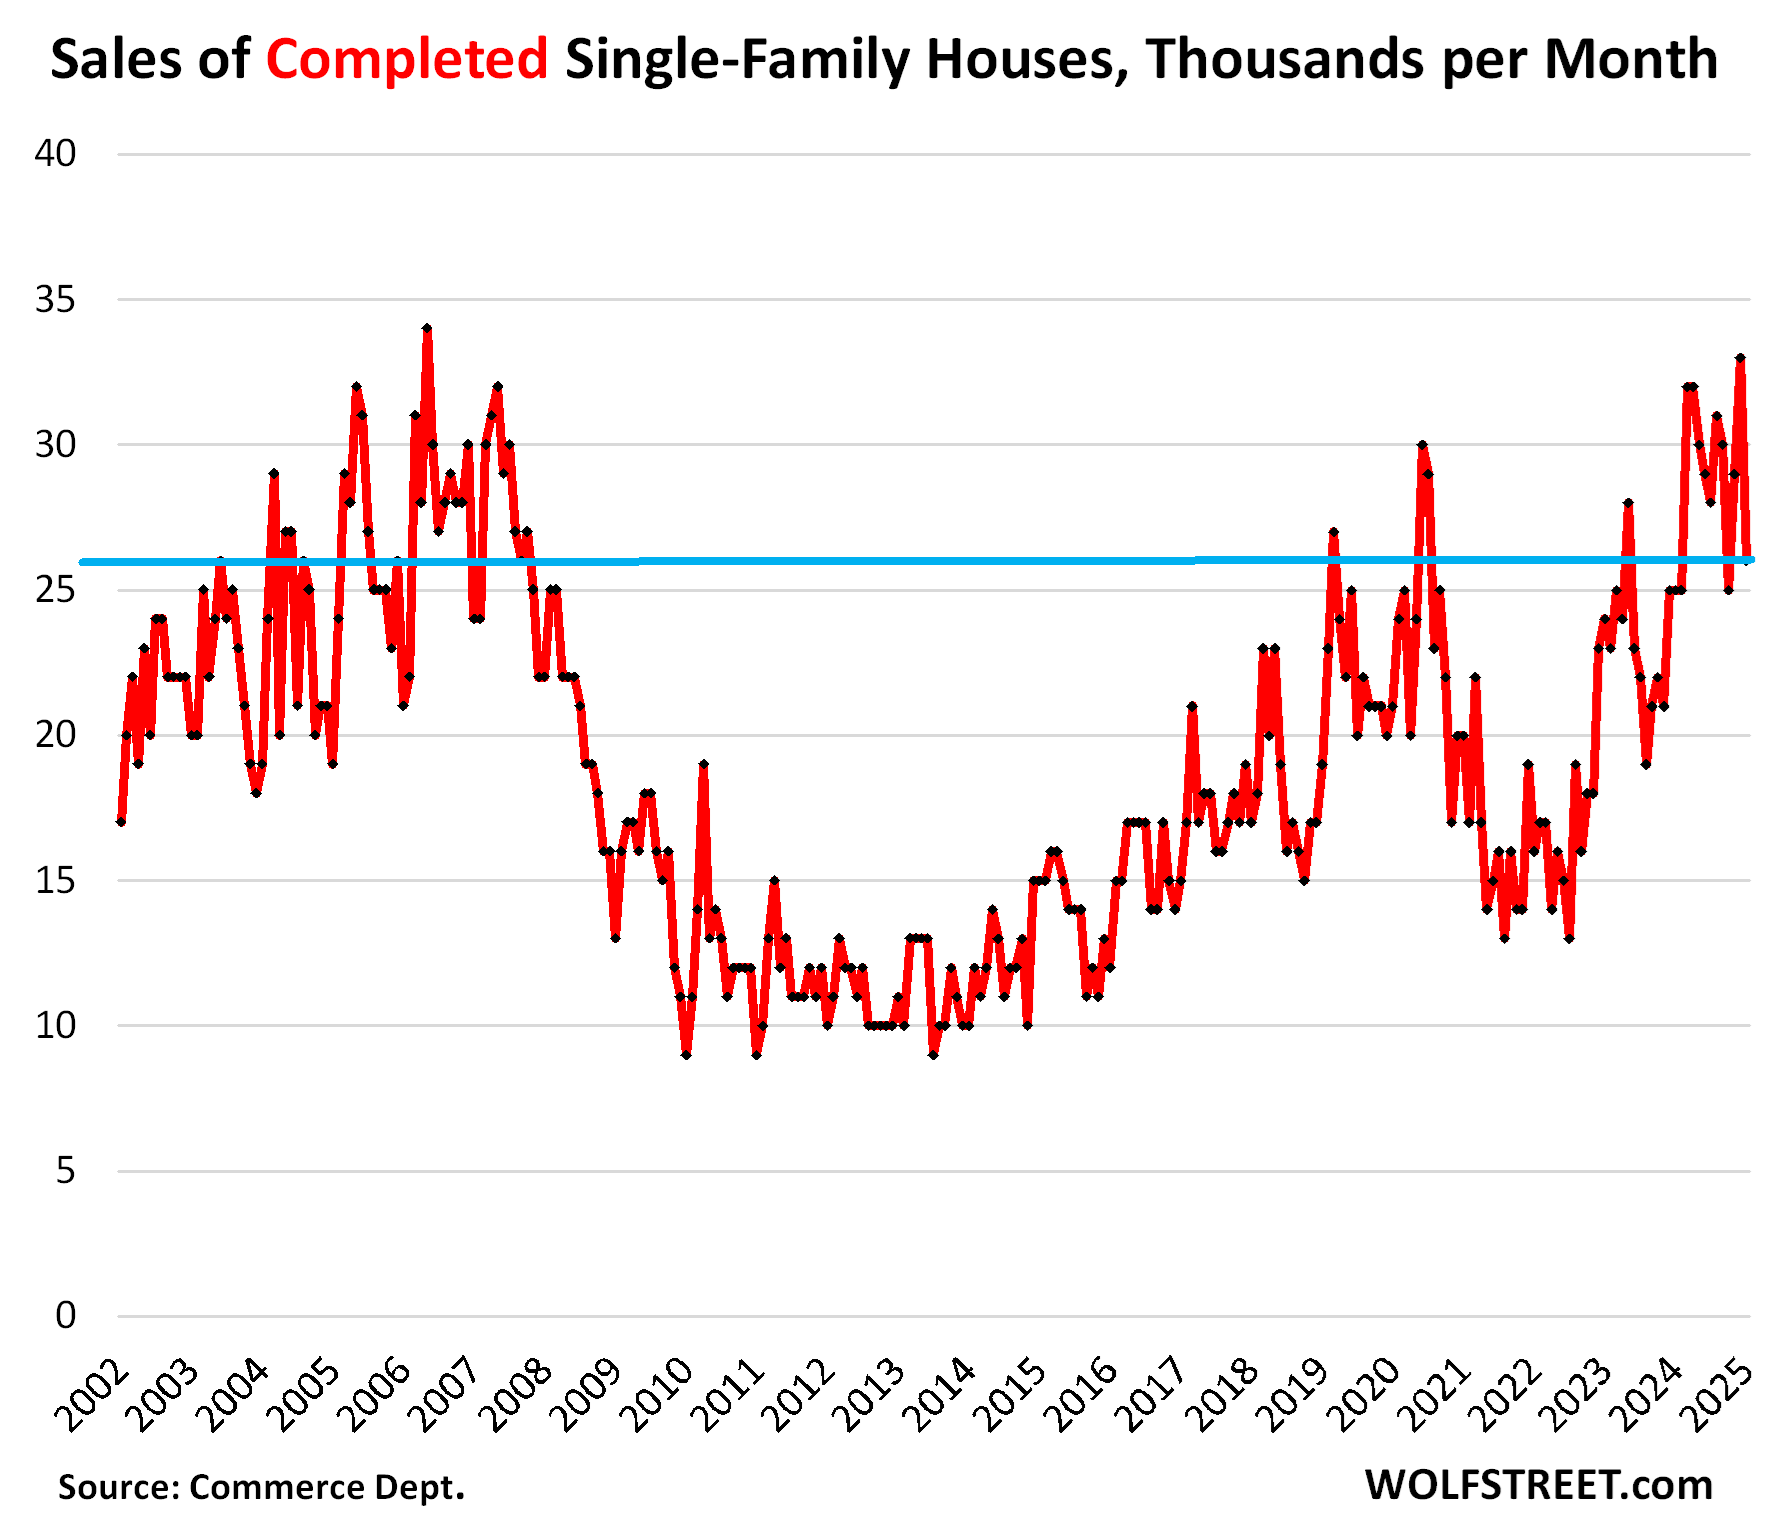
But sales of completed houses – propped up by incentives, mortgage rate buydowns, and lower prices – rose by 4.0% year-over-year in January, to 26,000 houses, up by 37% from December 2019.
The costs of mortgage-rate buydowns v. price reductions.
These types of discussions and disclosures have been creeping into homebuilders’ earnings calls. For example, we’ve learned from D.R. Horton [DHI] that they’re hedging mortgage-rate buydowns when those hedges blew up in late 2023, triggering big losses that had to be disclosed. Or from Lennar [LEN] that the costs of incentives per home delivered jumped to $48,100 in Q3, or 10% of revenue, up from $36,400 and 7.5% a year earlier.
Taylor Morrison Home Corporation [TMHC], during its Q4 earnings call two weeks ago, discussed some of the math involved in mortgage-rate buydowns v. price cuts. CEO Sheryl Palmer laid out an example (transcript via Seeking Alpha):
“Instead of having to discount the house or do a very expensive forward commitment, we’re assisting a consumer, guaranteeing that they’re going to have a 1% reduction to the market rate.
“Let me take a $500,000 house with a 20% down payment, a 400,000 loan, to do that it’s costing me approximately $16,000.
“To get that consumer to the same monthly payment [via price cut], it would cost me $60,000 to $65,000 price adjustment.
“So, when I can use these tools most efficiently to help that consumer and I’m using $16,000 as compared to what we’re seeing things in the market today that are 2.99%, 3.99%, those can cost 700 to 900 basis points. We’re doing some of these programs at a fraction, and we’re not taking it off the price, which is also protecting our margin.”
But costs of incentives are not reflected in the “Contract Price.”
The Census Bureau tracks contract prices, but the costs of the mortgage-rate buydowns and the costs of other incentives are not part of them.
These costs are included in the gross profit margins of the home builders, and are therefore reflected on homebuilders’ financial statements. They’re just not part of the contract prices that the Census Bureau tracks.
The incentives such as Lennar’s closing cost credit of $6,000 and $7,720 appliance package, and the costs of the mortgage-rate buydown to 3.99% are not part of the contract prices. The $16,000 cost at Taylor Morrison to buy down the rate of a $400,000 mortgage by 1% is not part of the contract price.
But the $50,000 price reduction offered by Lennar in its ad is part of the contract price when that home sells.
The median contract price of new single-family houses sold at all stages of construction – a super-volatile figure that jumps randomly up and down and is often revised sharply – jumped to $446,300 in January.
But the prior two months were revised substantially lower. November was revised down to $396,400, the lowest since July 2021.
With these two downward revisions and the jump in January (likely to be revised down over the next two months), the three-month average rose to $419,200, down by 5.2% from the peak in October 2022.
The six-month average, which irons out most of the month-to-month zigzags and revisions, ticked up to $418,500, same as in October 2024, and down by 4.5% from its peak in October 2022.
Again, these contract prices do not include the substantial costs to homebuilders of mortgage rate buydowns and other incentives, though they do include price cuts.

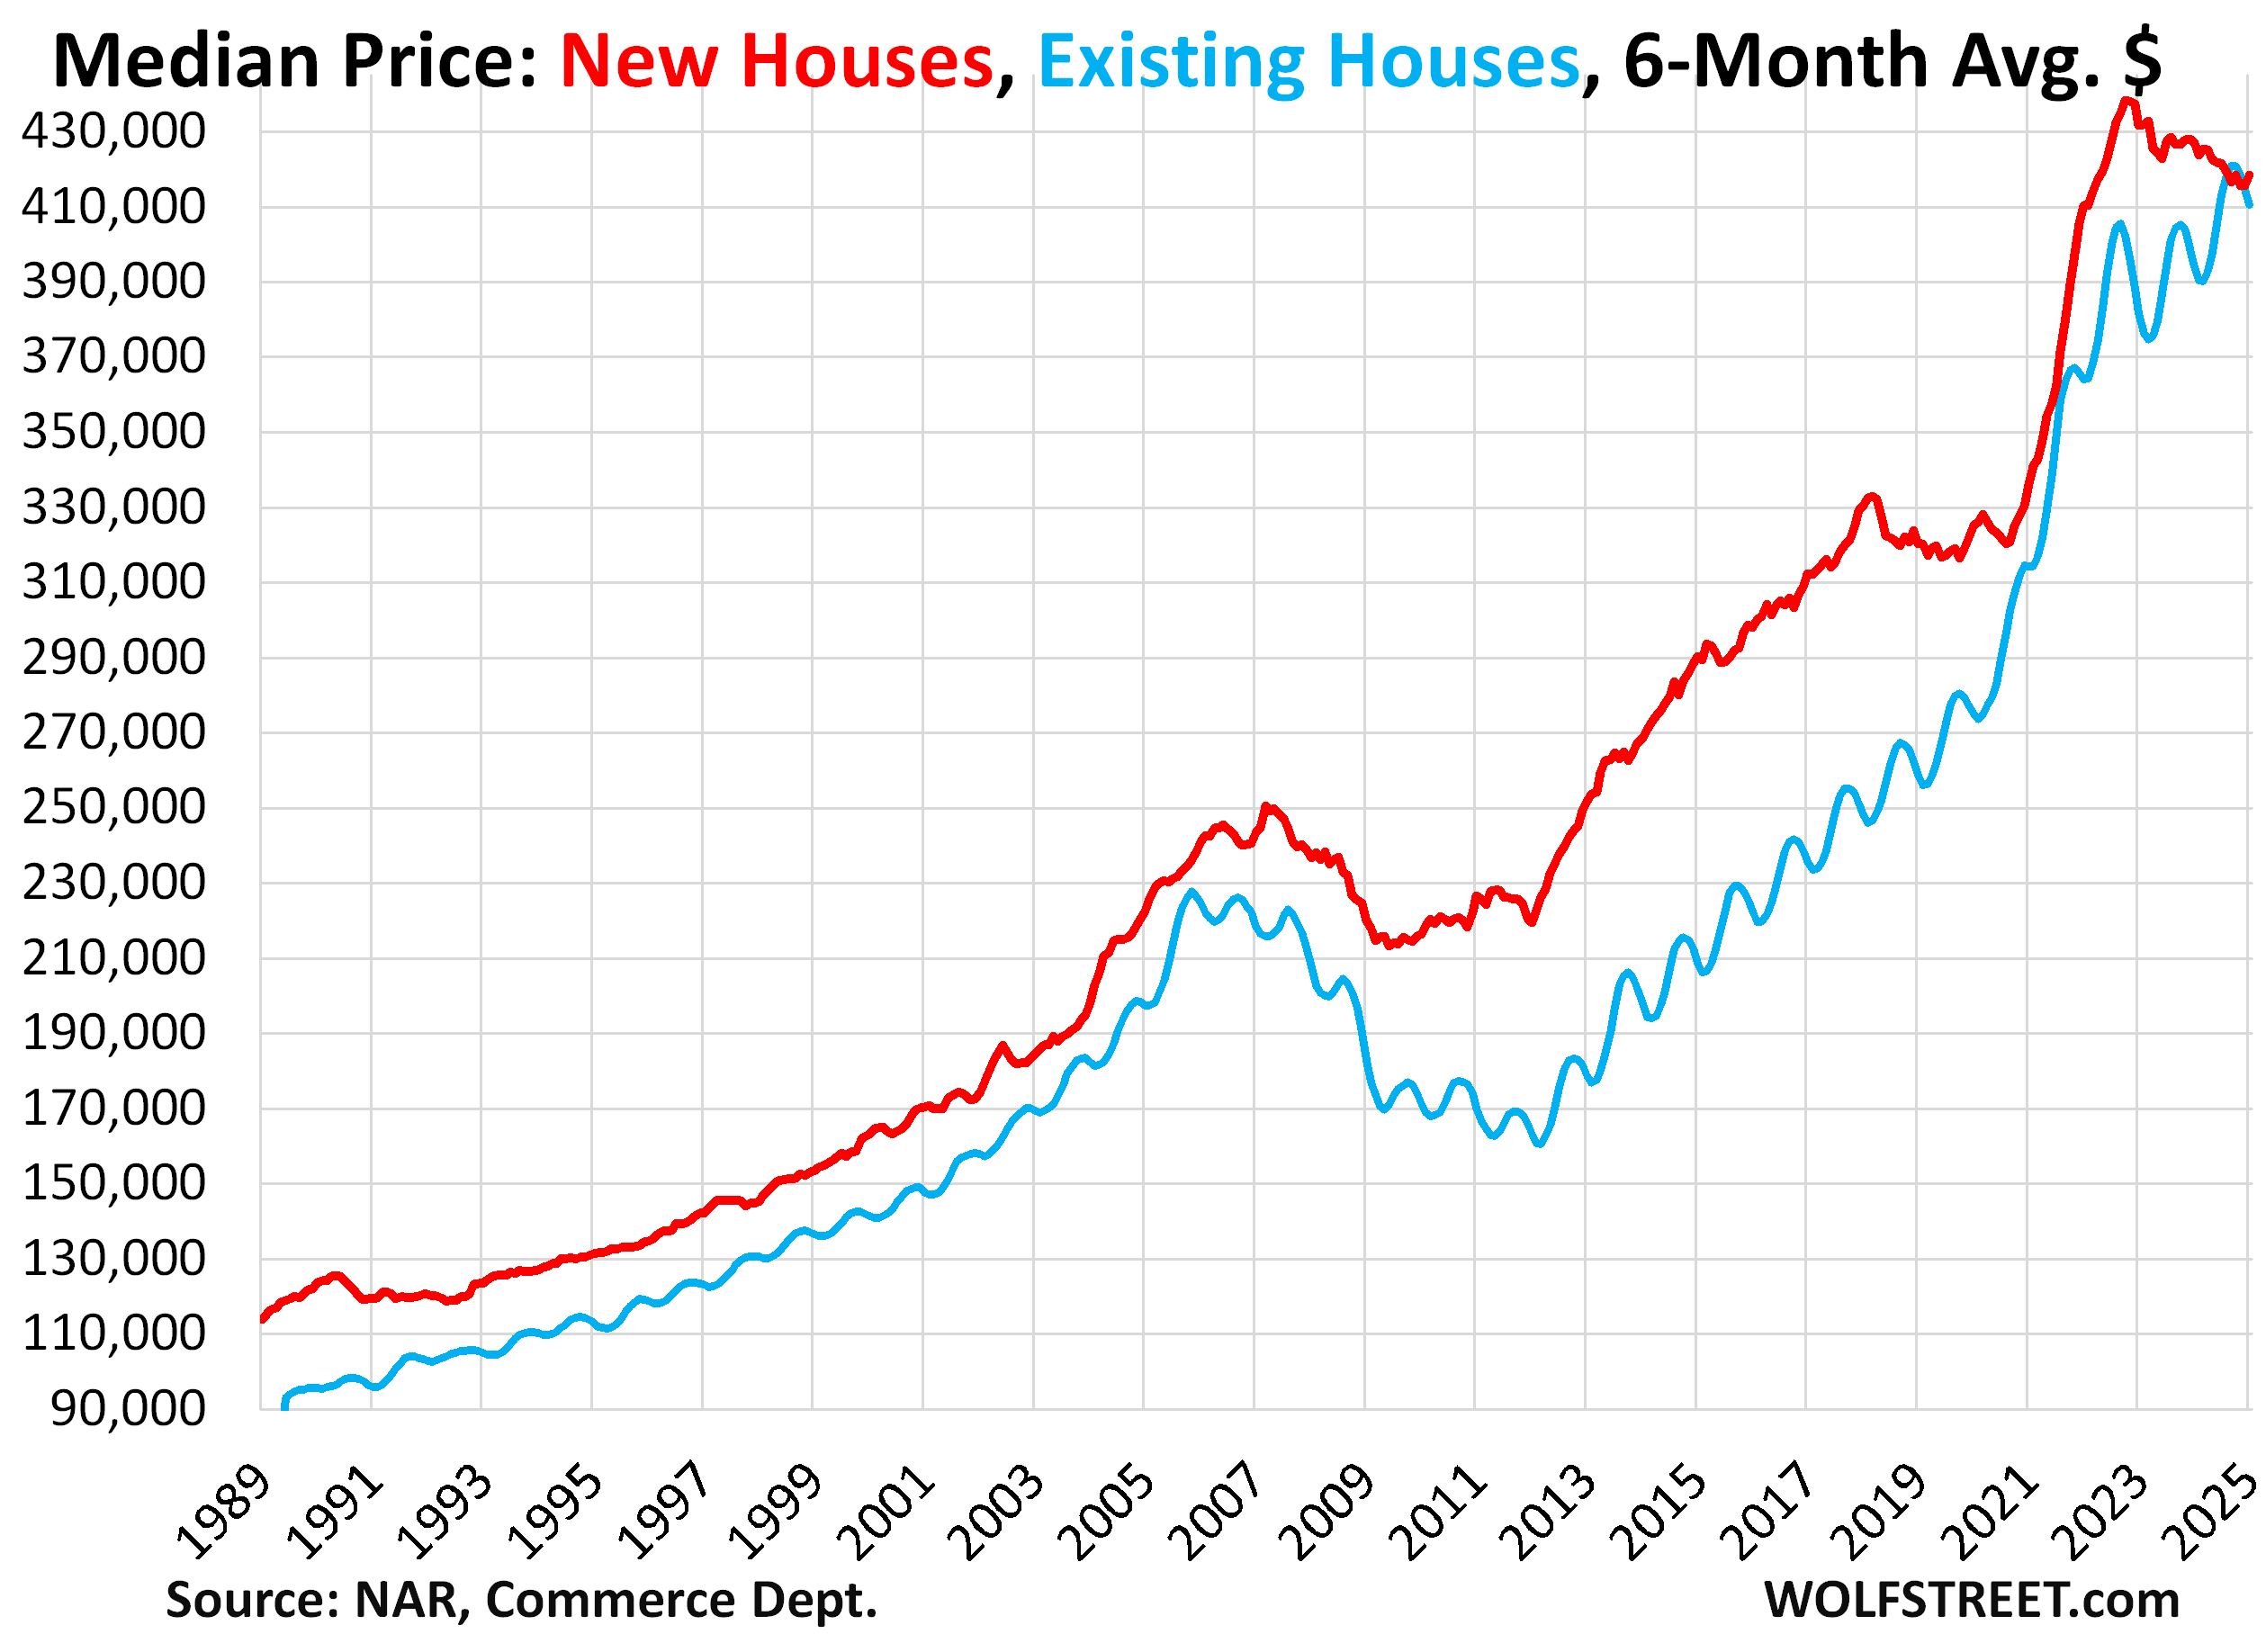
Prices of new houses versus existing houses.
From 1989 through 2023, the median contract price (six-month average) of new houses exceeded the median closed price of existing houses (six-month average) all of the time, with new being usually 5-30% more expensive than used. This scenario changed for the first time in 2024, which explains why homebuilders’ sales have been decent, while sales of existing homes have plunged, as some buyers shifted from buying overpriced used to buying new.
Enjoy reading WOLF STREET and want to support it? You can donate. I appreciate it immensely. Click on the mug to find out how:

![]()
The post Inventory of New Houses for Sale Highest since 2007. Builders Push Mortgage-Rate Buydowns, Price Cuts, and Incentives appeared first on Energy News Beat.
“}]]
