 [[{“value”:”
As a growing population financed more costly purchases, total debt rose. But income rose even faster in recent quarters.
By Wolf Richter for WOLF STREET.
Total household debt outstanding ticked up by $71 billion in Q3, or by 0.57%, from Q2, to $17.9 trillion, according to the Household Debt and Credit Report from the New York Fed today. Year-over-year, total household debt grew by 3.7%. Debt grew due to a mix of several factors:
- More borrowing capacity: Wage increases and the larger number of workers produced substantially higher overall personal income, which increased borrowing capacity.
- Higher prices: Homes, vehicles, and other goods and services that people finance got more expensive over the years — Home prices have exploded by about 50% since 2020; and consumer price inflation, as measured by CPI has surged by 22% over the same period, and those who borrowed to purchase homes and other things had to finance much larger amounts, but they had more income to do so.
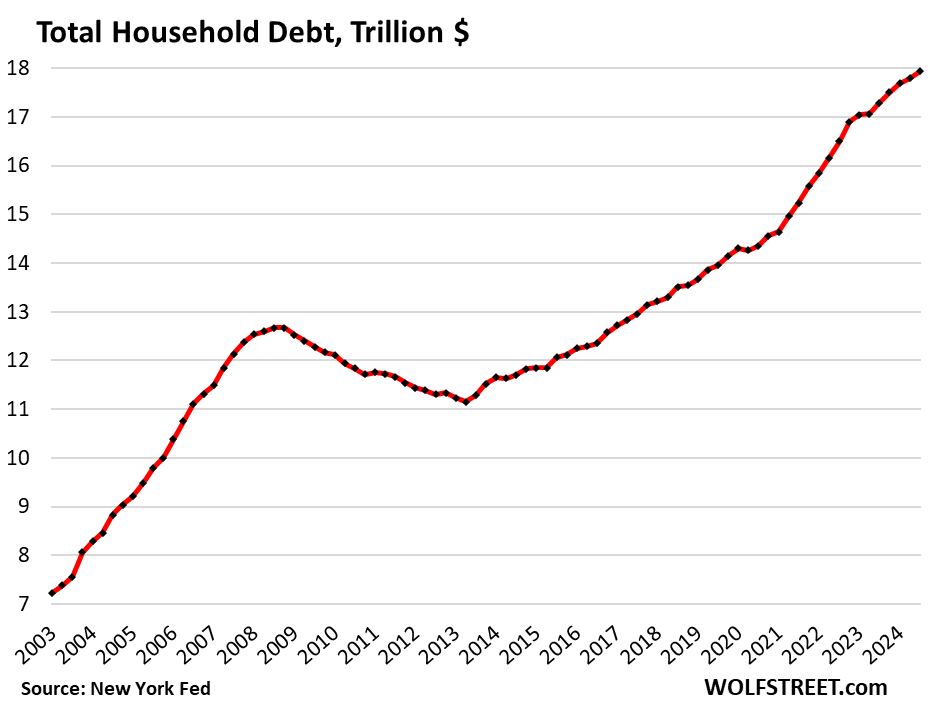
All categories – mortgages, HELOCs, auto loans, credit cards, other revolving credit, and student loans – increased quarter-to-quarter and year-over-year. We’ll get into the details of each category in a series of separate articles over the next few days. Today, we look at the overall situation, along with delinquencies, collections, foreclosures, and bankruptcies.
The relative burden of household debt.
One of the ways to measure the overall burden of debt on households is to compare the debt levels to their income that is available to pay for debt service.
We use “disposable income” for that purpose. That’s income from all sources except capital gains; so income from after-tax wages, plus from interest, dividends, rentals, farm income, small business income, transfer payments from the government, etc. This is essentially the cash that consumers have available to spend on housing, food, cars, debt payments, etc. And what they don’t spend, they save.
Disposable income grew by 0.8% in Q3 from Q2, and by 5.5% year-over-year, according to data from the Bureau of Economic Analysis. So quarter-over-quarter, disposable income rose at the same pace as total consumer debts, and the burden of the debt remained the same; while year-over-year, disposable income rose nearly 2 percentage points faster than debt, and year-over-year the burden declined.
The ratio of 82% in Q3 was historically low, bested by only a few quarters during the free-money-stimulus era that had briefly inflated disposable income beyond recognition.
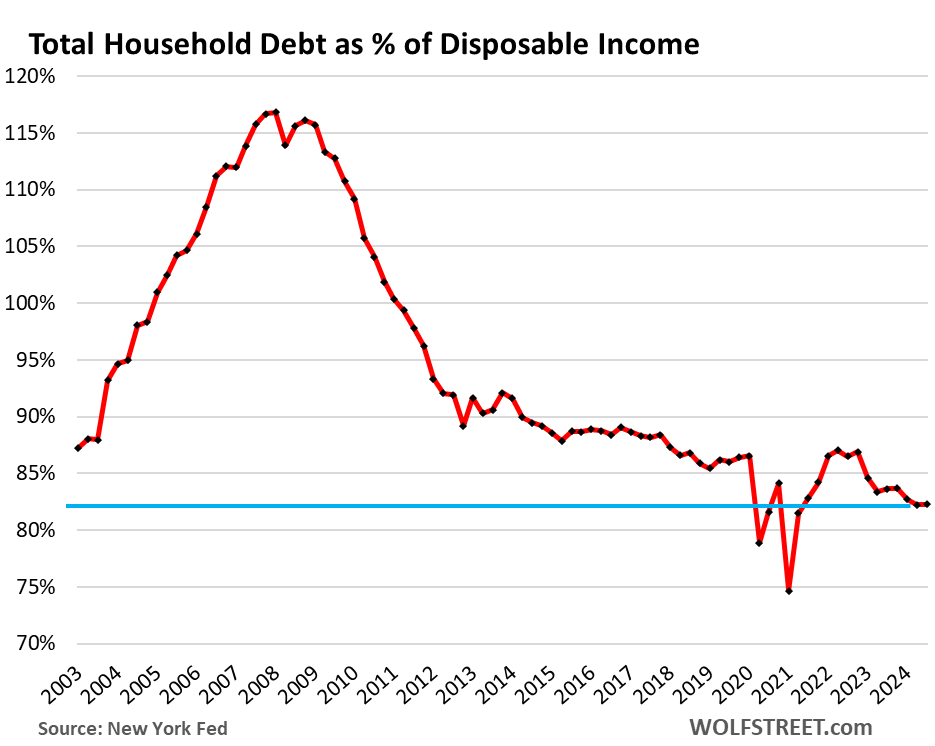
So the aggregate balance sheet of consumers is in good shape – the heavily leveraged entities in the US are the federal government and businesses, not consumers.
But in the runup to the Financial Crisis, consumers were mightily overleveraged, with debt-to-disposable-income ratios exceeding 115%, and then the leverage blew a fuse. Our Drunken Sailors, as we’ve come to call them lovingly and facetiously, have learned a lesson and have become a sober bunch, most of them, not all.
Serious delinquencies form a frying-pan pattern.
A small portion of our Drunken Sailors is always in trouble, they have subprime credit scores because they’ve been late with their payments, have defaulted on their obligations, etc. Subprime doesn’t mean “low income,” it means “bad credit,” and goes across the income spectrum. They’re a relatively small portion of consumers. And they’re always in flux: Some people get into trouble, and their credit scores drops to subprime, while others are working their way out of subprime as they cure their credit problems.
But the vast majority of our Drunken Sailors are keeping their credit in decent to excellent shape.
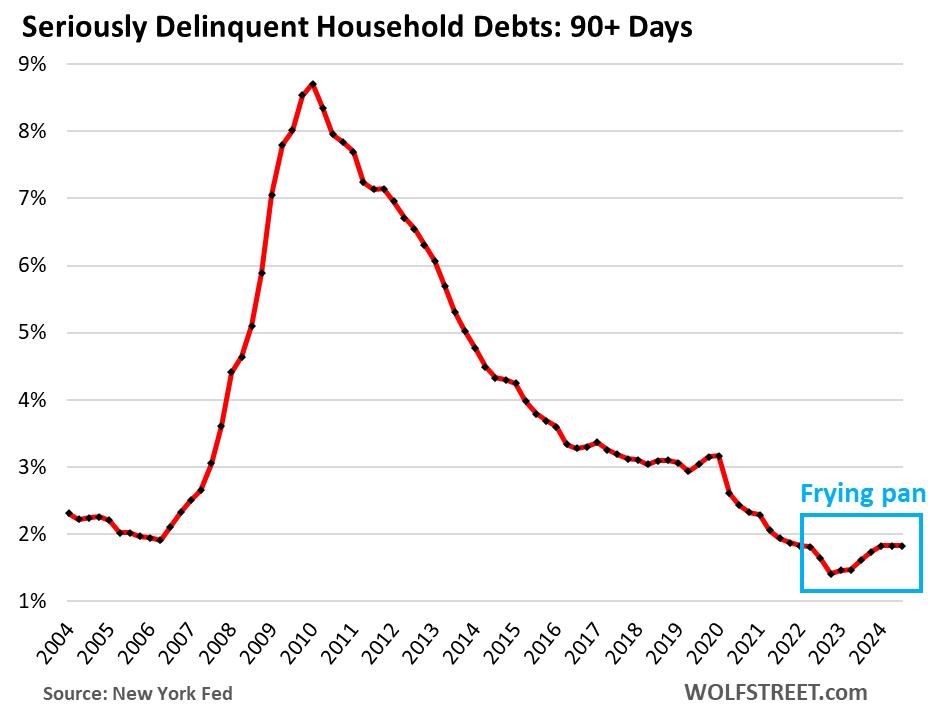
Household debts that were 90 days or more delinquent by the end of Q3 remained unchanged for the third month in a row, at a historically low 1.8% of total balances outstanding, lower than any time before the free-money-era of the pandemic.
The drop during the free-money era and then the climb back to what are still historically low levels forms what we’ve been calling a frying-pan pattern that is now cropping up a lot in the world of debt problems:
Foreclosures from frying-pan pattern.
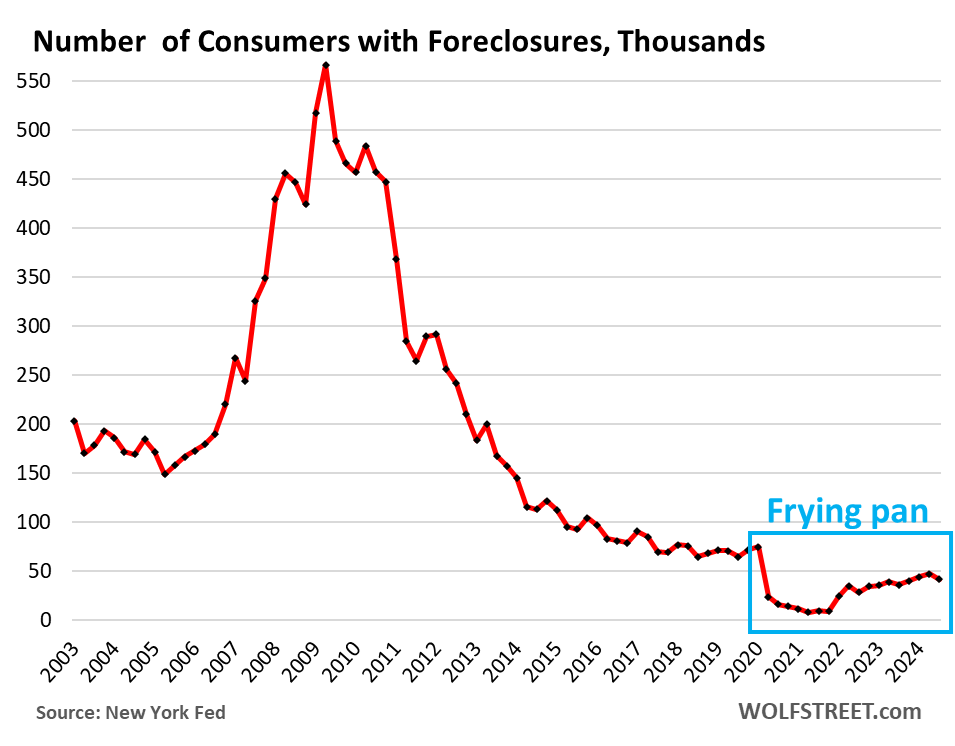
There were 41,520 consumers with foreclosures in Q3, down from 47,180 in Q2, and compared to 65,000 to 90,000 in the years 2017 through 2019. Outside of the free-money and mortgage-forbearance era during the pandemic, which reduced the number of foreclosures to near zero, there was never a period in the data with fewer foreclosures.
And this frying-pan pattern makes sense: After three years of ballooning home prices, most homeowners, if they get in trouble, can sell their home for more than they owe on it, pay off the mortgage, and walk away with some cash, and their credit intact, It’s only when home prices spiral down for years, combined with high unemployment rates, that foreclosures become a problem.
Third-party collections not even in a frying-pan pattern.
A debt goes to a collection agency – the third party – after the lender has given up on the delinquent loan, has written it off, and has sold the account for cents on the dollar to a company that specializes in squeezing debtors until they cough up some money.
The percentage of consumers with third-party collections dipped to 4.60%, a new record low in the data:

Consumers with bankruptcies form frying-pan pattern.
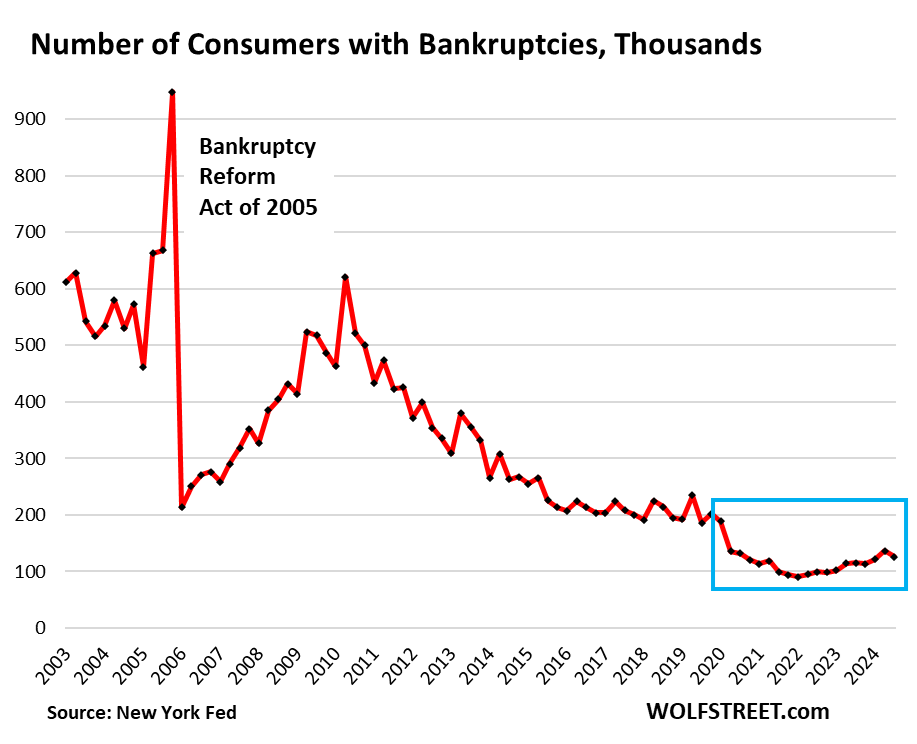
The number of consumers with bankruptcy filings dipped to 126,140 in Q3, lower than any time before the free-money era. In Q2, there were 136,180 consumers with bankruptcy filings. In 2017-2019, during the Good Times before the pandemic, the number of consumers with bankruptcy filings ranged from 186,000 to 234,000, which had been historically low.
And the frying-pan pattern crops up again, this one with a short and low burn-your-fingers handle.
We’re going to discuss the details of housing debt, credit card debt, and auto debt in separate articles over the next few days. So stay tuned.
Enjoy reading WOLF STREET and want to support it? You can donate. I appreciate it immensely. Click on the beer and iced-tea mug to find out how:
Would you like to be notified via email when WOLF STREET publishes a new article? Sign up here.
![]()
The post Household Debt, Delinquencies, Collections, Foreclosures, and Bankruptcies: Our Drunken Sailors and their Debts in Q3 2024 appeared first on Energy News Beat.
“}]]

