 [[{“value”:”
Subprime is always in trouble, and now, after the reckless-subprime lending era, more so. Prime is in pristine shape. Car-Mart joins our Imploded Stocks.
By Wolf Richter for WOLF STREET.
Total balances of auto loans and leases for new and used vehicles rose by 1.1%, or by $18 billion in Q3 from Q2, and by 3.1% year-over-year, to $1.64 trillion, according to data from the New York Fed’s Household Debt and Credit Report.
But the 3.1% year-over-year growth rate was the second-smallest since Q1 2021, behind only Q2 this year (2.8%) and the third smallest since Q4 2018.
One of the reasons balances grew at a relatively slow rate is that more people are paying cash for their vehicles due to the higher interest rates. For new vehicles, the share of cash purchases rose to 20% in recent quarters, from 18% in Q1 2022. For used vehicles, the share of cash purchases rose to 64%, from 59% in Q1 2022, per Experian data. We’ll look at other reasons for the slower increase in a moment.
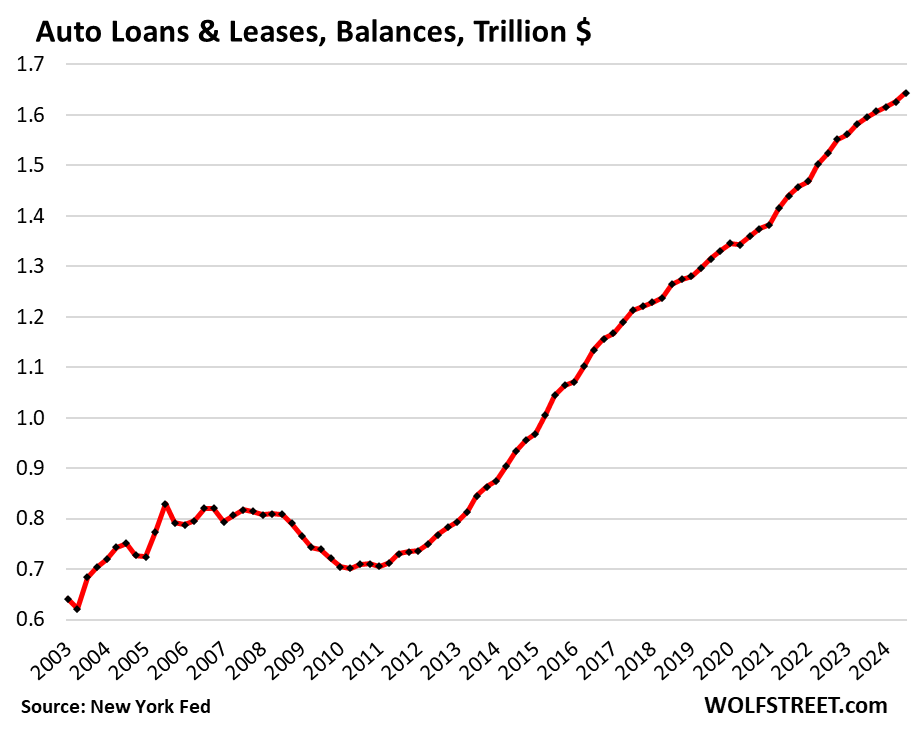
Auto loan balances over the past 20 years ballooned by 135%, but not because of spectacular unit-sales growth – far from it, new vehicle sales, responsible for the vast majority of auto loan and lease balances, have stagnated for two decades, interrupted by two big plunges:
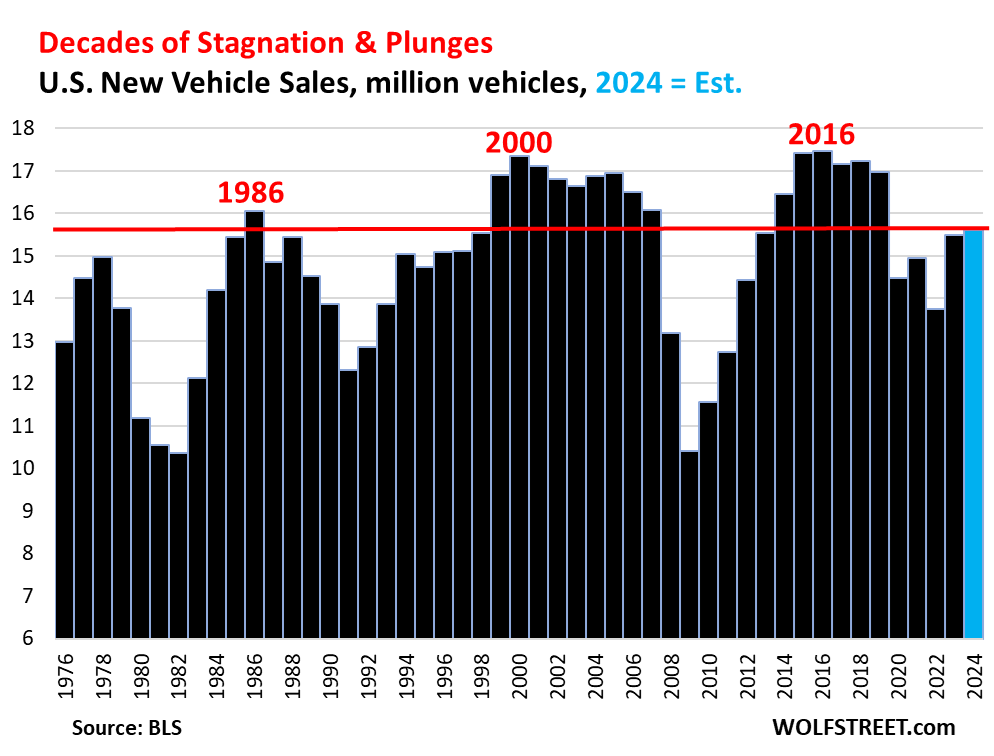
Rampant price increases and automakers taking their models upscale are what drove up auto loan balances through 2020. Then in 2021 and 2022, prices exploded and pushed up dramatically the amounts financed, even as sales volume plunged due to the vehicle shortages.
But prices of new vehicles started edging down in 2023 and through Q3 2024, just a tad – new vehicles, with their much higher price tags and 80% finance penetration dominate auto loans and leases. Used vehicle prices plunged over the same period, but with their much smaller loan amounts and small 35% finance penetration, they play a much smaller role in this equation (details and charts of new-vehicle CPI and used-vehicle CPI).
Those slight price declines of new vehicles kept a lid on the amounts to be financed and slowed the growth of the auto loan and lease balances so far this year.
The burden of auto loans and leases.
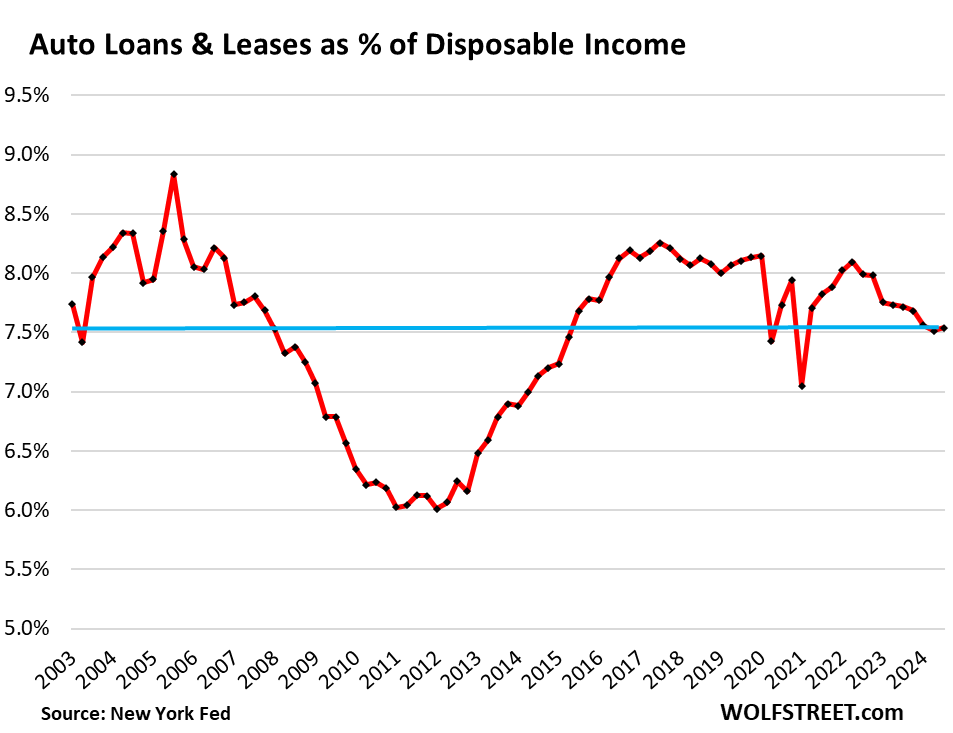
One way to measure the burden of auto-loan debt on households is the comparison to their disposable income, which includes after-tax wages, plus income from interest, dividends, rentals, farms, small businesses, transfer payments, etc. It’s what households have left over to pay for their costs of living and service their debts.
Rising incomes and stagnating or declining new-vehicle unit sales volume should have caused the burden of auto loans and leases to decline sharply over the past two decades. But rampant price increases over the years saw to it that the burden only moved up and down in a fairly narrow band, with the exception of the 2008-2012 collapse of the auto industry in the US.
As prices began declining in mid-2022, slowing the growth of the auto loan balances, disposable income rose sharply. And so, the debt-to-disposable income ratio started declining two years ago, and in Q1 2024 dipped to 7.5% and has roughly stayed there through Q3.
Subprime is always in trouble, which is why it’s subprime.
Subprime lending is largely confined to used vehicles, particularly to older used vehicles, sold by specialized subprime dealer-lender chains, or financed by specialized subprime lenders. All these lenders then package these auto loans into Asset Backed Securities (ABS) and sell them as bonds to pension funds and other institutional investors that buy them for their higher yield.
Of the auto loans originated in Q3, 16.9% by balance of were subprime, down from the prepandemic range of 19% to 25%, according to New York Fed data.
During the free-money era, the specialized subprime dealer-lenders loosened their credit standards and got very aggressive. They built in huge profit margins into the vehicle sales amount and into the interest. At the same time, used-vehicle prices exploded. And the risks piled up. And when used-vehicle prices began to tank and interest rates began to jump in 2022 and 2023, those risks came home to roost. In 2023, several PE-firm-owned subprime-specialized dealer-chains filed for bankruptcy.
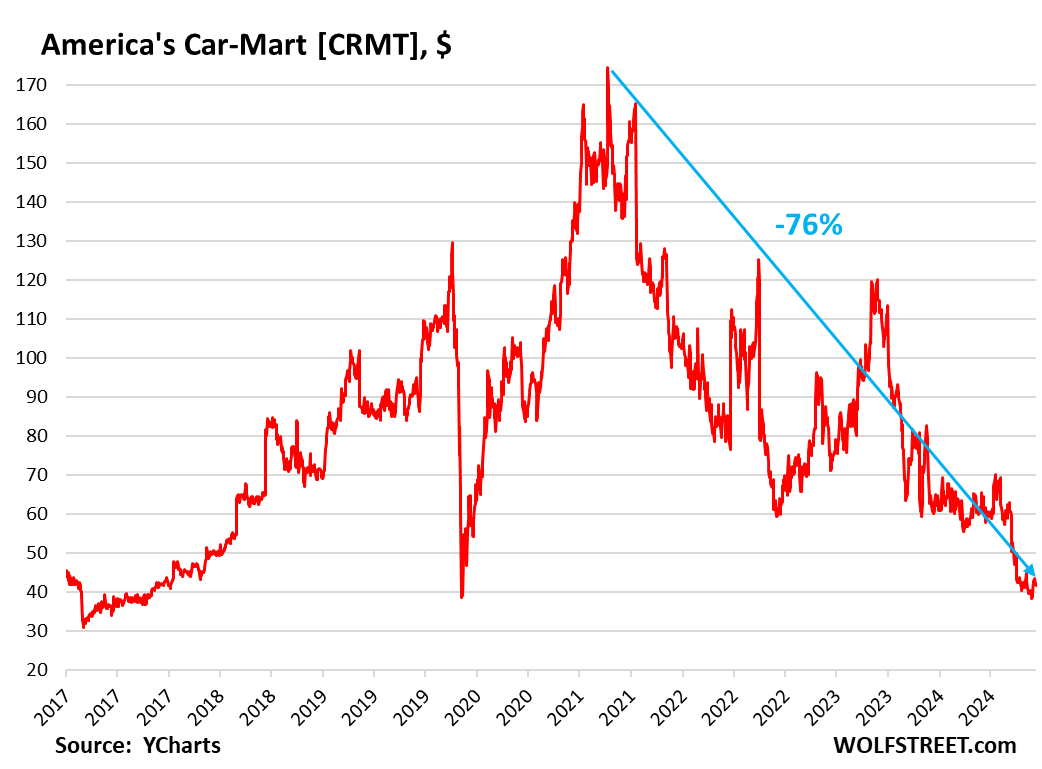
Even the large publicly traded subprime dealer-lender America’s Car-Mart disclosed massive problems in December 2023, and its shares [CRMT] tanked. On November 1, they closed at $38.21, the lowest since September 2017. On Friday, they closed at $41.77, still down 76% from the all-time high in May 2021, and now in our pantheon of Imploded Stocks.
Delinquency rates: total, subprime, and prime.
The total 60-plus day delinquency rate, as tracked by Equifax, was 1.55% in September. The highs this year had been in January (1.59%) and February (1.61%). This year’s range is up by about 50 basis points from the prepandemic range centered around 1.0%.
The overall delinquency rate has been rising since early 2023, reflecting the mix of the surging subprime delinquency rates and the pristine prime delinquency rate.
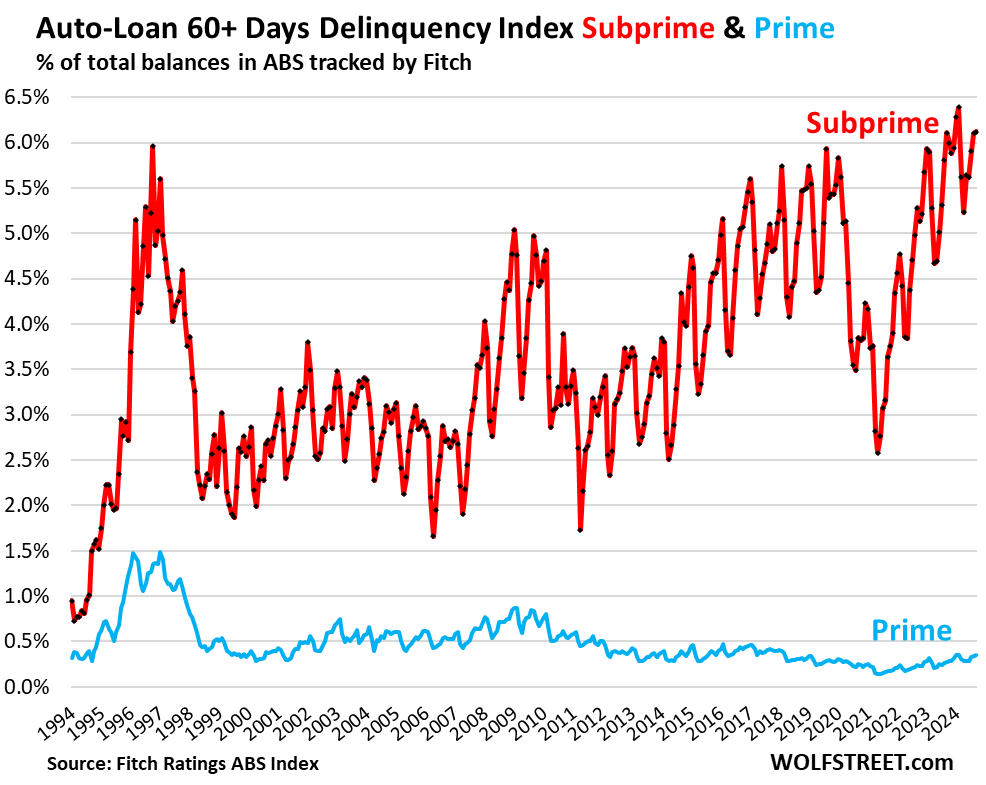
Fitch, which rates ABS backed by auto loans, splits out the delinquency rates for prime-rated auto loans (blue in the chart below) and subprime-rated auto loans (red). Subprime is always in trouble, and after the reckless-subprime-lending era more so than before. Prime is in pristine condition. And let’s remember: only 16.9% of auto loans originated in Q3 were subprime. It’s a small specialized part of auto lending.
The subprime 60-plus day delinquency rate in September remained at 6.1%, same as in August, and same as in September 2023, according to Fitch (red). The fact that the delinquency rate didn’t worsen year-over-year indicates that the spike in delinquencies out of the reckless-subprime-lending era has begun to slow. These delinquency rates peak in January or February. They hit an all-time high of 6.4% in February this year and may end up in the same neighborhood next February.
The prime 60-plus day delinquency rate has been in the 0.28% to 0.35% range all year (blue), which is minuscule. Even during the Great Recession, the prime delinquency rate rose to only 0.9% at the worst moments.
In case you missed the earlier parts of household debt and credit: Here Come the HELOCs: Mortgages, the Burden of Housing Debt, Serious Delinquencies, and Foreclosures in Q3 2024
And from a day earlier: Household Debt, Delinquencies, Collections, Foreclosures, and Bankruptcies: Our Drunken Sailors and their Debts in Q3 2024
Enjoy reading WOLF STREET and want to support it? You can donate. I appreciate it immensely. Click on the beer and iced-tea mug to find out how:
Would you like to be notified via email when WOLF STREET publishes a new article? Sign up here.
![]()
The post Auto-Loan Balances, Burden, Subprime & Prime Delinquency Rates, and Subprime Dealer America’s Car-Mart in Q3 2024 appeared first on Energy News Beat.
“}]]

