 [[{“value”:”
Americans far from “tapped out.” Credit card delinquency rate dips to 3.2% (Fed), “prime” delinquency rate 0.99% (Fitch), “subprime” gets over free-money hangover.
By Wolf Richter for WOLF STREET:
The Federal Reserve today released the delinquency rates for credit cards issued by banks in Q3, and so we now have a trio of credit card delinquency rates through September that all measure different aspects of credit card delinquencies:
- Federal Reserve: 30-day delinquency rates on credit cards issued by commercial banks (3.23%)
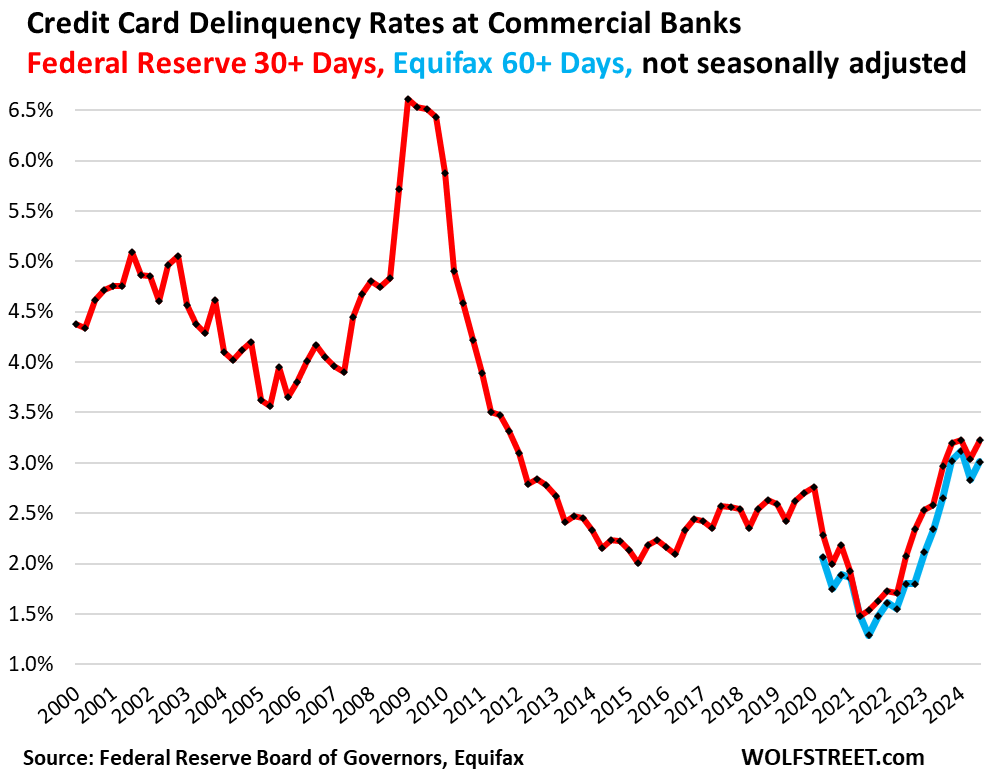
- Equifax: 60-day delinquency rate on credit cards issued by commercial banks (3.01%)
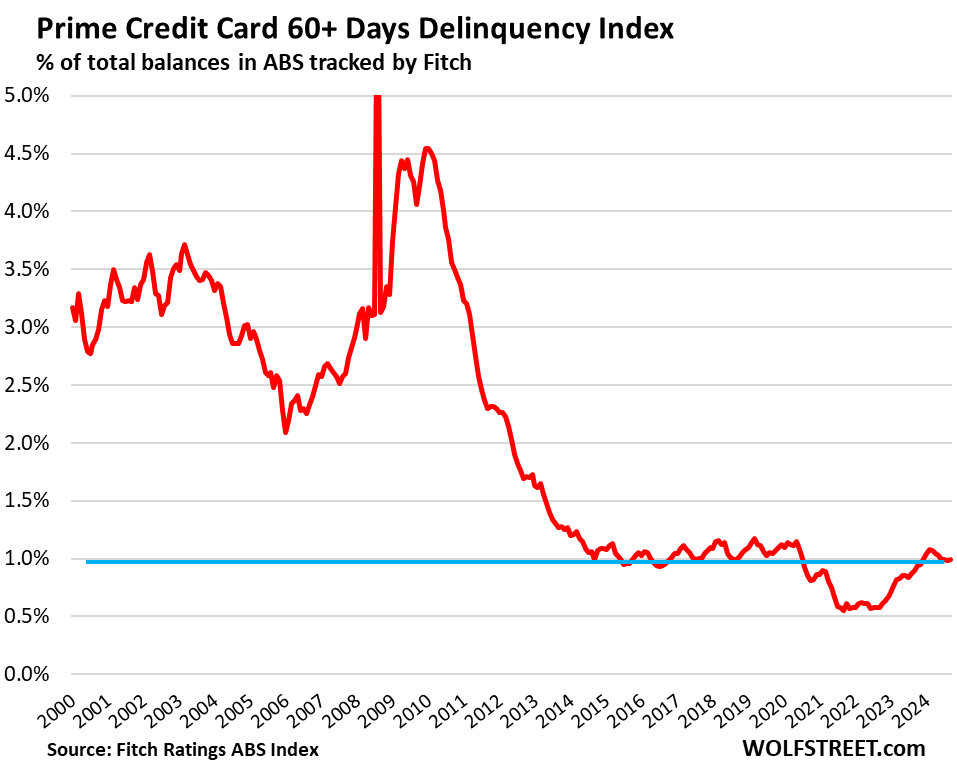
- Fitch: 60-day delinquency rate on “prime” rated credit cards (excludes subprime) packaged into Asset Backed Securities (0.99%).
The Federal Reserve’s 30-plus day delinquency rate on credit cards issued by all commercial banks dipped a hair to 3.23%, seasonally adjusted, according to the data released today. The increase out of the pandemic was driven by the subprime hangover, while prime credit cards are in pristine shape, as we’ll see in a moment.
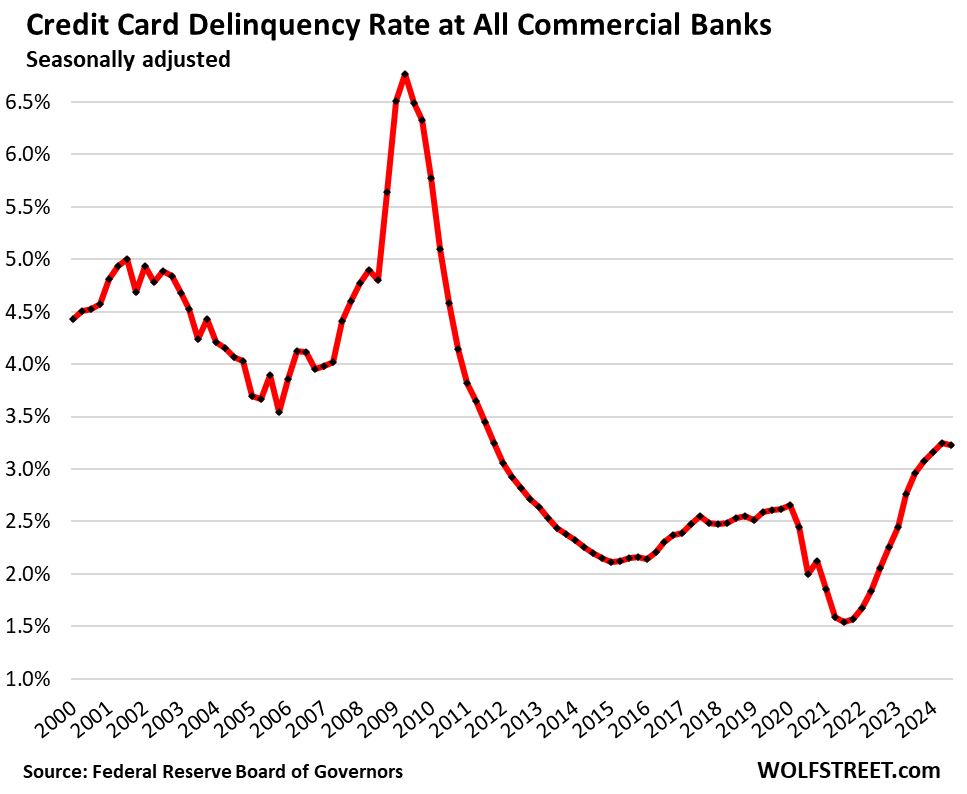
Not seasonally adjusted, the Federal Reserve’s 30-plus day delinquency rate ticked up to 3.23% at the end of Q3. The increase was in line with the pre-covid seasonal increases for third quarters, which is why on a seasonally adjusted basis, the delinquency rate dipped a hair. The increase undid part of the decline in Q2 (red in the chart below).
Equifax’s 60-plus day (“severe”) delinquency rate rose to 3.01% in September, below the highs this year of 3.11% to 3.12% in January, February, and March, not seasonally adjusted (blue).
Subprime doesn’t mean low income, it means bad credit.
Delinquency rates on credit card balances plunged during the free-money era when people got piles of cash from stimulus payments, extra unemployment payments, PPP loans that were then forgiven, and in addition, they saved cash by not having to pay mortgage payments and rent payments during the era of mortgage forbearance, foreclosure moratorium, eviction moratorium, student loan moratorium, and whatever moratoriums. And people used that cash to catch up with their debts, and they used it to spend on stuff instead of loading up their credit cards. And so delinquency rates dropped to a historic low in Q2 2021. Then they began to rise again. And hangover-like, they overshot some.
The issue is always in subprime because subprime is always in trouble, which is why it’s subprime. Subprime means bad credit, not low income. That young dentist getting in over his head is a good example of high-income subprime. People get out of subprime credit ratings by catching up and reducing their debts, while other people get into it over their head and end up in subprime for a while.
And the rise in credit-card delinquencies is due to subprime cards.
Fitch Ratings splits “prime” from “subprime” and reports monthly the 60-day-plus delinquency rate for prime-rated credit cards whose balances have been packaged into Asset Backed Securities (ABS) and sold to investors. The prime delinquency rate in September remained at just below 1% (0.99%) for the fourth month in a row.
The New York Fed’s 12-month “Transition into Delinquency” always throws the financial media for a loop. Last week, some members of the financial press dished up what they wrongly called “delinquency rate,” when in fact it wasn’t an end-of-quarter delinquency rate (amount of delinquent credit card balances divided by the total credit card balances), but the New York Fed’s unique measure of a 12-month inflow into delinquency, without netting out the outflow, a measure that the New York Fed calls “transition into delinquency” and “delinquency transition rates,” which was 8.8% (and it declined). That’s not a delinquency rate. The New York Fed doesn’t release credit-card delinquency rates at all. But the reporters that put out that stupid clickbait were too lazy to look up the documentation on the New York Fed’s website.
Credit Card Balances are a partial measure spending, not of debt.
Credit card balances are a measure of consumer spending – including for expensive business trips that are reimbursed. They’re not a measure of borrowing because most balances are paid off by due date and never accrue interest, but allow cardholders to get their 1% or 2% cashback, airmiles, and other loyalty benefits. Credit cards are the dominant payment method used by consumers in the US, ahead of debit cards, and far ahead of other payment methods, such as checks or cash.
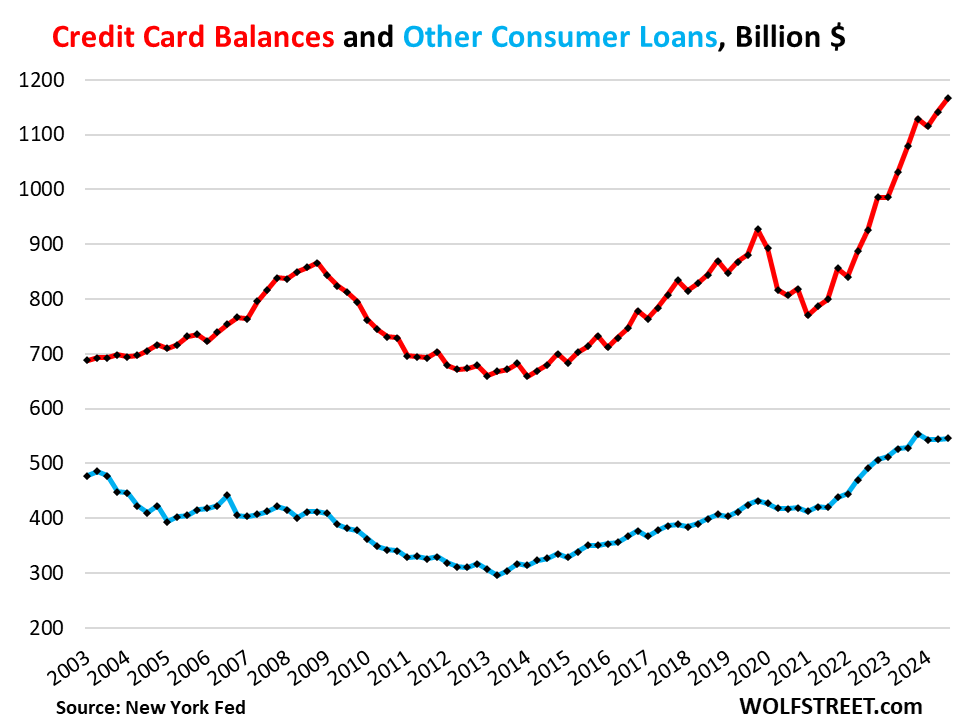
Credit card statement balances rose by $24 billion, or 2.1%, in Q3 from Q2, to $1.17 trillion, according to the New York Fed’s Household Debt and Credit report. Year-over-year, credit card balances rose by $87 billion, or by 8.1% (red line in the chart below).
These growth rates were in line with solid growth in consumer spending, including spending on travels, including reimbursed business travels, and with inflation.
“Other” consumer loans, such as personal loans, payday loans, and Buy-Now-Pay-Later (BNPL) loans remained essentially unchanged in Q3 for the third consecutive quarter, at $546 billion. Year-over-year, they rose 3.2% (blue line).
BNPL loans are short-term and interest-free loans that are subsidized by the merchant. They’re a modernized version of installment buying, a concept that has been around forever.
Income rose 142%, credit balances only 53% in 20 years.
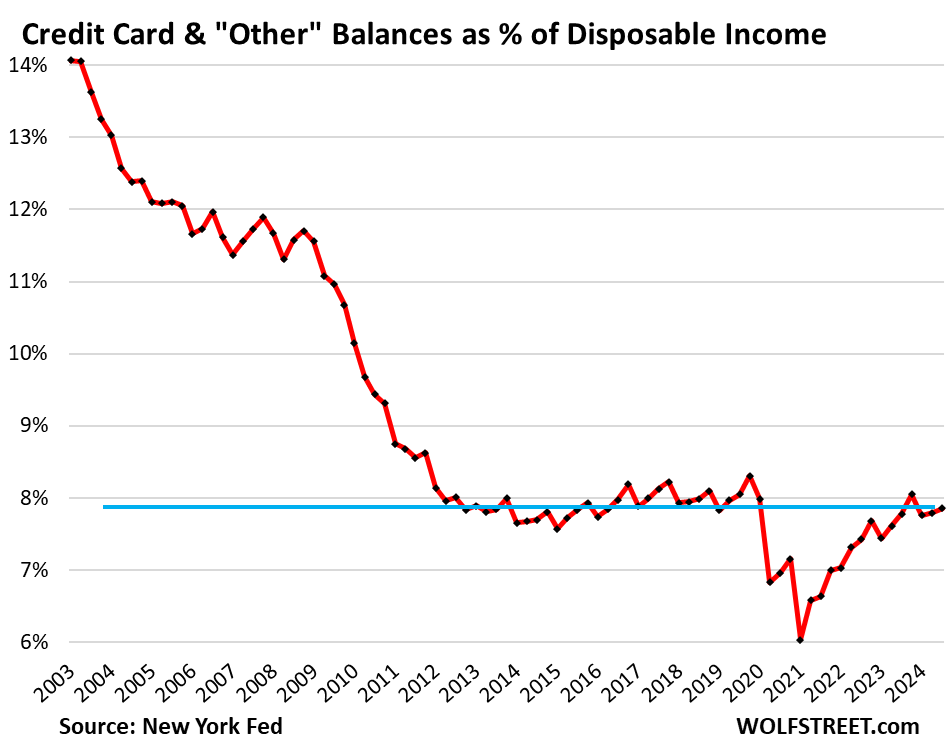
Over the past 20 years, disposable income surged by 142%. But balances of credit cards and “other” consumer loans combined rose only 53% over the same period (to $1.71 trillion in Q3).
As a result, the burden of the combined credit card balances and “other” balances, in terms of the debt-to-disposable-income ratio, has declined over those 20 years, from 14% in 2003 to 7.9%. The ratio has been in roughly the same range for 12 years, with the exception of the pandemic when government handouts grotesquely inflated disposable income.
Disposable income, released by the Bureau of Economic Analysis, is income from all sources except capital gains; so income from after-tax wages, plus from interest, dividends, rentals, farm income, small business income, transfer payments from the government, etc. This is essentially the cash that consumers have available to spend on housing, food, cars, debt payments, etc. And what they don’t spend, they save.
Banks are eager to expand credit.
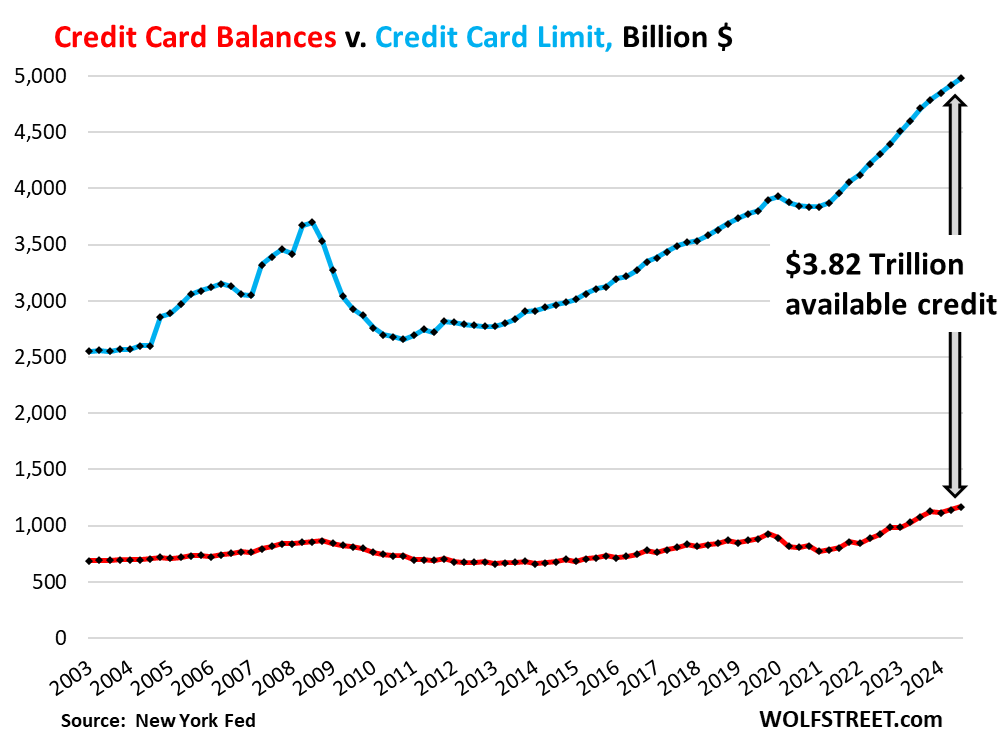
The aggregate credit limit rose by $269 billion year-over-year, to $4.98 trillion, as more card accounts were opened with banks trying as aggressively as ever to get people to set up new accounts, and as credit limits were raised on existing cards.
Over the same period, credit card statement balances rose by $87 billion, to $1.17 trillion (red line)
So the available unused credit surged by $182 billion year-over-year, to a record $3.82 trillion:
In case you missed the rest of our series on consumer credit over the past two days:
Enjoy reading WOLF STREET and want to support it? You can donate. I appreciate it immensely. Click on the beer and iced-tea mug to find out how:
Would you like to be notified via email when WOLF STREET publishes a new article? Sign up here.
![]()
The post Credit Card Delinquency Rates, Balances, Burden, and Available Credit in Q3 2024 appeared first on Energy News Beat.
“}]]

