
 [[{“value”:”
Worst food inflation since 2022. Worst housing inflation in months. But plunging prices for lodging, rental cars, and airfares are interesting.
By Wolf Richter for WOLF STREET.
In the Consumer Price Index today, month-to-month inflation accelerated further for housing, food, medical care services, and motor vehicle maintenance and repair, showing the worst increases in many months, and in the case of food, in years.
But these price increases were overpowered by plunging gasoline prices, and by plunging prices in the travel sector – month-to-month not annualized: lodging away from home (-3.5%), airline fares (-5.3%), and rental cars (-2.7%). These are huge month-to-month drops, annualized between -28% and -48%.
In addition, prices dropped month-to-month not annualized for motor vehicle insurance (-0.8%), used vehicles (-0.7%), and sporting goods (-0.6%). All seasonally adjusted.
As a result, overall CPI turned negative month-to-month, while core CPI and core services CPI decelerated sharply. Durable goods inflation accelerated a tiny bit month-to-month, and has been positive for the third months in a row, but year-over-year remained negative.
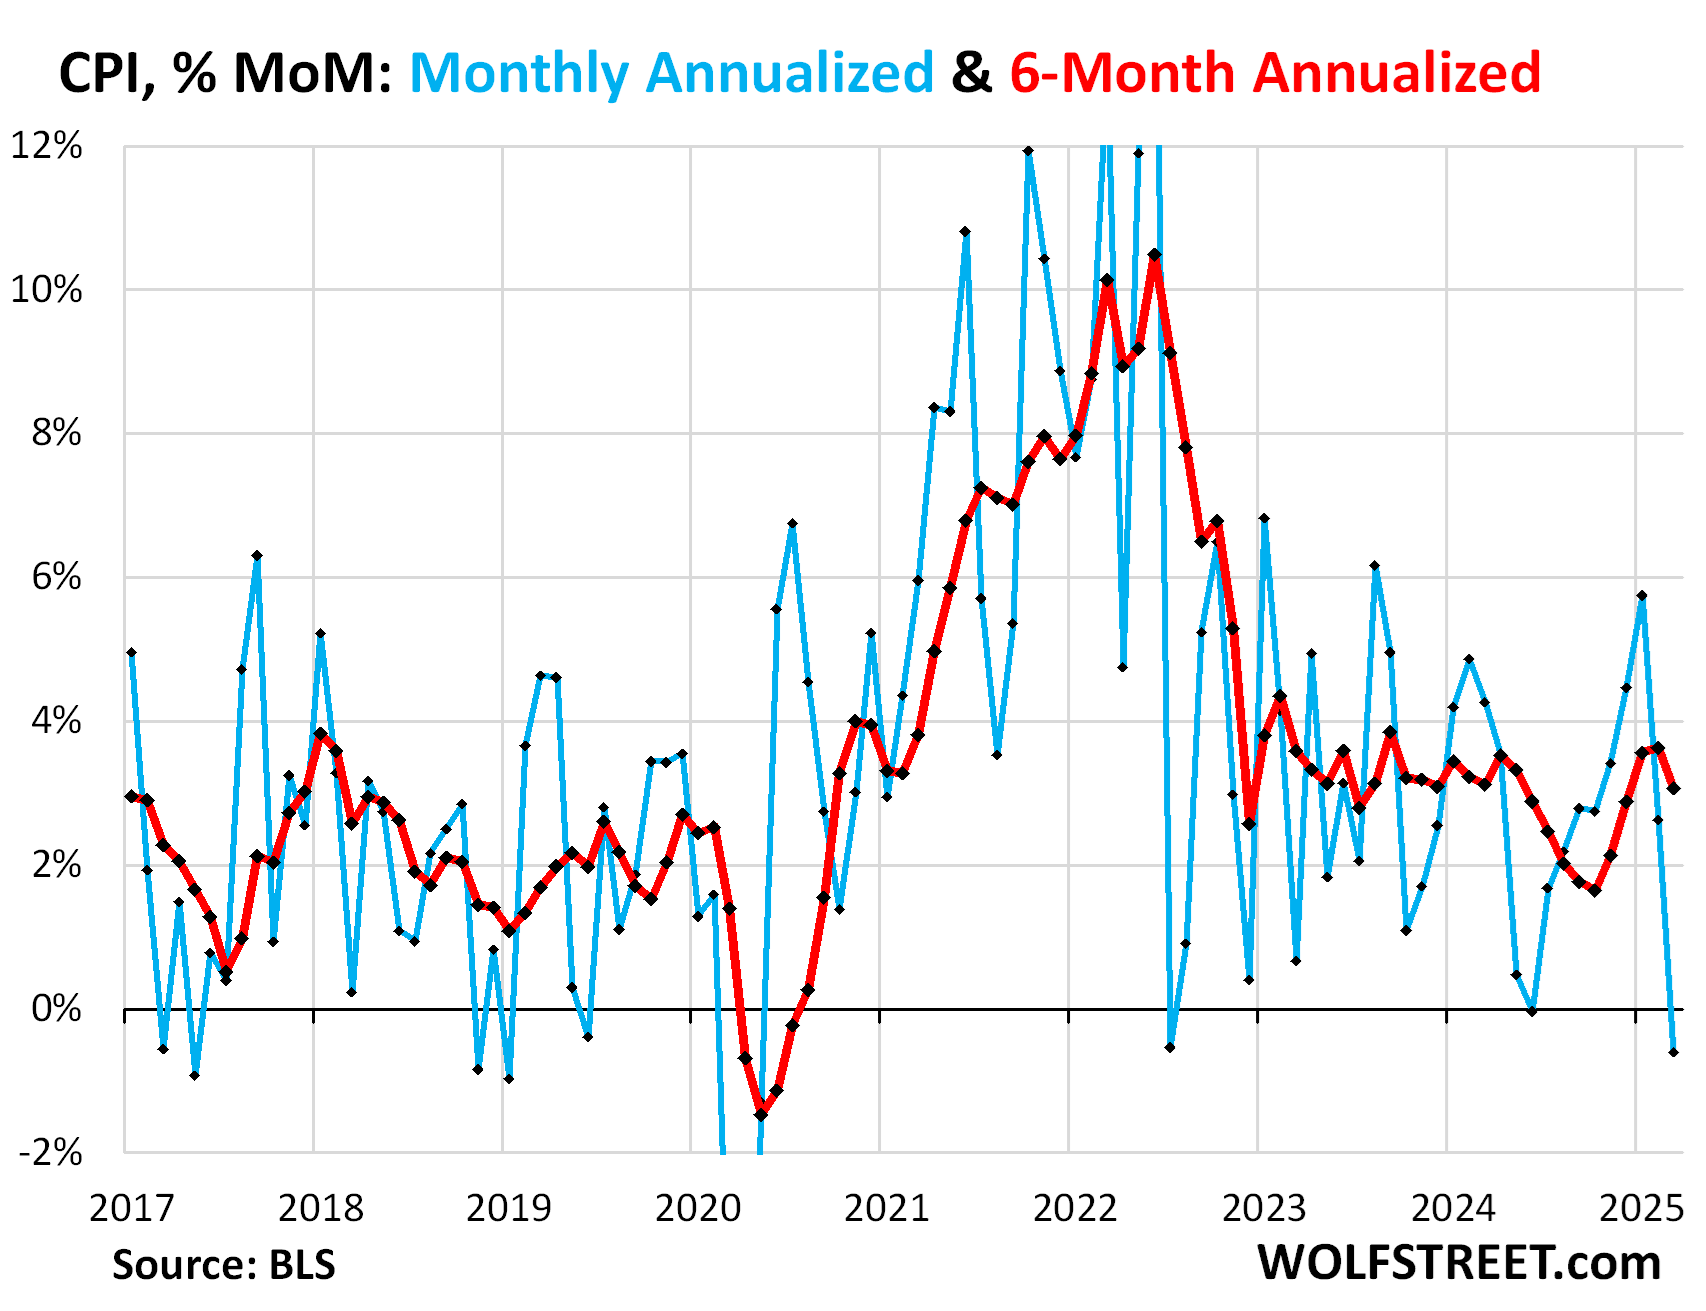
The overall Consumer Price Index fell by 0.05% (-0.6% annualized) in March from February (blue in the chart below).
This drop caused the 6-month CPI to decelerate for the first time in months to +3.1% annualized (red in the chart):
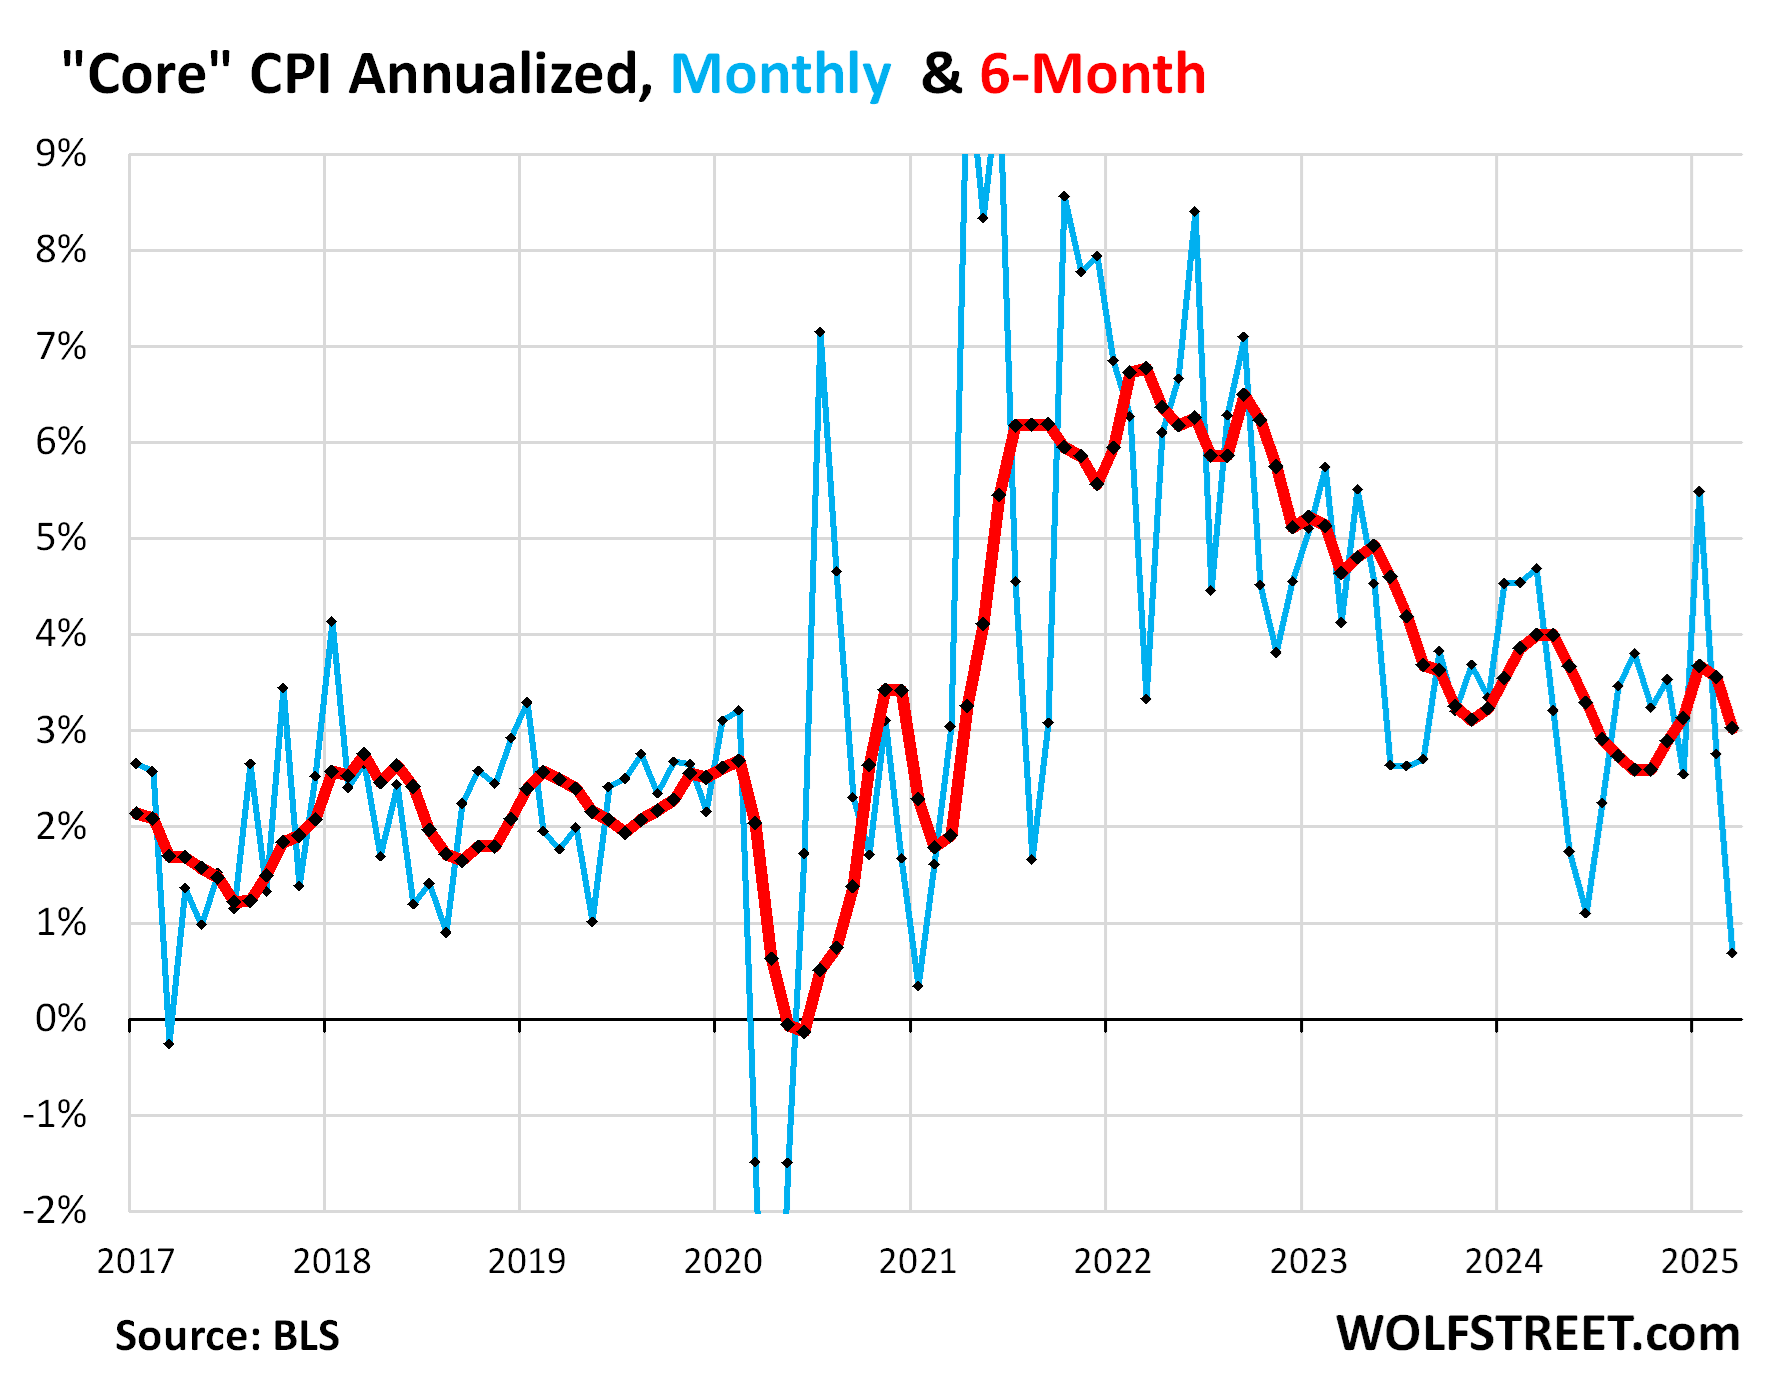
The “Core” CPI, which excludes food and energy components to track underlying inflation, inched up by 0.06% (+0.68% annualized) in March from February, a sharp deceleration (blue in the chart below).
The 6-month “core” CPI rose by 3.0% annualized, the second deceleration in a row (red).
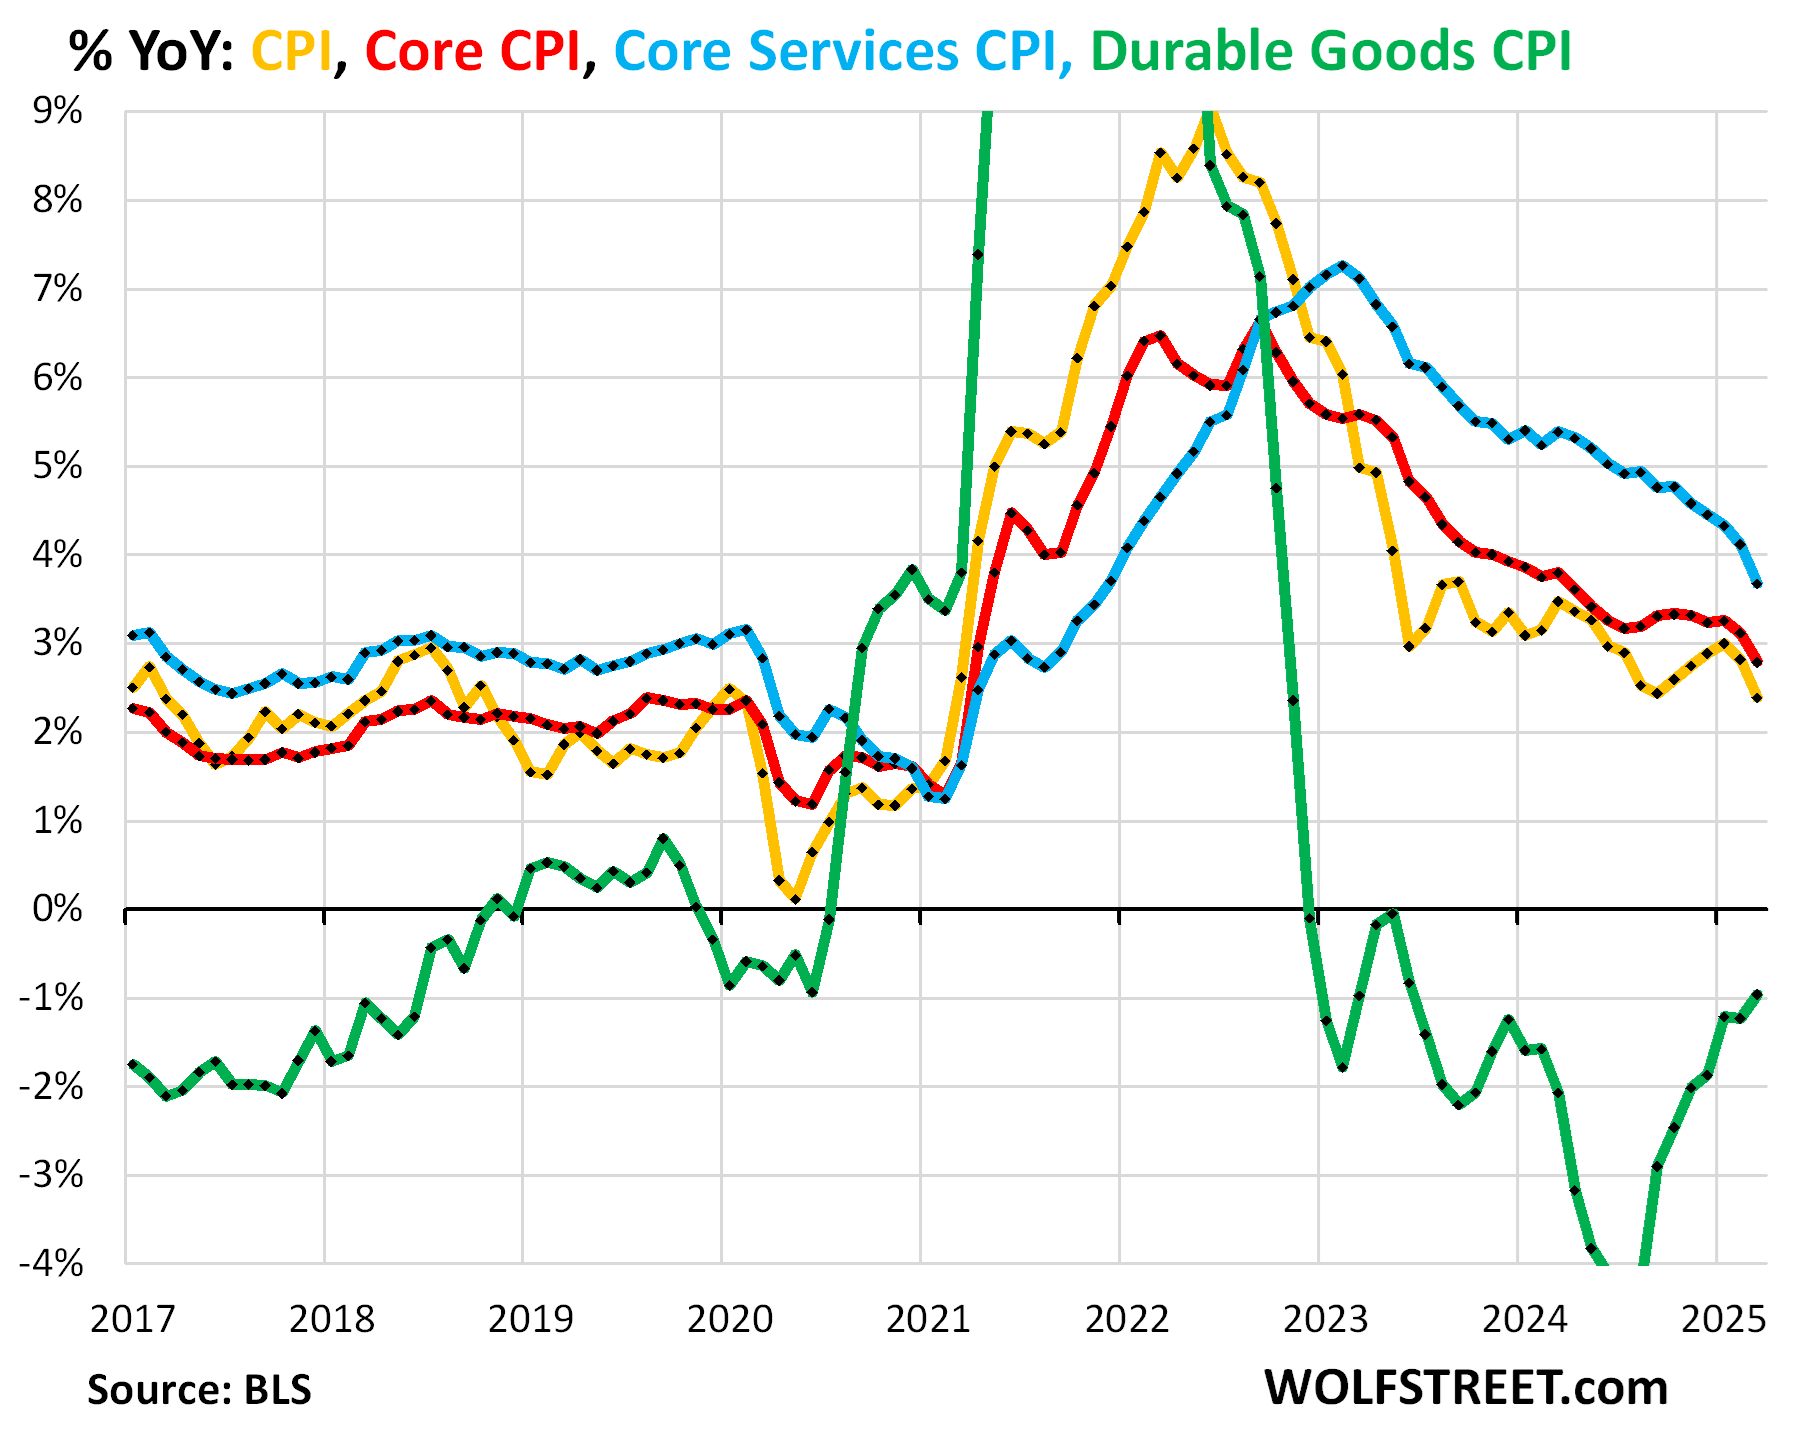
The major components, year-over-year:
- Overall CPI: +239% (yellow), deceleration from +2.82% in February.
- Core CPI +2.79% (red), deceleration from +3.12% in February.
- Core Services CPI: +3.68% (blue), a sharp deceleration from +4.12% in February, largely driven by the plunge in travel-related services, and by the drop in motor vehicle insurance, overpowering the acceleration of housing costs and medical care insurance.
- Durable goods CPI: -1.0% (green), the smallest year-over-year decline since June 2023.
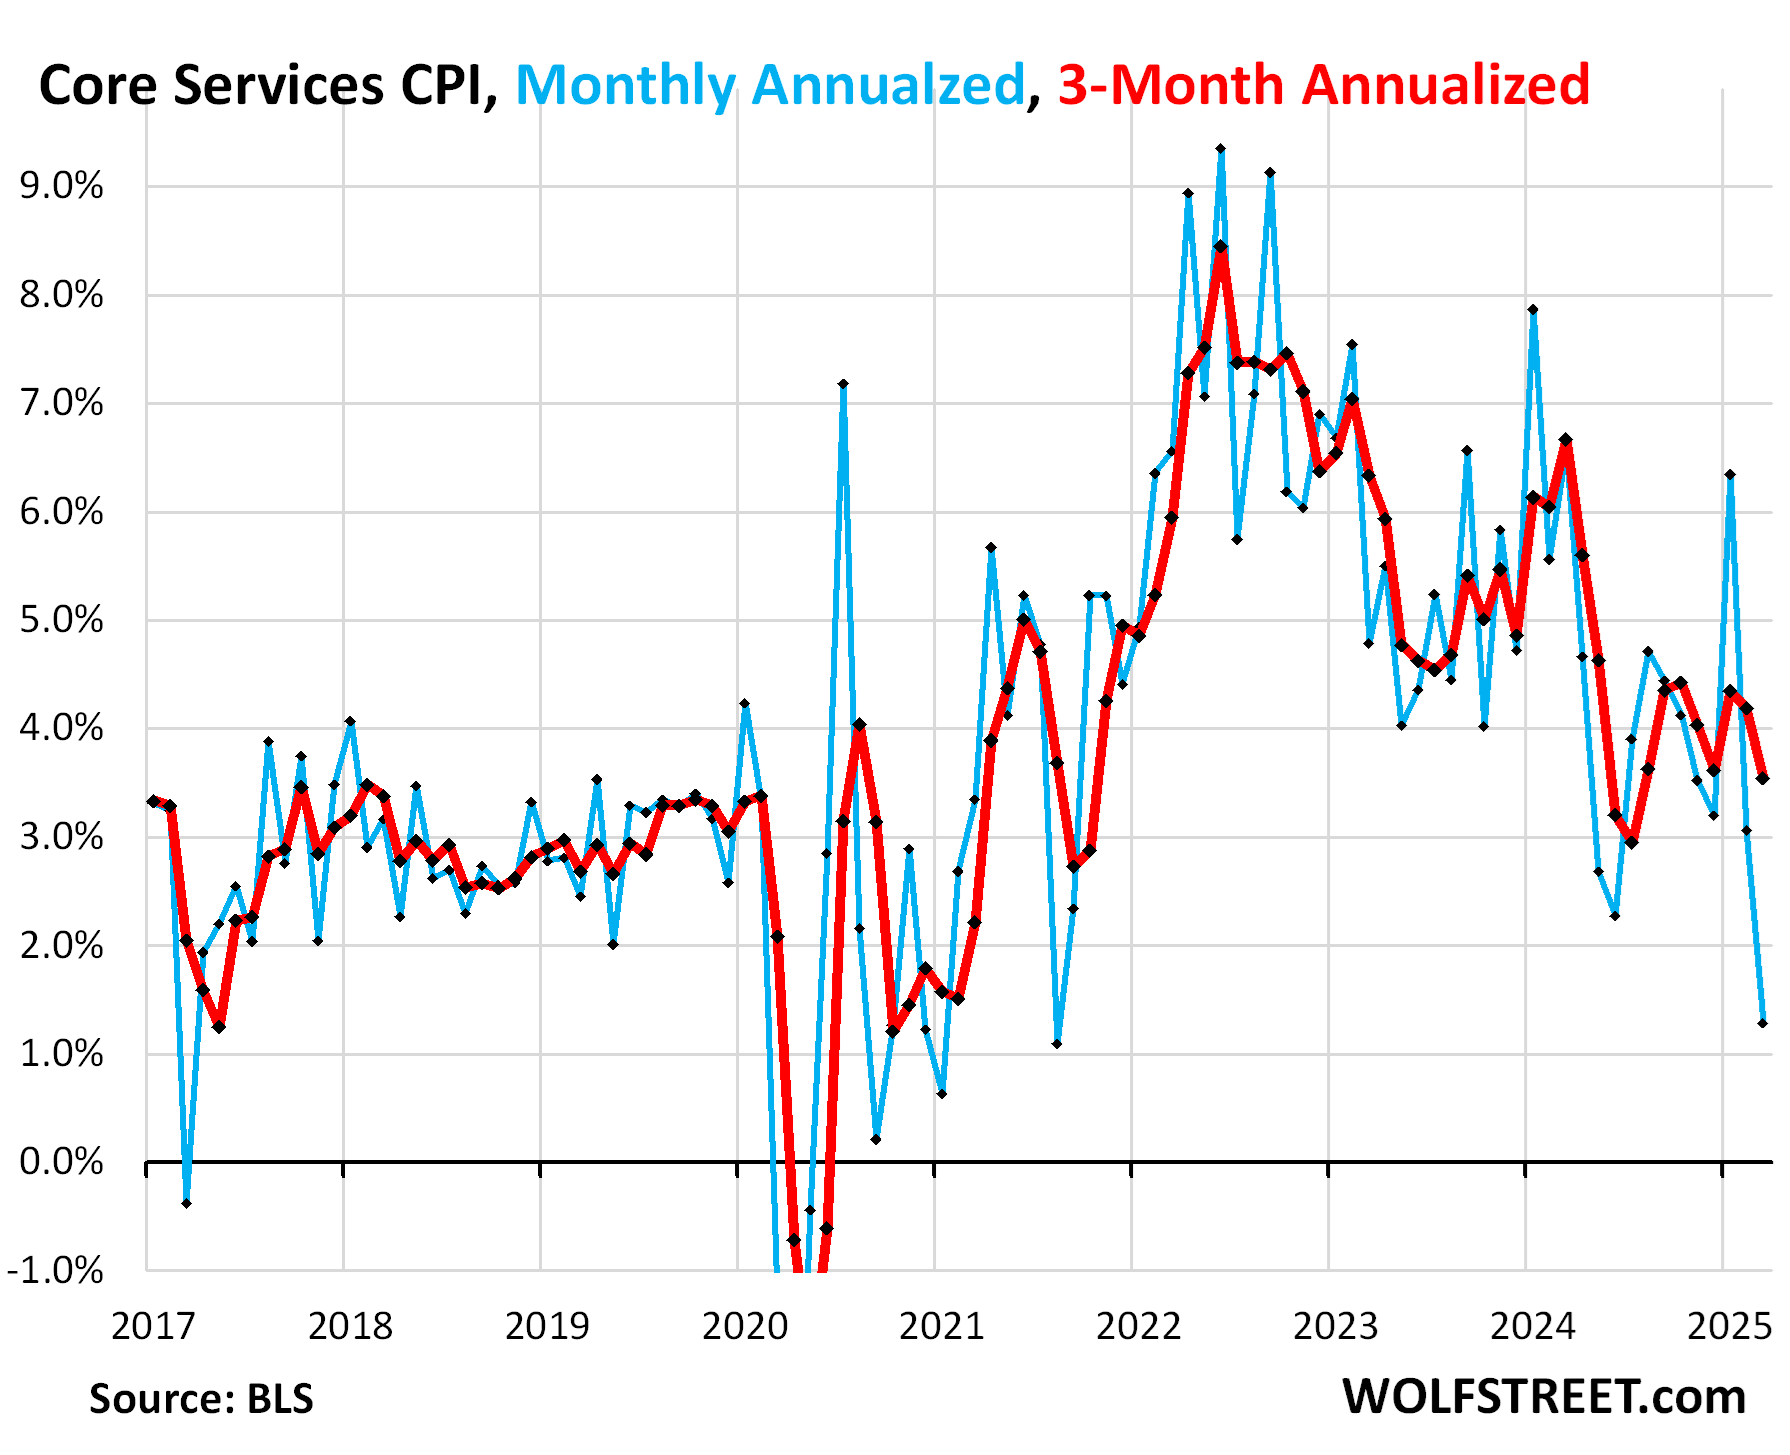
“Core services” CPI.
Core services CPI inched up by 0.11% in March from February (+1.3% annualized, a sharp deceleration from prior months.
Core services include all services except energy services and accounts for about two-thirds of the overall CPI.
Inflation in the biggies in core services continued to accelerate on a month-to-month basis, including the housing components and medical care services.
But the massive plunge in prices of travel-related services and the drop in auto insurance pushed the core services CPI down.
The 6-month core services CPI rose by 3.5% annualized, a sharp deceleration from February (red).
Housing components of core services.
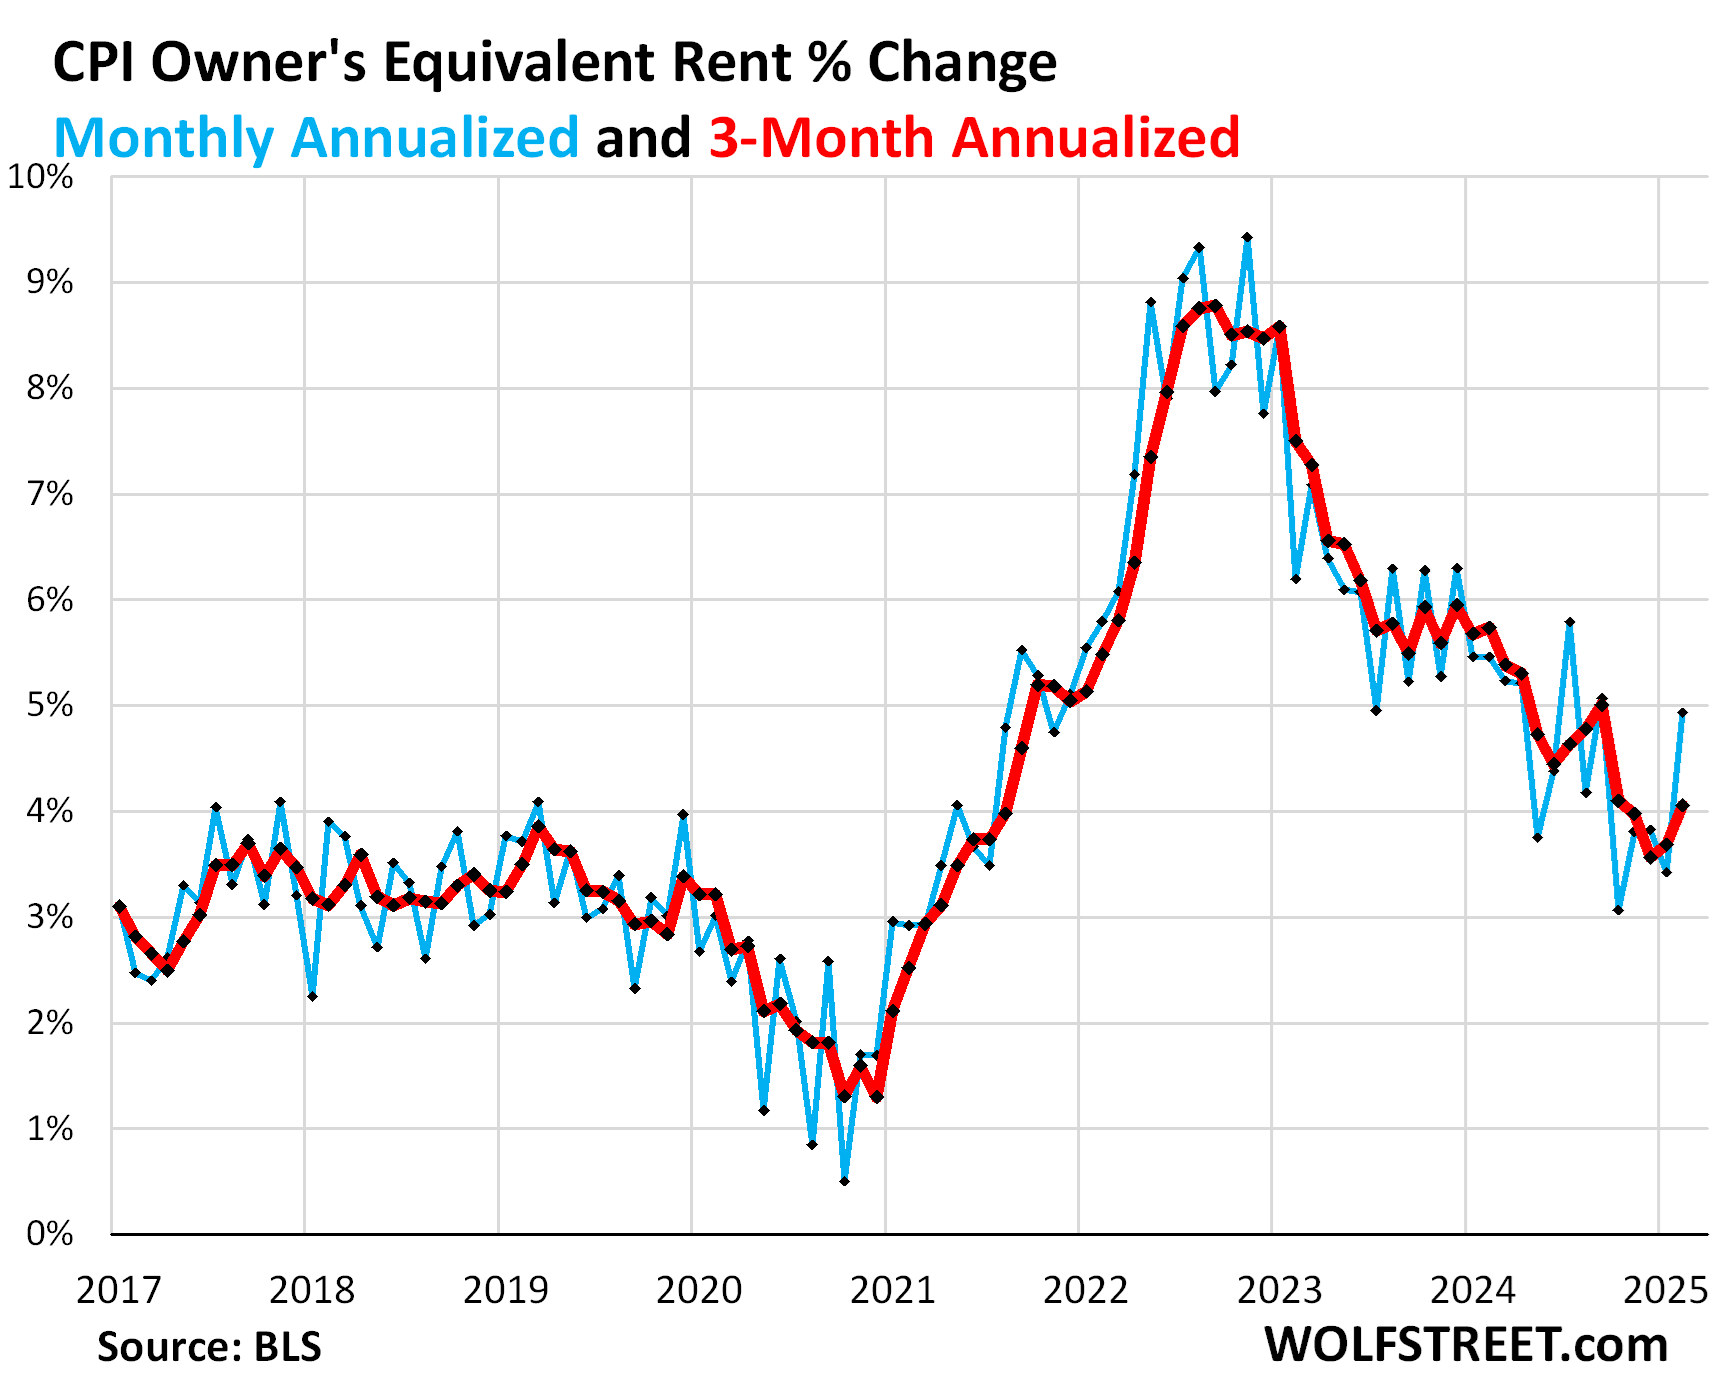
Owners’ Equivalent of Rent CPI jumped by 4.9% annualized (+0.40% not annualized) in March from February, the worst increase since October.
The three-month average, which shows the recent trend, accelerated to +4.1% annualized, the worst increase since November.
OER indirectly reflects the expenses of homeownership: homeowners’ insurance, HOA fees, property taxes, and maintenance. It’s the only measure for those expenses in the CPI. It is based on what a large group of homeowners estimates their home would rent for, with the assumption that a homeowner would want to recoup their cost increases by raising the rent.
As a stand-in for homeowners’ insurance, HOA fees, property taxes, and maintenance costs, OER accounts for 26.1% of overall CPI and estimates inflation of shelter as a service for homeowners.
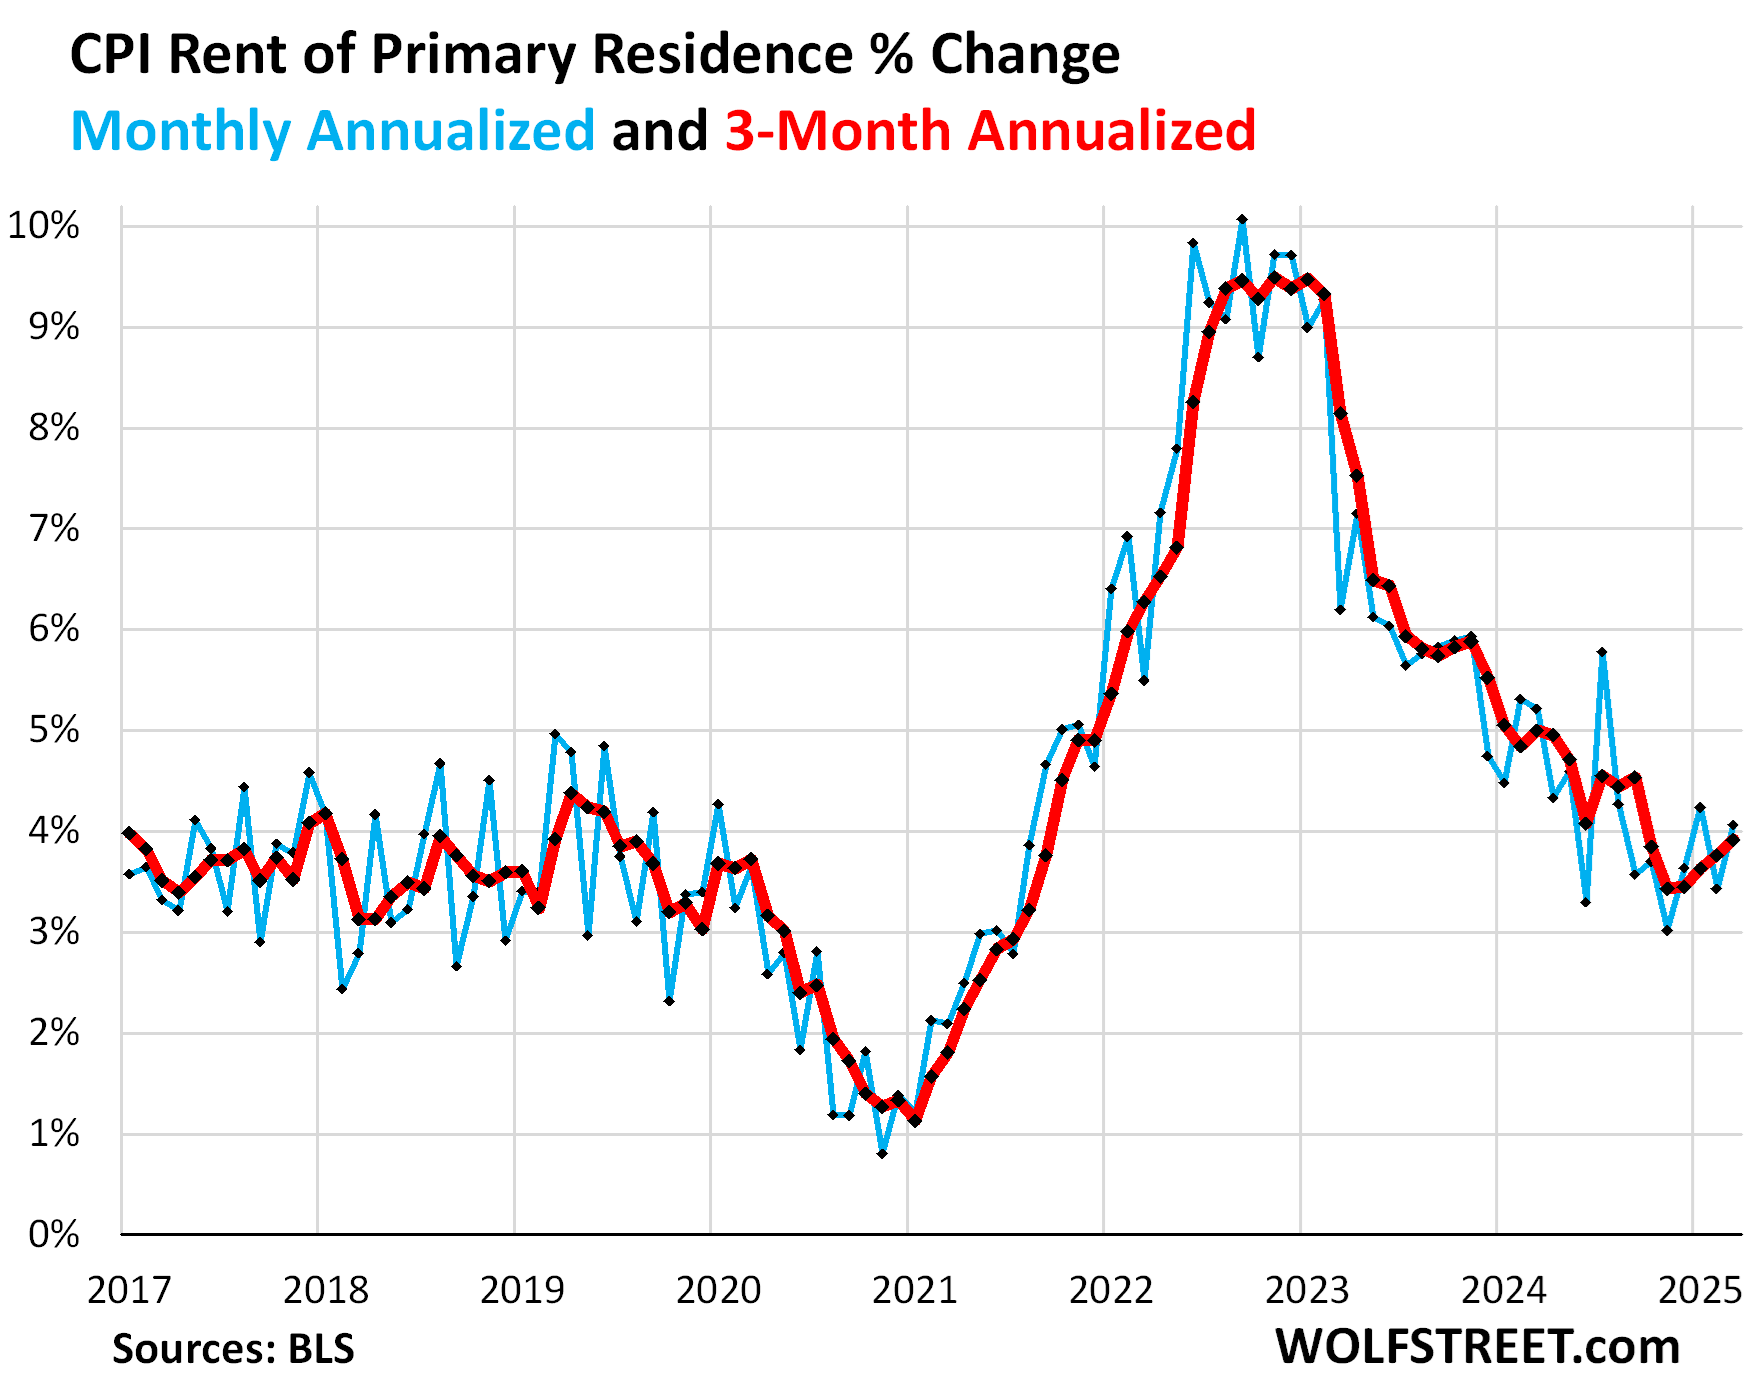
Rent of Primary Residence CPI accelerated to +4.1% annualized in March from February.
The 3-month rate accelerated to +3.9% annualized, the worst increase since September, and the fifth month in a row of acceleration.
Rent CPI accounts for 7.5% of overall CPI. It is based on rents that tenants actually paid, not on asking rents of advertised vacant units for rent. The survey follows the same large group of rental houses and apartments over time and tracks the rents that the current tenants, who come and go, pay in rent for these units.
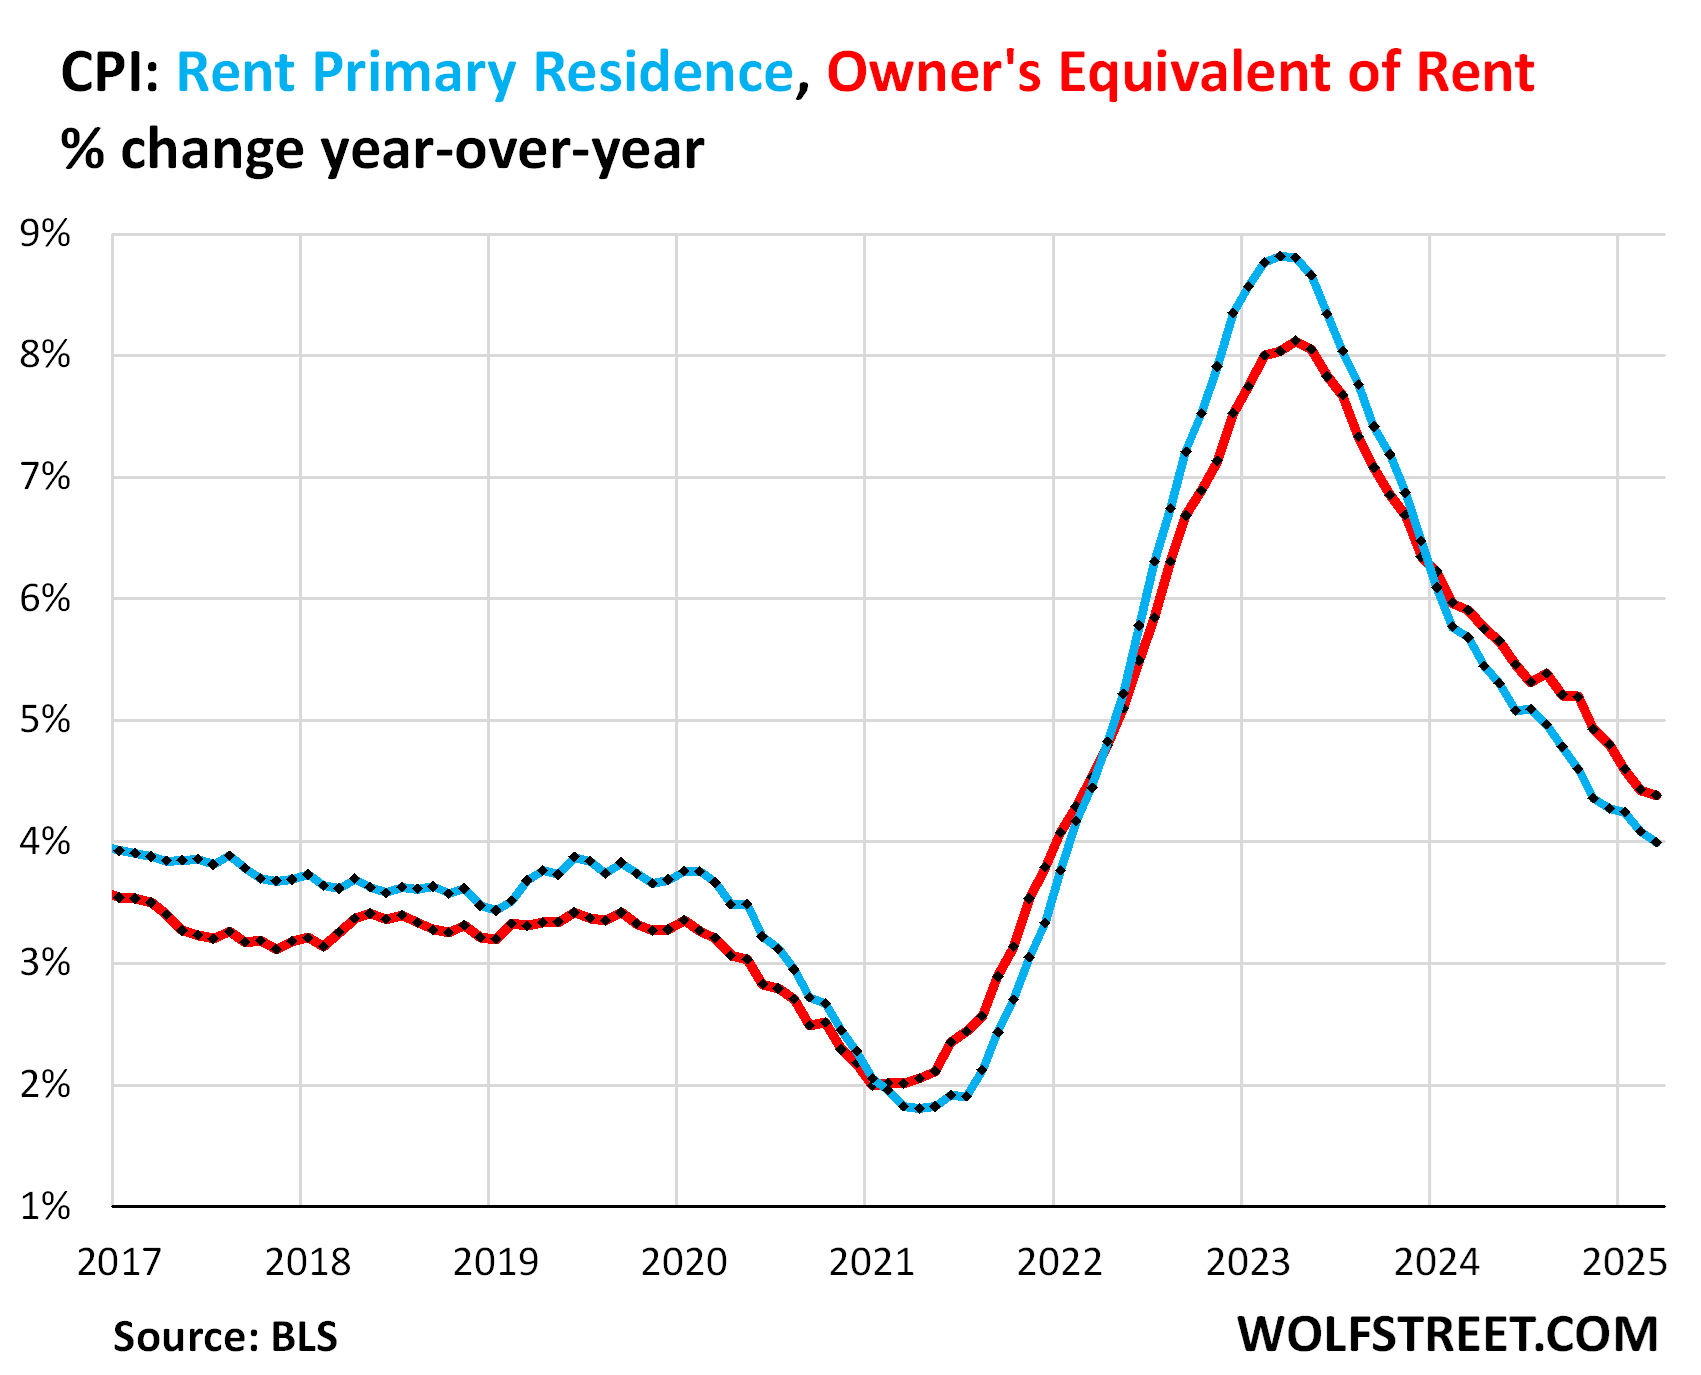
Year-over-year, rent CPI (blue in the chart below) rose by 4.0%, a slight deceleration from the prior month (+4.1%). And OER rose by 4.4%, roughly the same as in the prior month (red). The year-over-year declines are now flattening out.
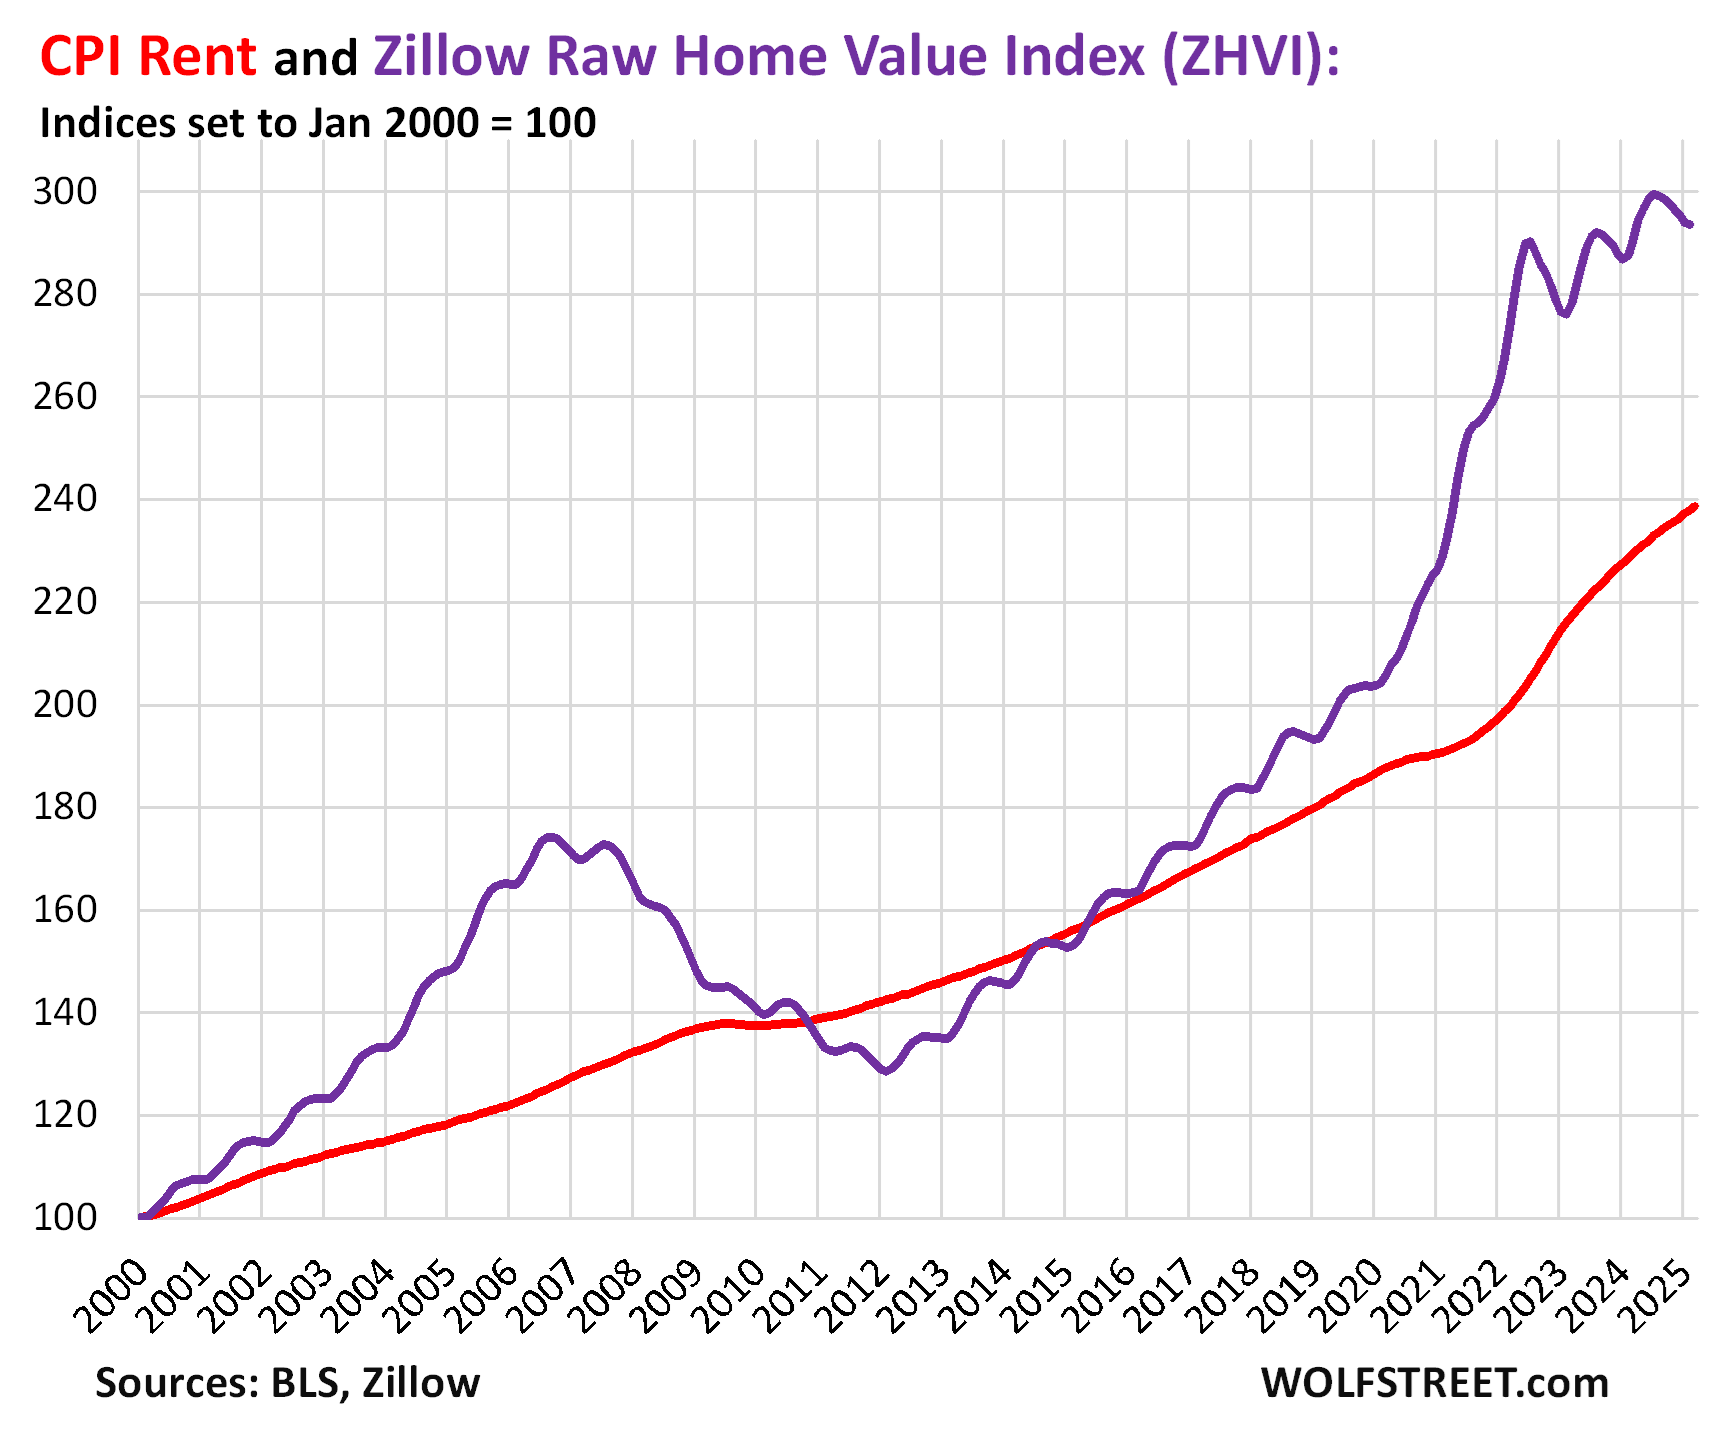
Rent inflation vs. home-price inflation: The red line in the chart below represents the CPI for Rent of Primary Residence as index value. The purple line represents Zillow’s “raw” Home Value Index for the US through February. Both indexes are set to 100 for January 2000. But home-price changes vary by metro and range from steep declines to continued increases, see the 33 Most Splendid Housing Bubbles in America.
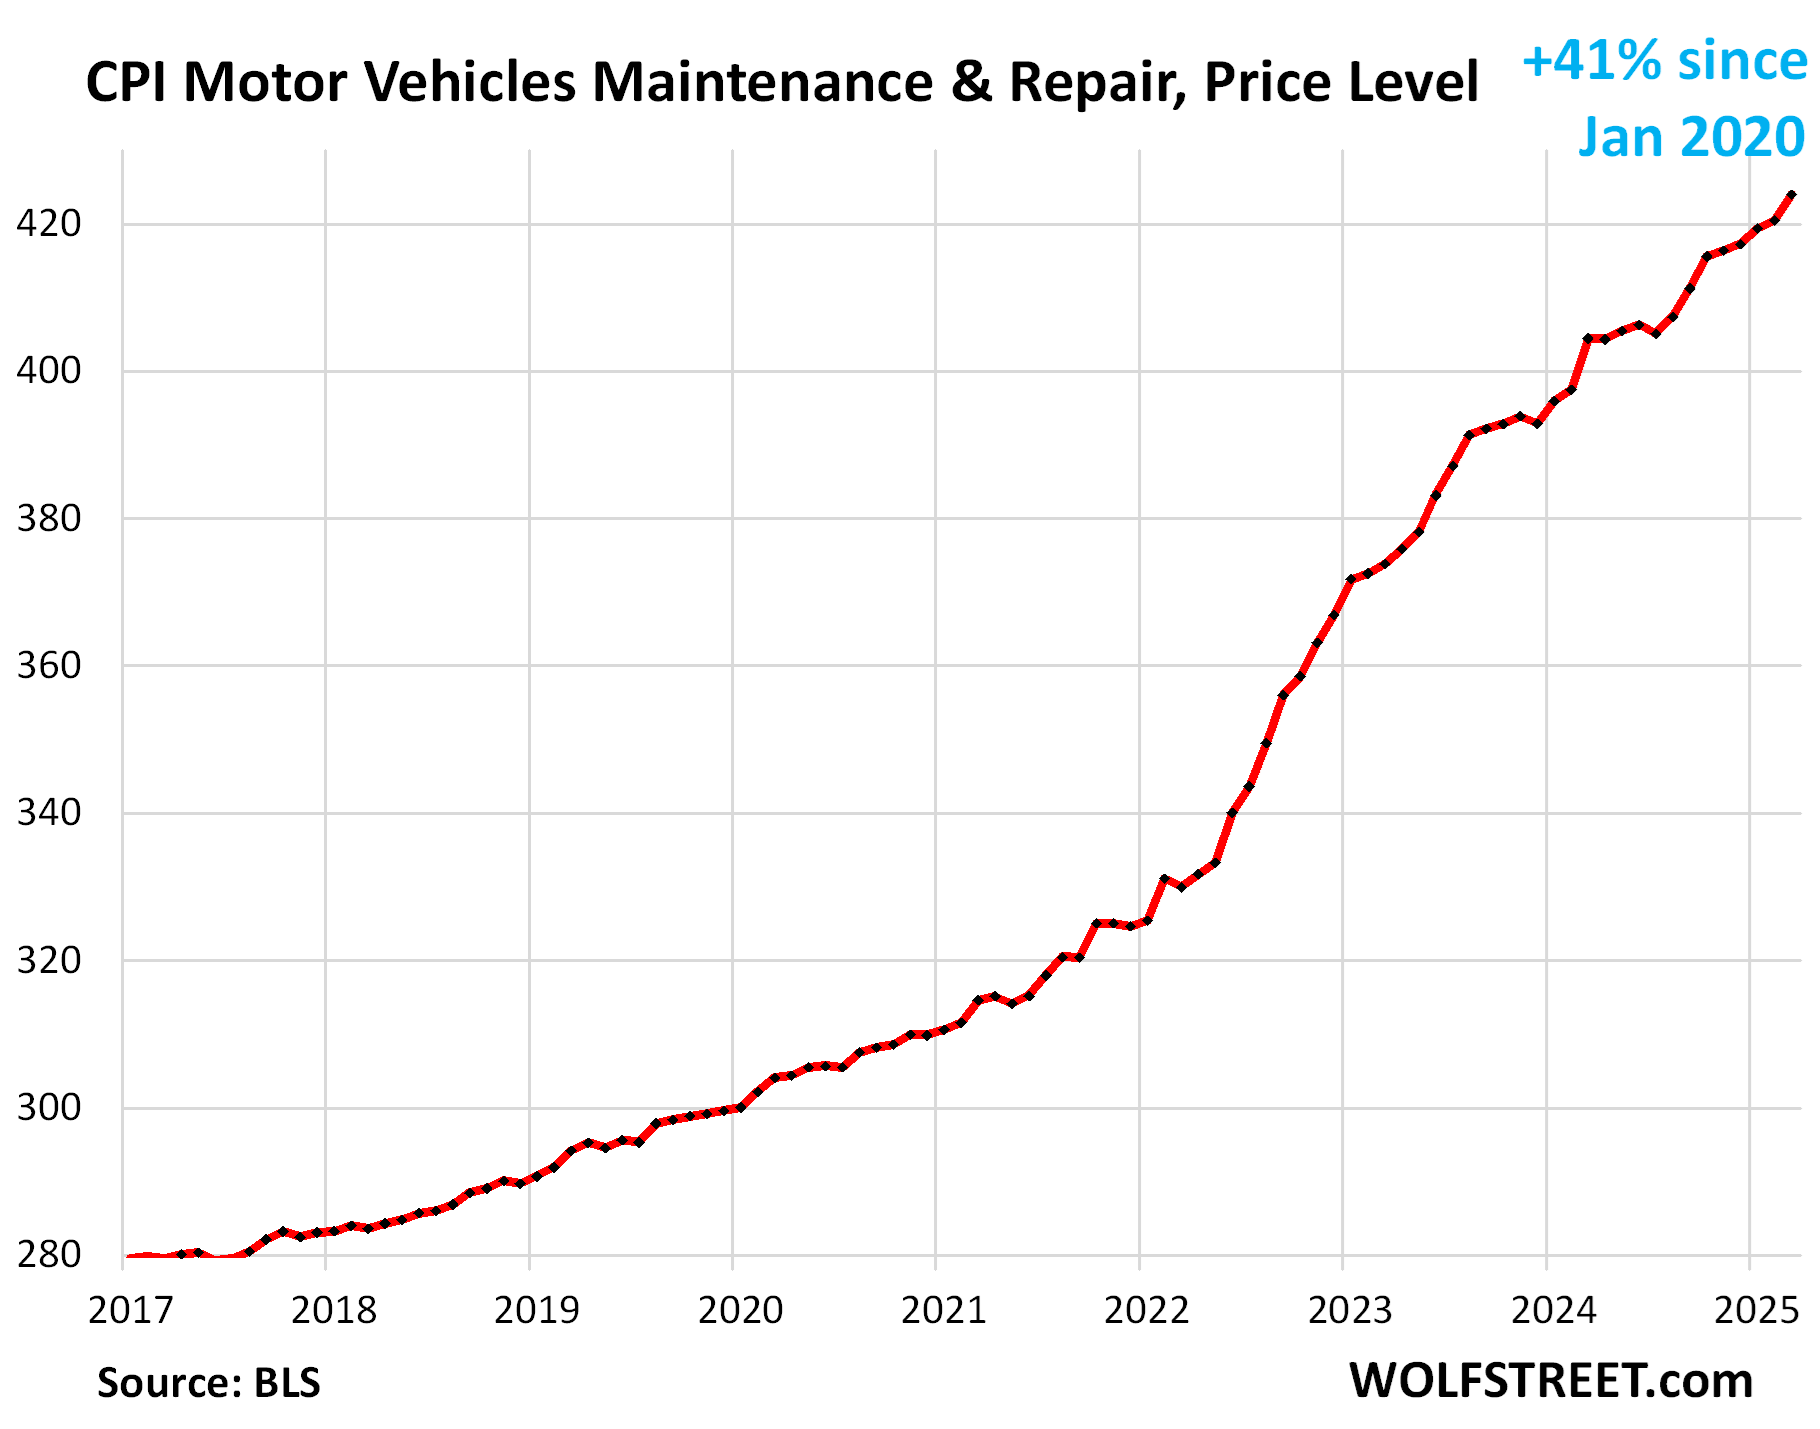
The CPI for motor-vehicle maintenance & repair jumped by 10.6% annualized in March from February, the worst month-to-month increase since October. Year-over-year, the index rose by 4.8%.
Since January 2020, the index has surged by 41%. This chart shows the price level, not the year-over-year percentage change:
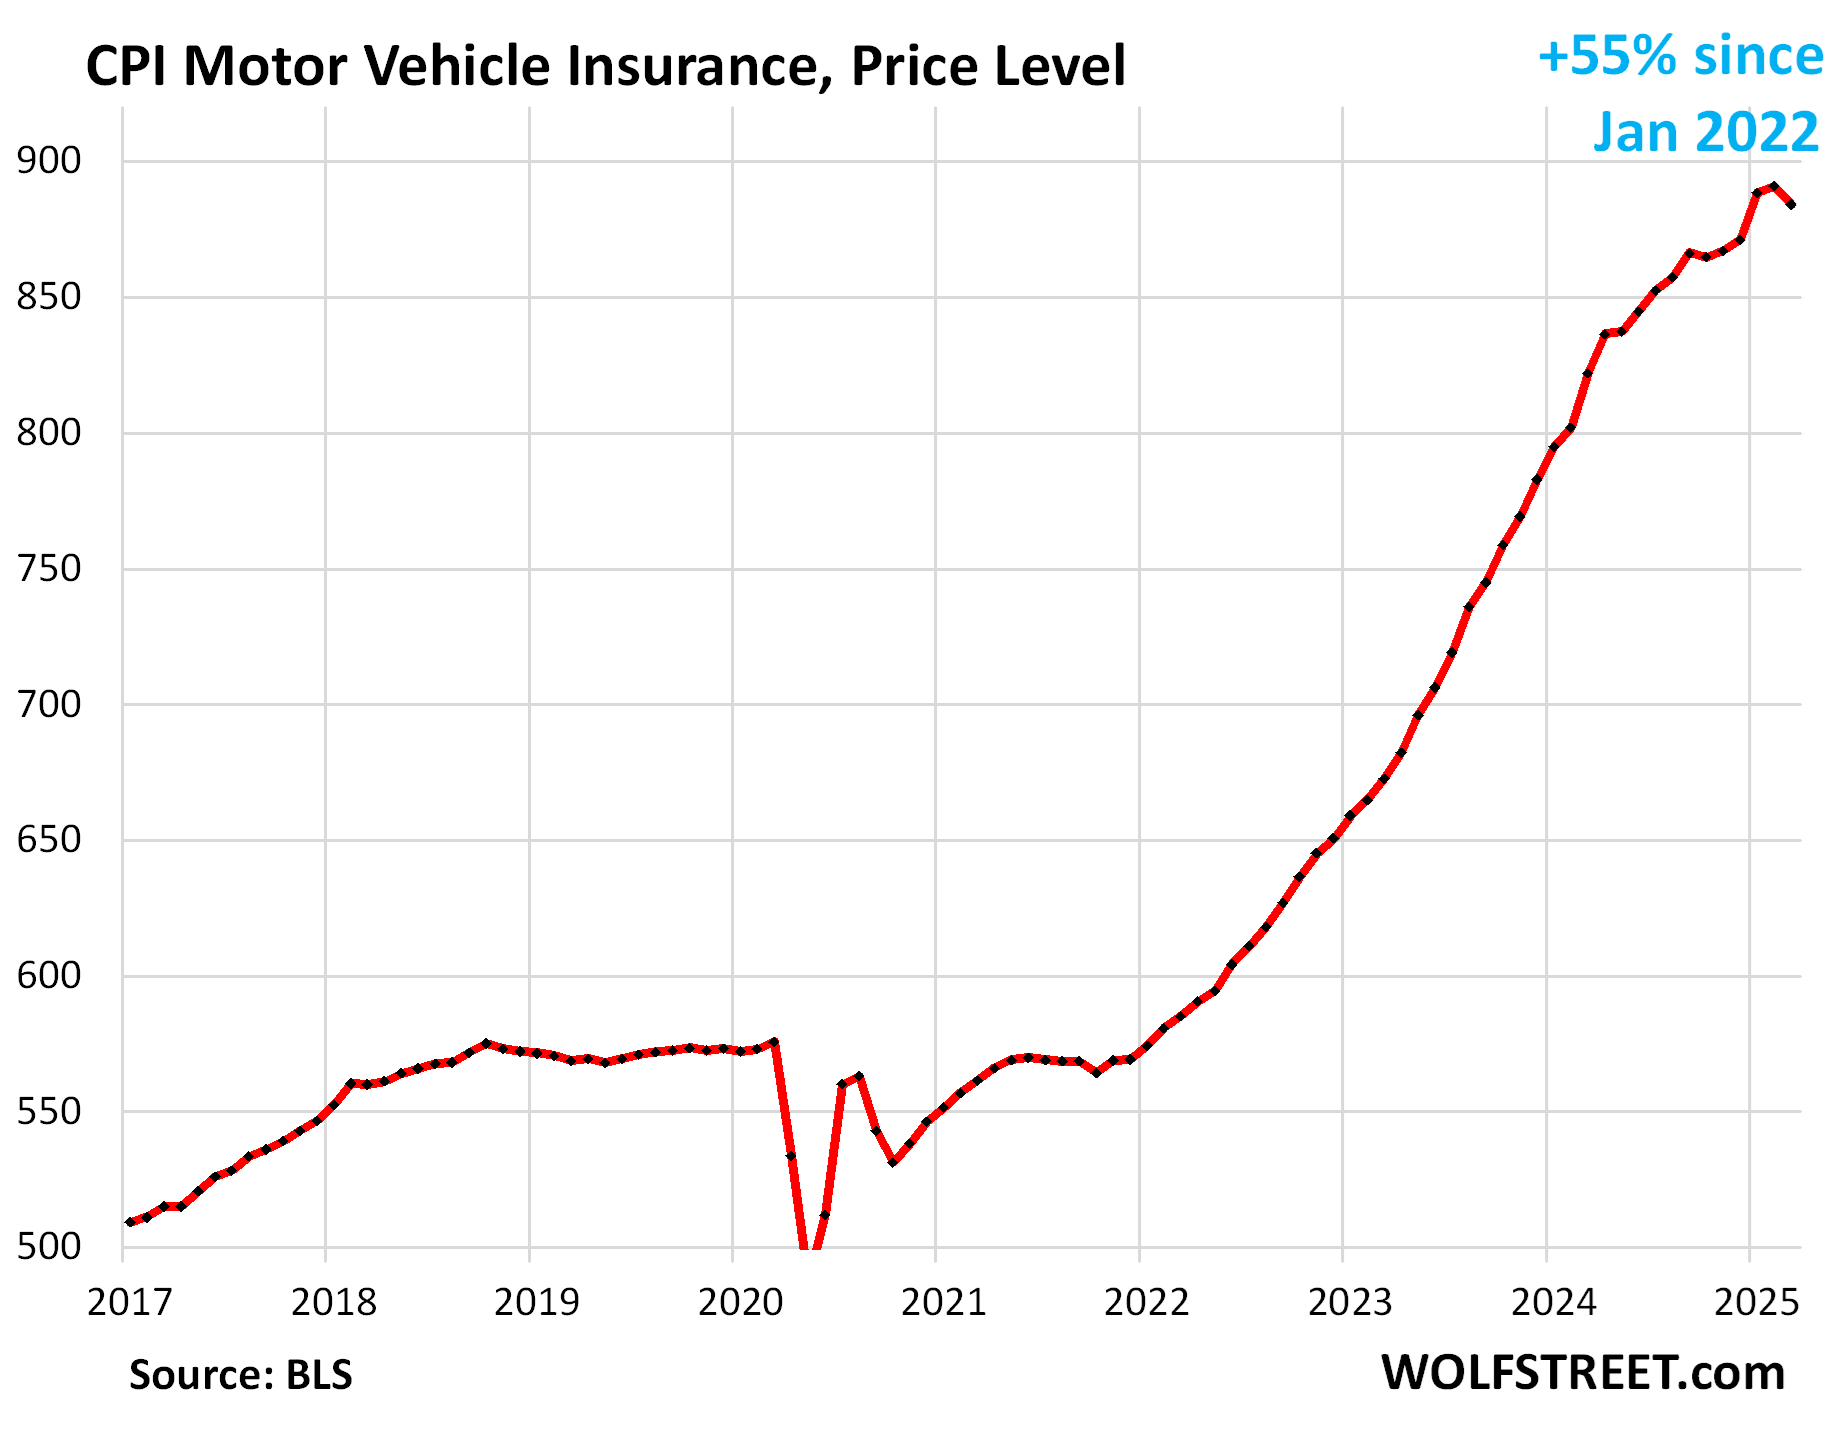
The CPI for motor vehicle insurance fell by 8.7% annualized in March from February. This drop cooled the year-over-year increase to +7.5%, the smallest increase since July 2022.
Since January 2022, motor vehicle insurance prices have exploded by 55%, fueled by the surge repair costs and the historic spike in used vehicle prices (replacement costs for insurers) in 2021 and 2022.
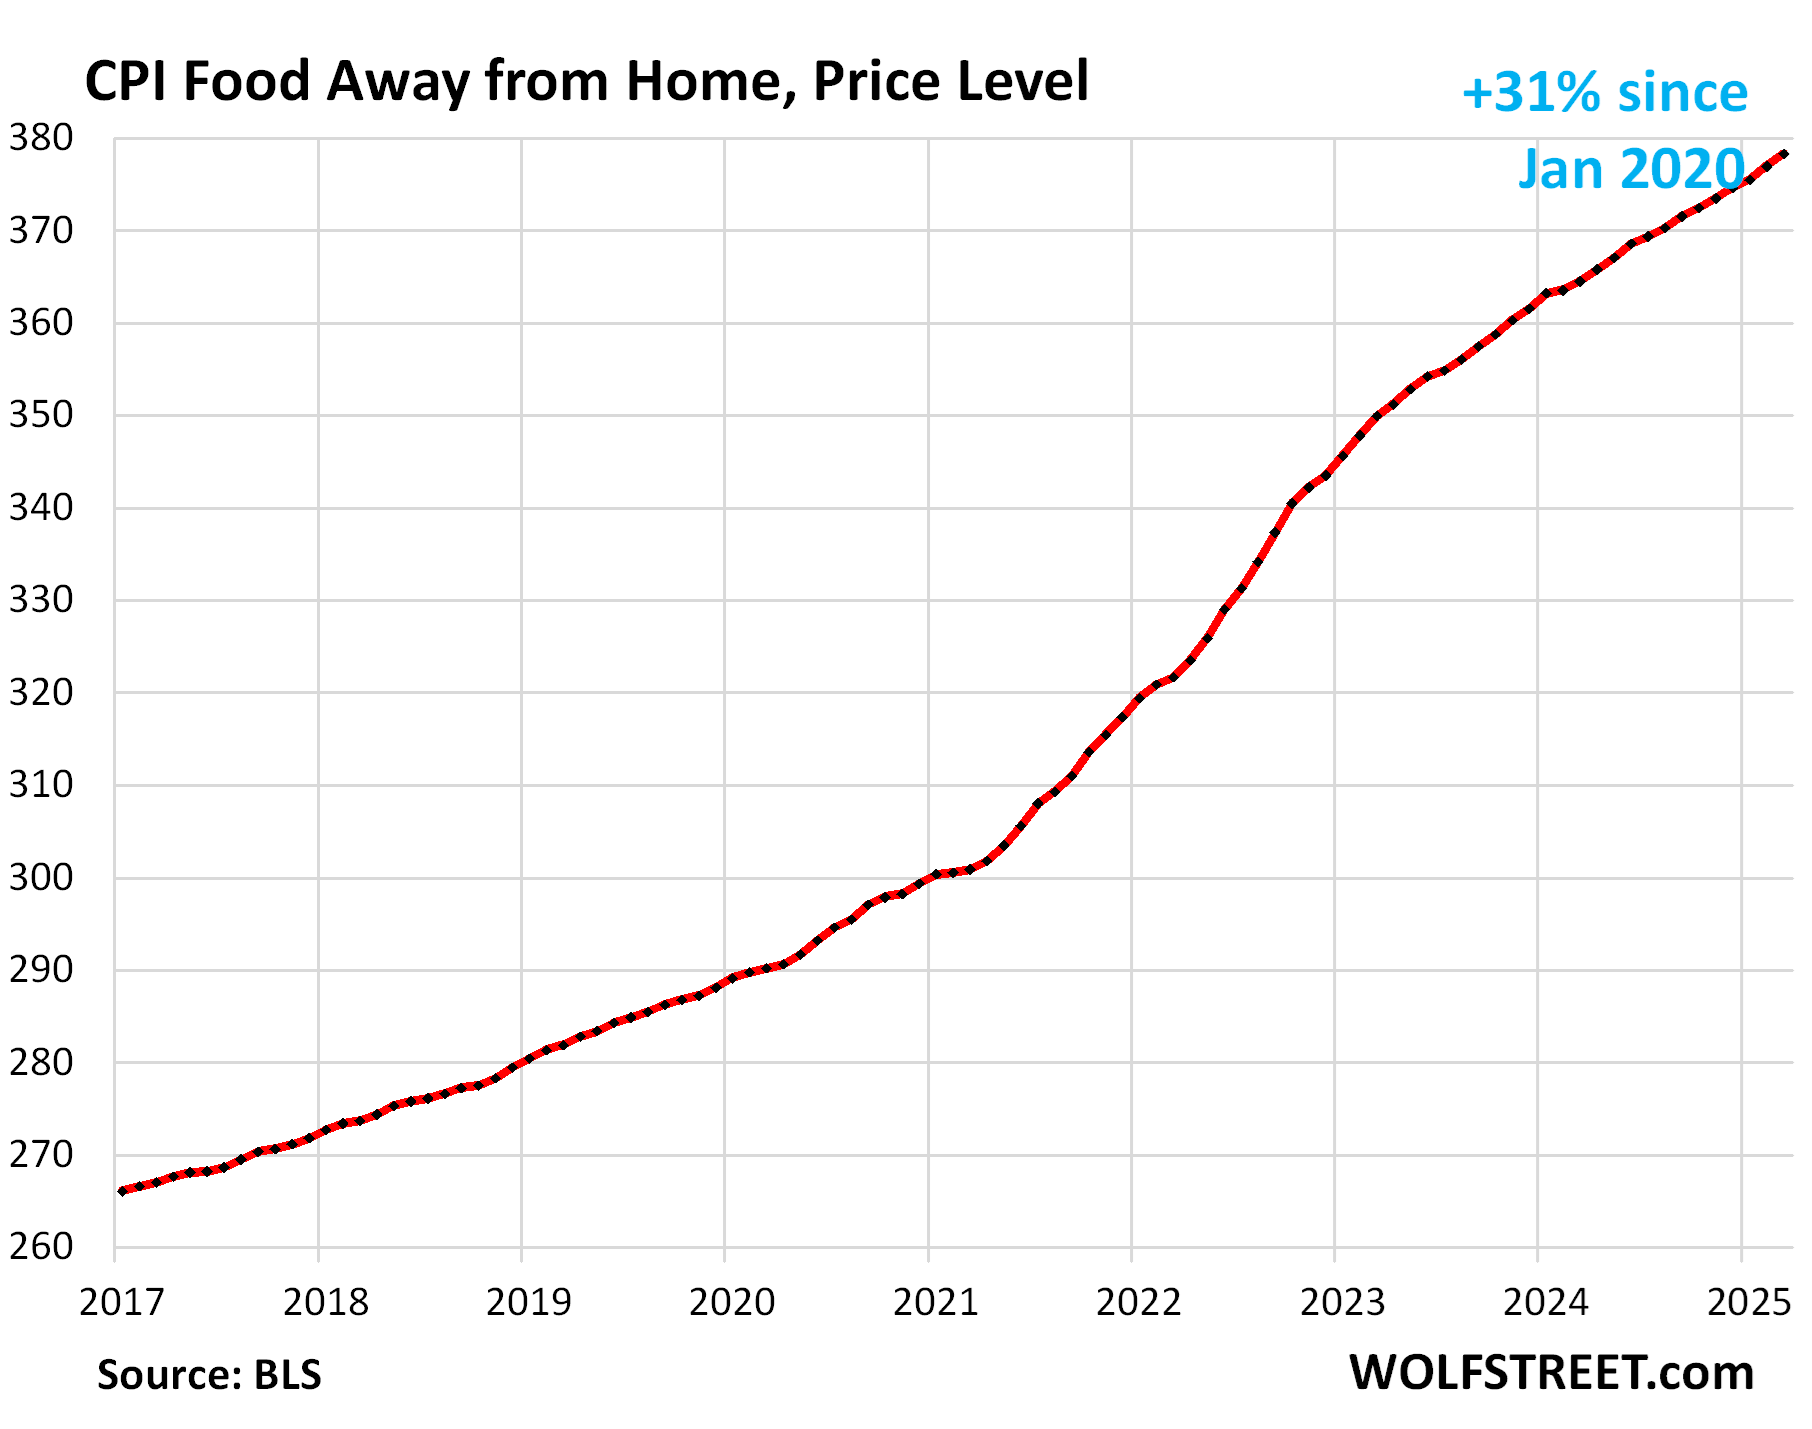
Food away from Home CPI rose by 4.5% annualized in March from February. Year over year, the index accelerated to +3.8%, worst increase since October.
These food services include full-service and limited-service meals and snacks served away from home in restaurants, cafeterias, at stalls, etc.
The table below shows the major categories of “core services.” Combined, they accounted for 64% of total CPI:
| Major Services ex. Energy Services | Weight in CPI | MoM | YoY |
| Core Services | 64% | 0.3% | 4.8% |
| Owner’s equivalent of rent | 26.2% | 0.4% | 4.4% |
| Rent of primary residence | 7.5% | 0.3% | 4.0% |
| Medical care services & insurance | 6.7% | 0.5% | 3.0% |
| Food services (food away from home) | 5.6% | 0.4% | 3.8% |
| Motor vehicle insurance | 2.8% | -0.8% | 7.5% |
| Education (tuition, childcare, school fees) | 2.5% | 0.4% | 3.7% |
| Admission, movies, concerts, sports events, club memberships | 2.1% | 0.5% | 5.6% |
| Other personal services (dry-cleaning, haircuts, legal services…) | 1.6% | 1.6% | 4.7% |
| Public transportation (airline fares, etc.) | 1.5% | -4.2% | -3.5% |
| Telephone & wireless services | 1.5% | -0.1% | 0.1% |
| Lodging away from home, incl Hotels, motels | 1.3% | -3.5% | -2.5% |
| Water, sewer, trash collection services | 1.1% | 0.2% | 4.9% |
| Motor vehicle maintenance & repair | 1.0% | 0.8% | 4.8% |
| Internet services | 0.9% | 0.3% | -1.1% |
| Video and audio services, cable, streaming | 0.8% | -0.7% | 2.0% |
| Pet services, including veterinary | 0.5% | -0.2% | 4.7% |
| Tenants’ & Household insurance | 0.4% | -0.3% | 2.2% |
| Car and truck rental | 0.1% | -2.7% | -8.7% |
| Postage & delivery services | 0.1% | 0.4% | 2.9% |
Prices of Goods.
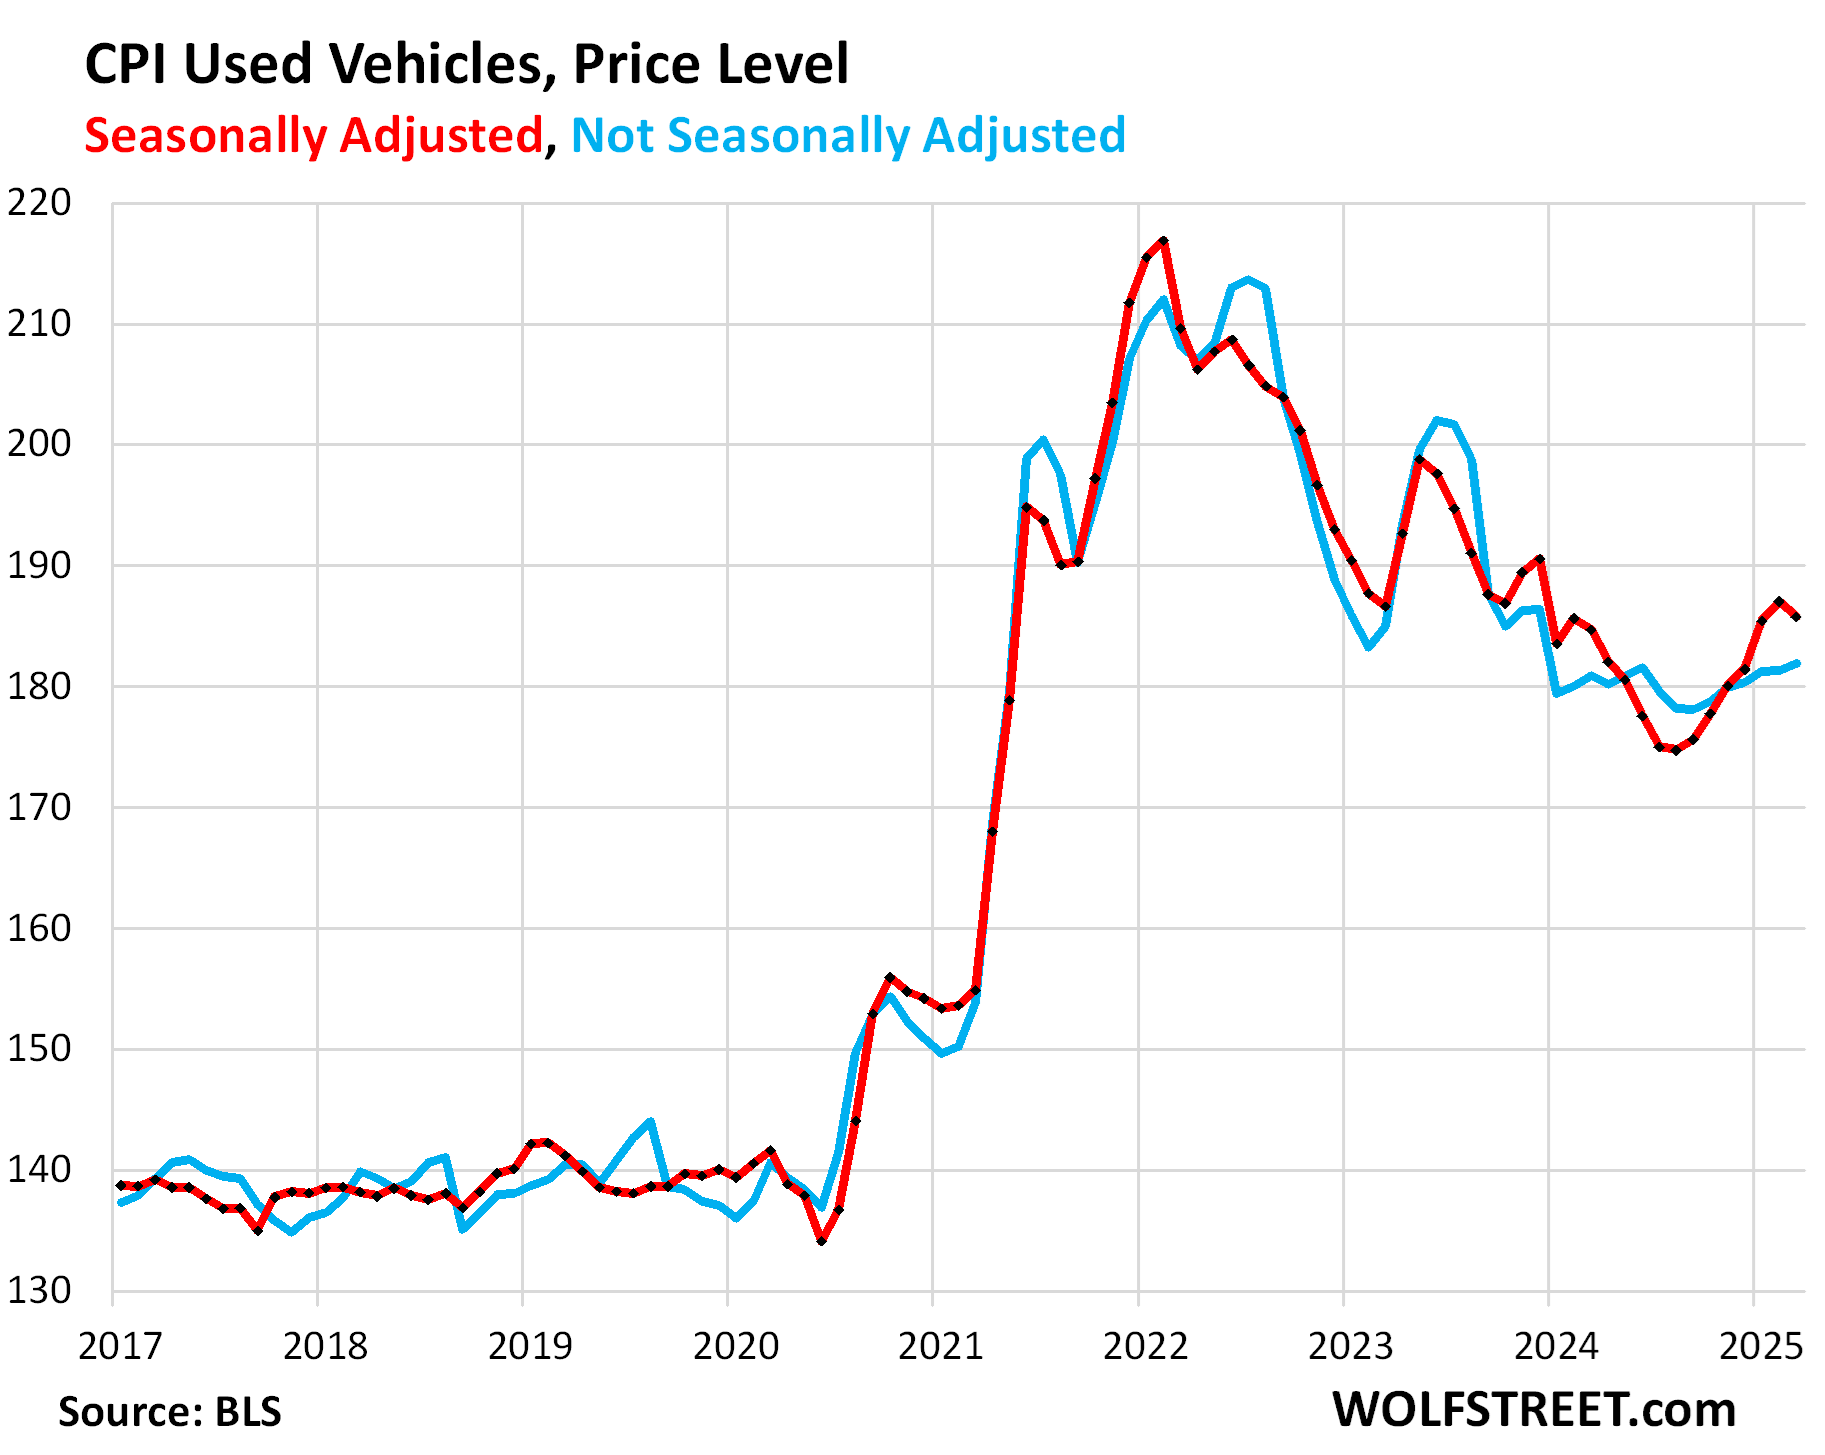
The used vehicle CPI: March was the beginning of tax refund season when used-vehicle prices normally jump. But this March they rose only slightly from February: +0.21% (+3.8% annualized), not seasonally adjusted.
So seasonally adjusted, the index fell by 0.69% (-7.9% annualized) month-to-month.
Year-over-year, used vehicle prices rose by 0.6%, the third month in a row of year-over-year increases. The historic plunge of used vehicle prices from early 2022 through August 2024 was one of the factors in the cooling of CPI inflation over that period.
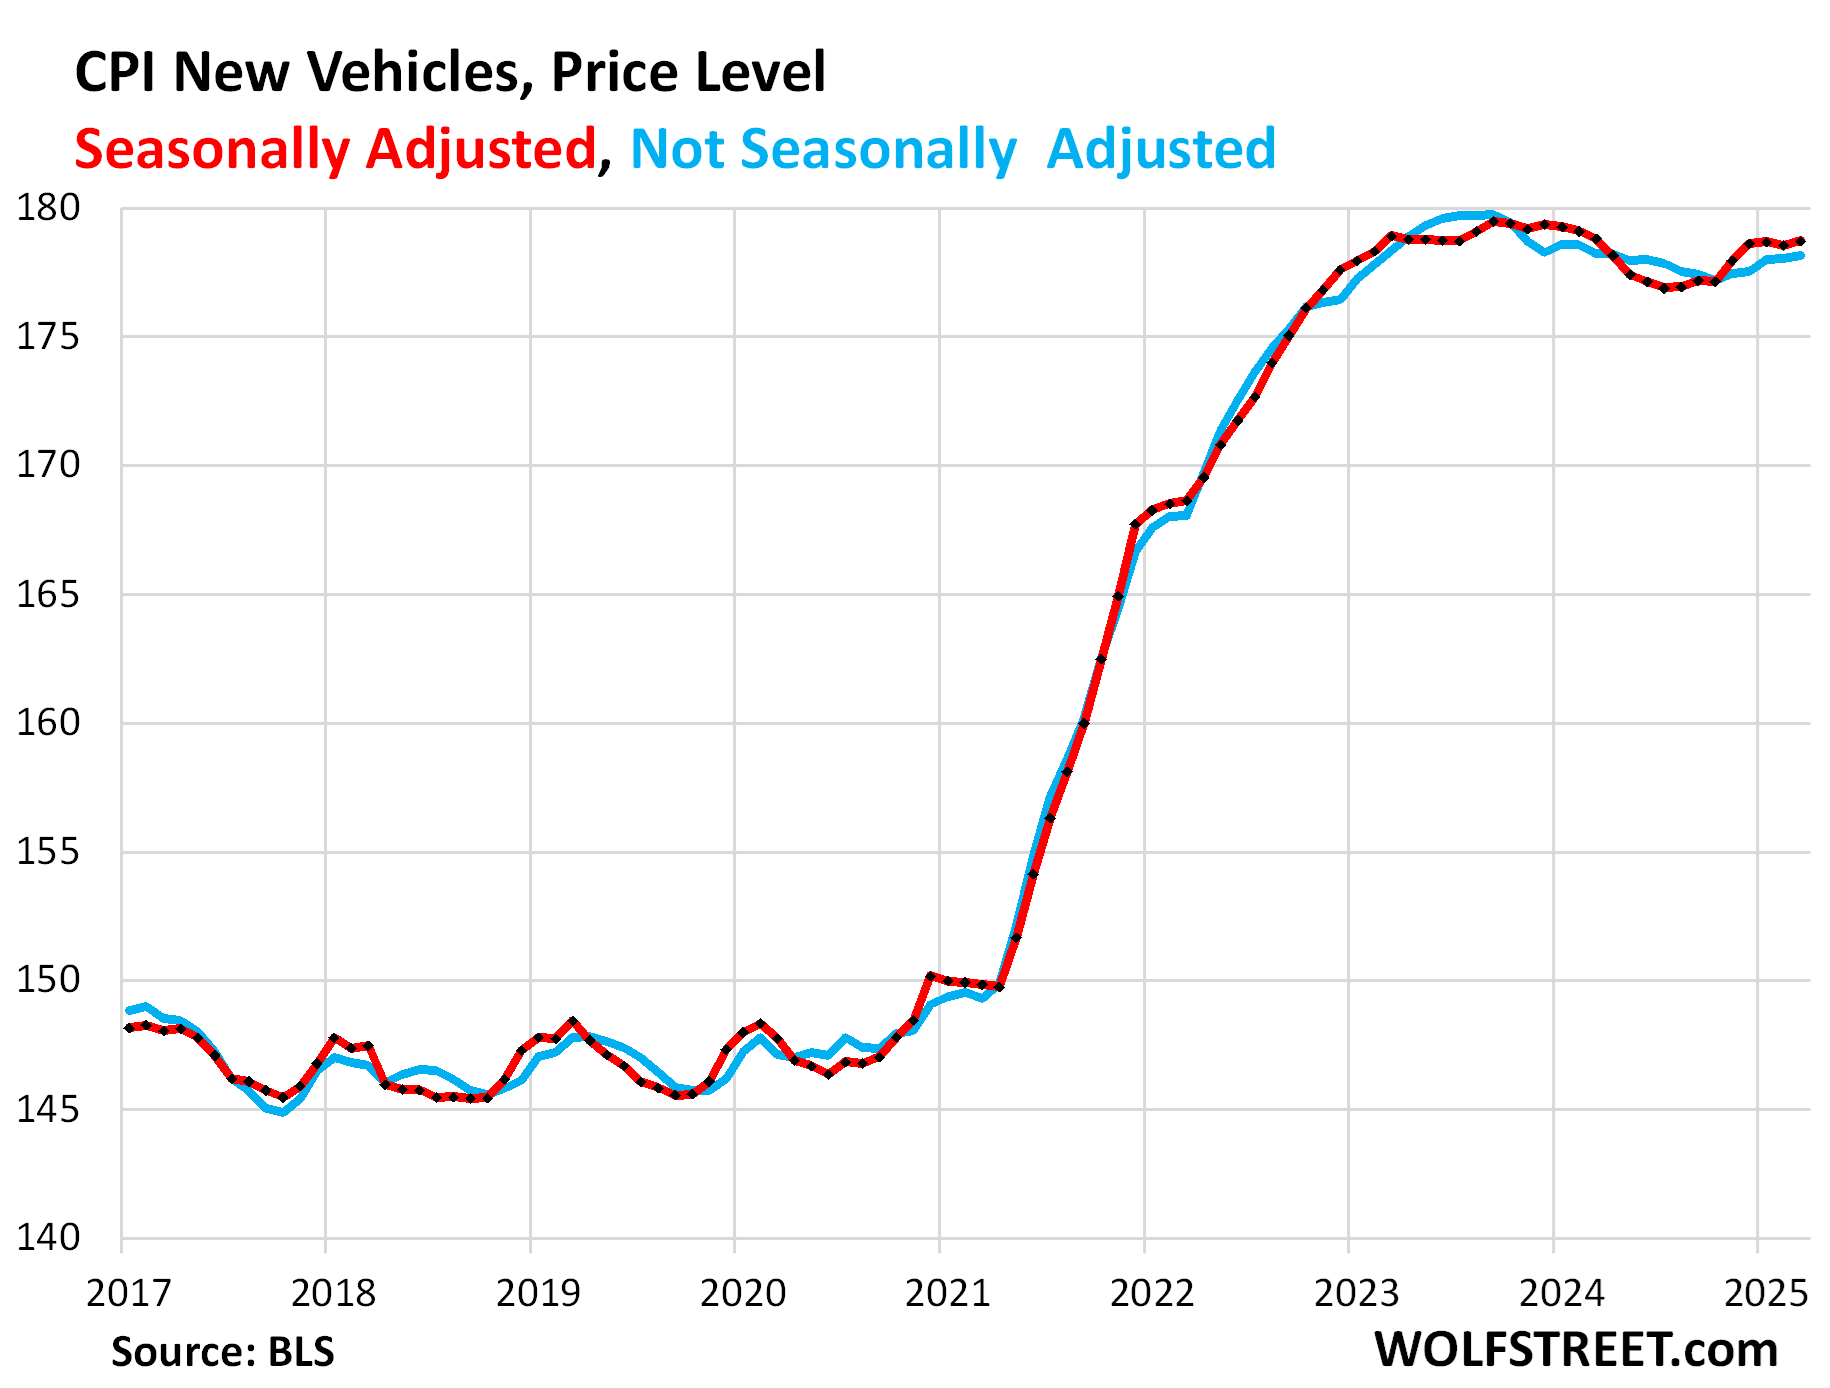
New vehicles CPI edged up month-to-month by 0.1% (+1.2% annualized), seasonally adjusted. Year-over-year, the index also edged up by 0.1%.
Since early 2023, new vehicle prices have been sticky, unlike used-vehicle prices. In Q1, new vehicle unit sales increased solidly, powered by a big increase in March, on top of decent growth in January and February, producing the best Q1 since 2019 [read: Our Drunken Sailors Are Back], after already strong sales growth in Q4. This increase in demand over the past six months may have been why prices haven’t eased.
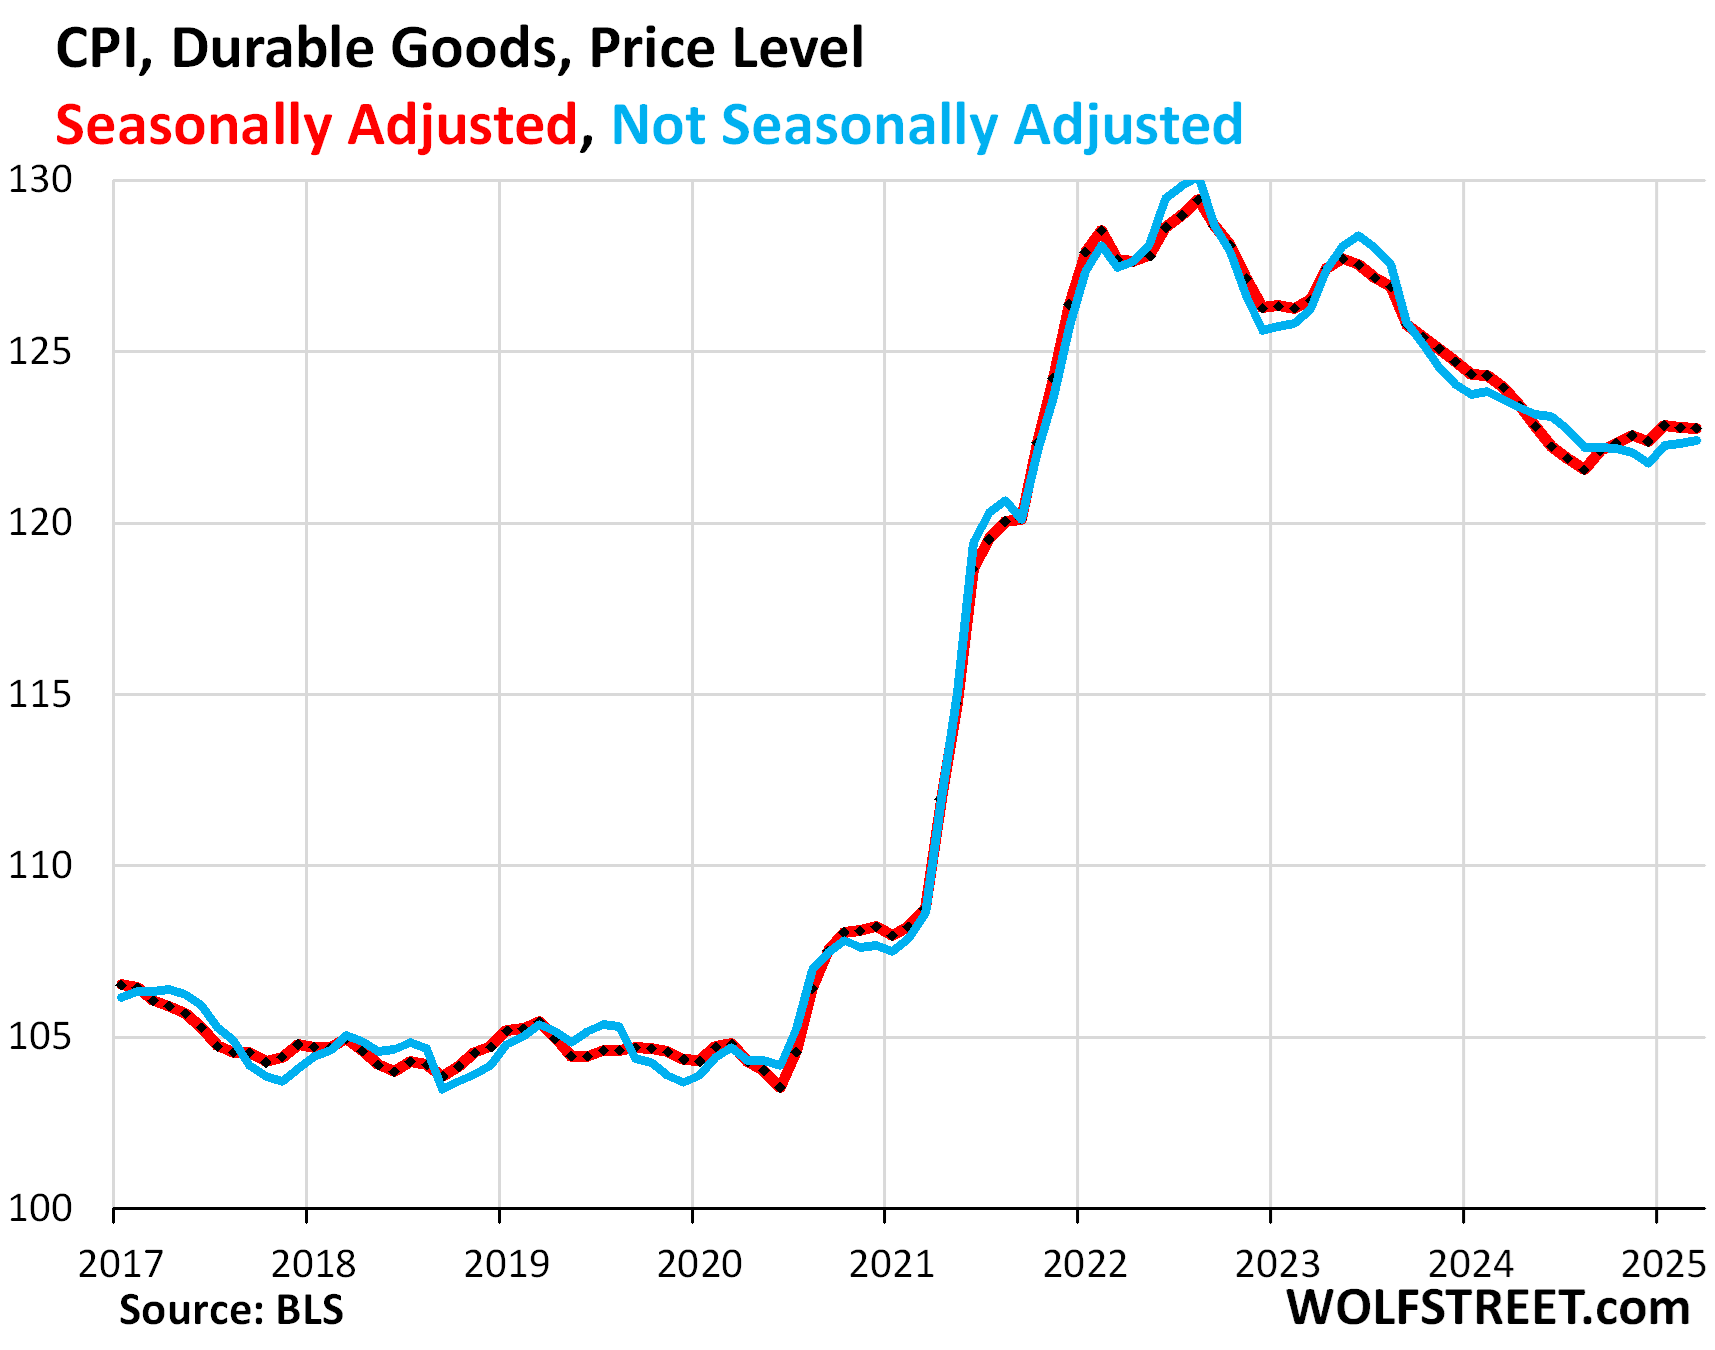
Durable Goods overall – dominated by new and used vehicles – experienced price declines (deflation) across the board from mid-2022 through August 2024, after the huge price spikes during the pandemic. But starting in September 2024, prices of durable goods have started to edge higher unevenly:
| Major durable goods categories | MoM | YoY |
| Durable goods overall | 0.0% | -1.0% |
| New vehicles | 0.1% | 0.0% |
| Used vehicles | -0.7% | 0.6% |
| Household furnishings (furniture, appliances, floor coverings, tools) | 0.0% | -0.3% |
| Sporting goods (bicycles, equipment, etc.) | -0.6% | -5.0% |
| Information technology (computers, smartphones, etc.) | 0.4% | -7.4% |
Food Inflation.
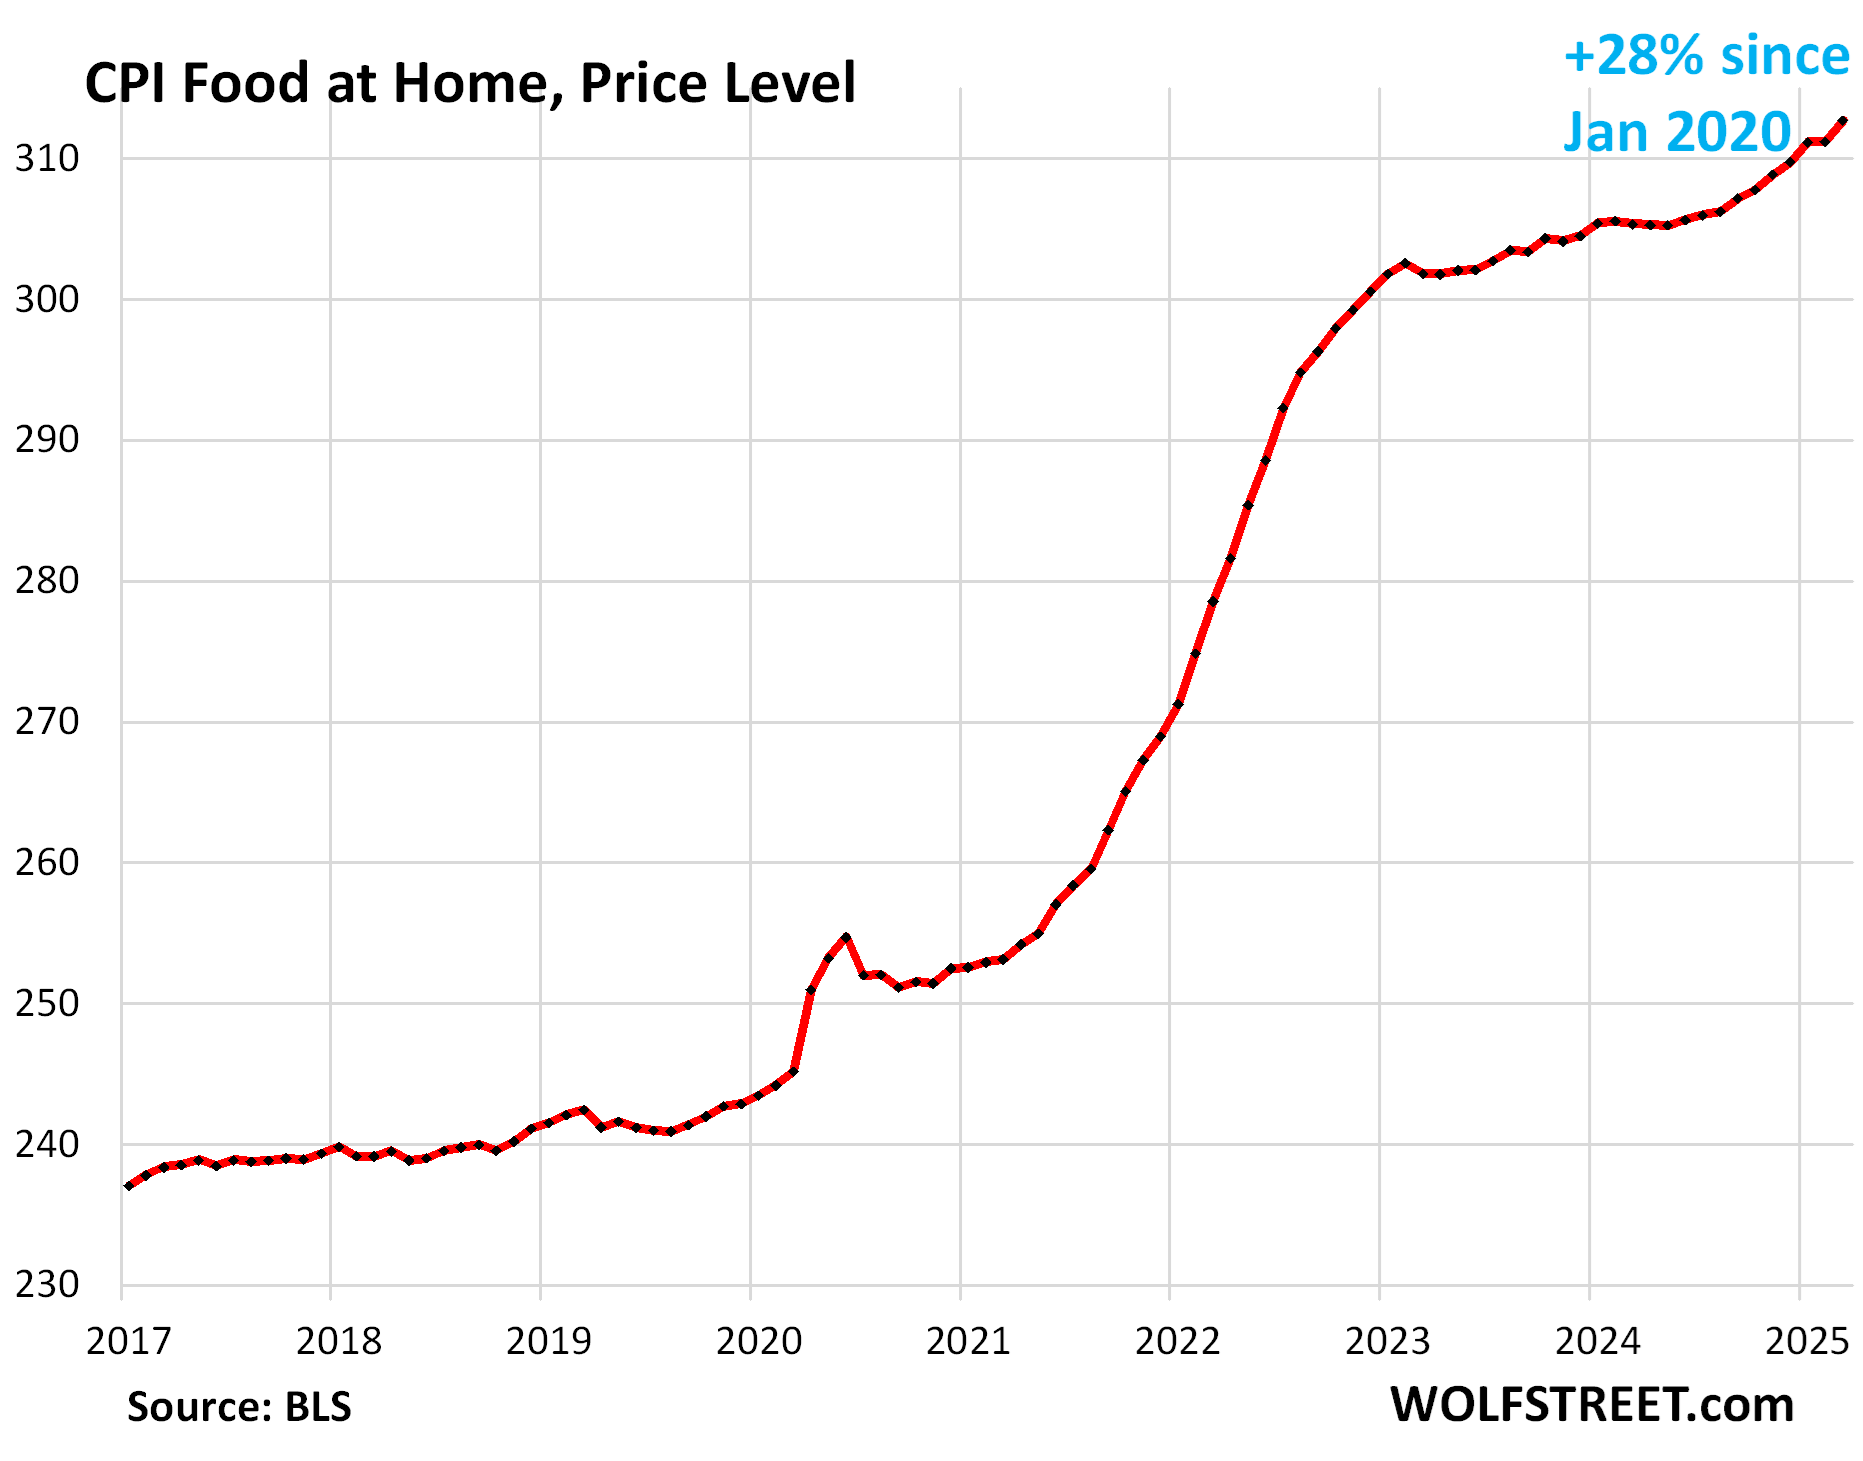
The CPI for “Food at home” jumped by 0.5% month-to-month (+6.0% annualized), the worst increase since October 2022, with big increases in many categories, particularly eggs (due to the avian flu), beef, pork, poultry, dairy, juices, and baby food.
Year-over-year, the index rose by 2.4%, the worst increase since August 2023. Since January 2020, food prices have surged by 28%. This is food purchased at stores and markets to be eaten off premises.
| MoM | YoY | |
| Food at home | 0.5% | 2.4% |
| Cereals, breads, bakery products | -0.1% | 1.1% |
| Beef and veal | 1.2% | 8.6% |
| Pork | 1.7% | 2.9% |
| Poultry | 0.9% | 0.9% |
| Fish and seafood | -1.5% | 0.2% |
| Eggs | 5.9% | 60.4% |
| Dairy and related products | 1.0% | 2.2% |
| Fresh fruits | -0.4% | 1.2% |
| Fresh vegetables | -1.0% | -3.0% |
| Juices and nonalcoholic drinks | 0.7% | 1.6% |
| Coffee, tea, etc. | 0.4% | 4.5% |
| Fats and oils | 0.5% | 1.1% |
| Baby food & formula | 0.6% | 0.0% |
| Alcoholic beverages at home | 0.3% | 0.9% |
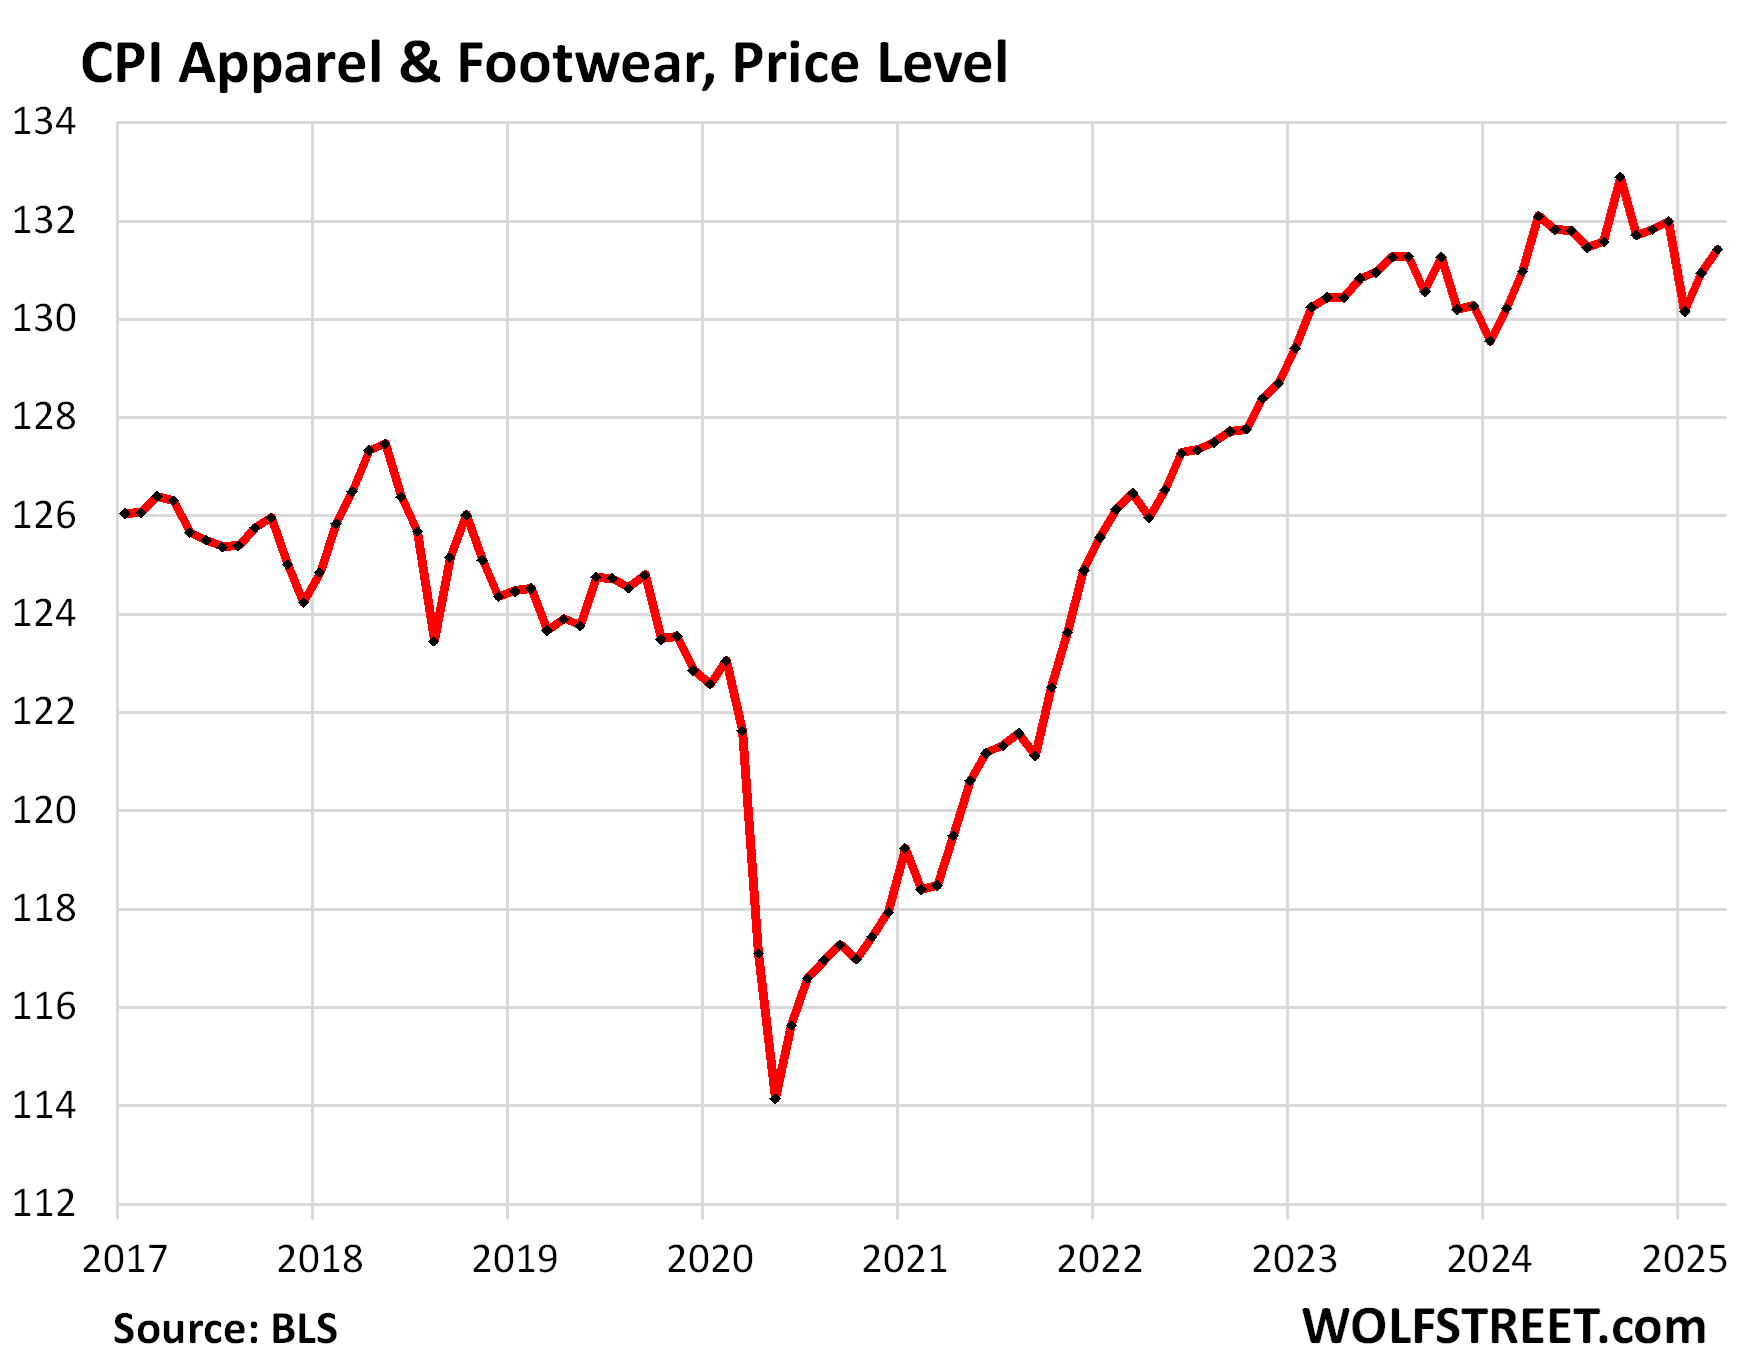
Apparel and footwear.
The CPI for apparel and footwear rose by 0.4% (not annualized), and year-over-year by 0.3%.
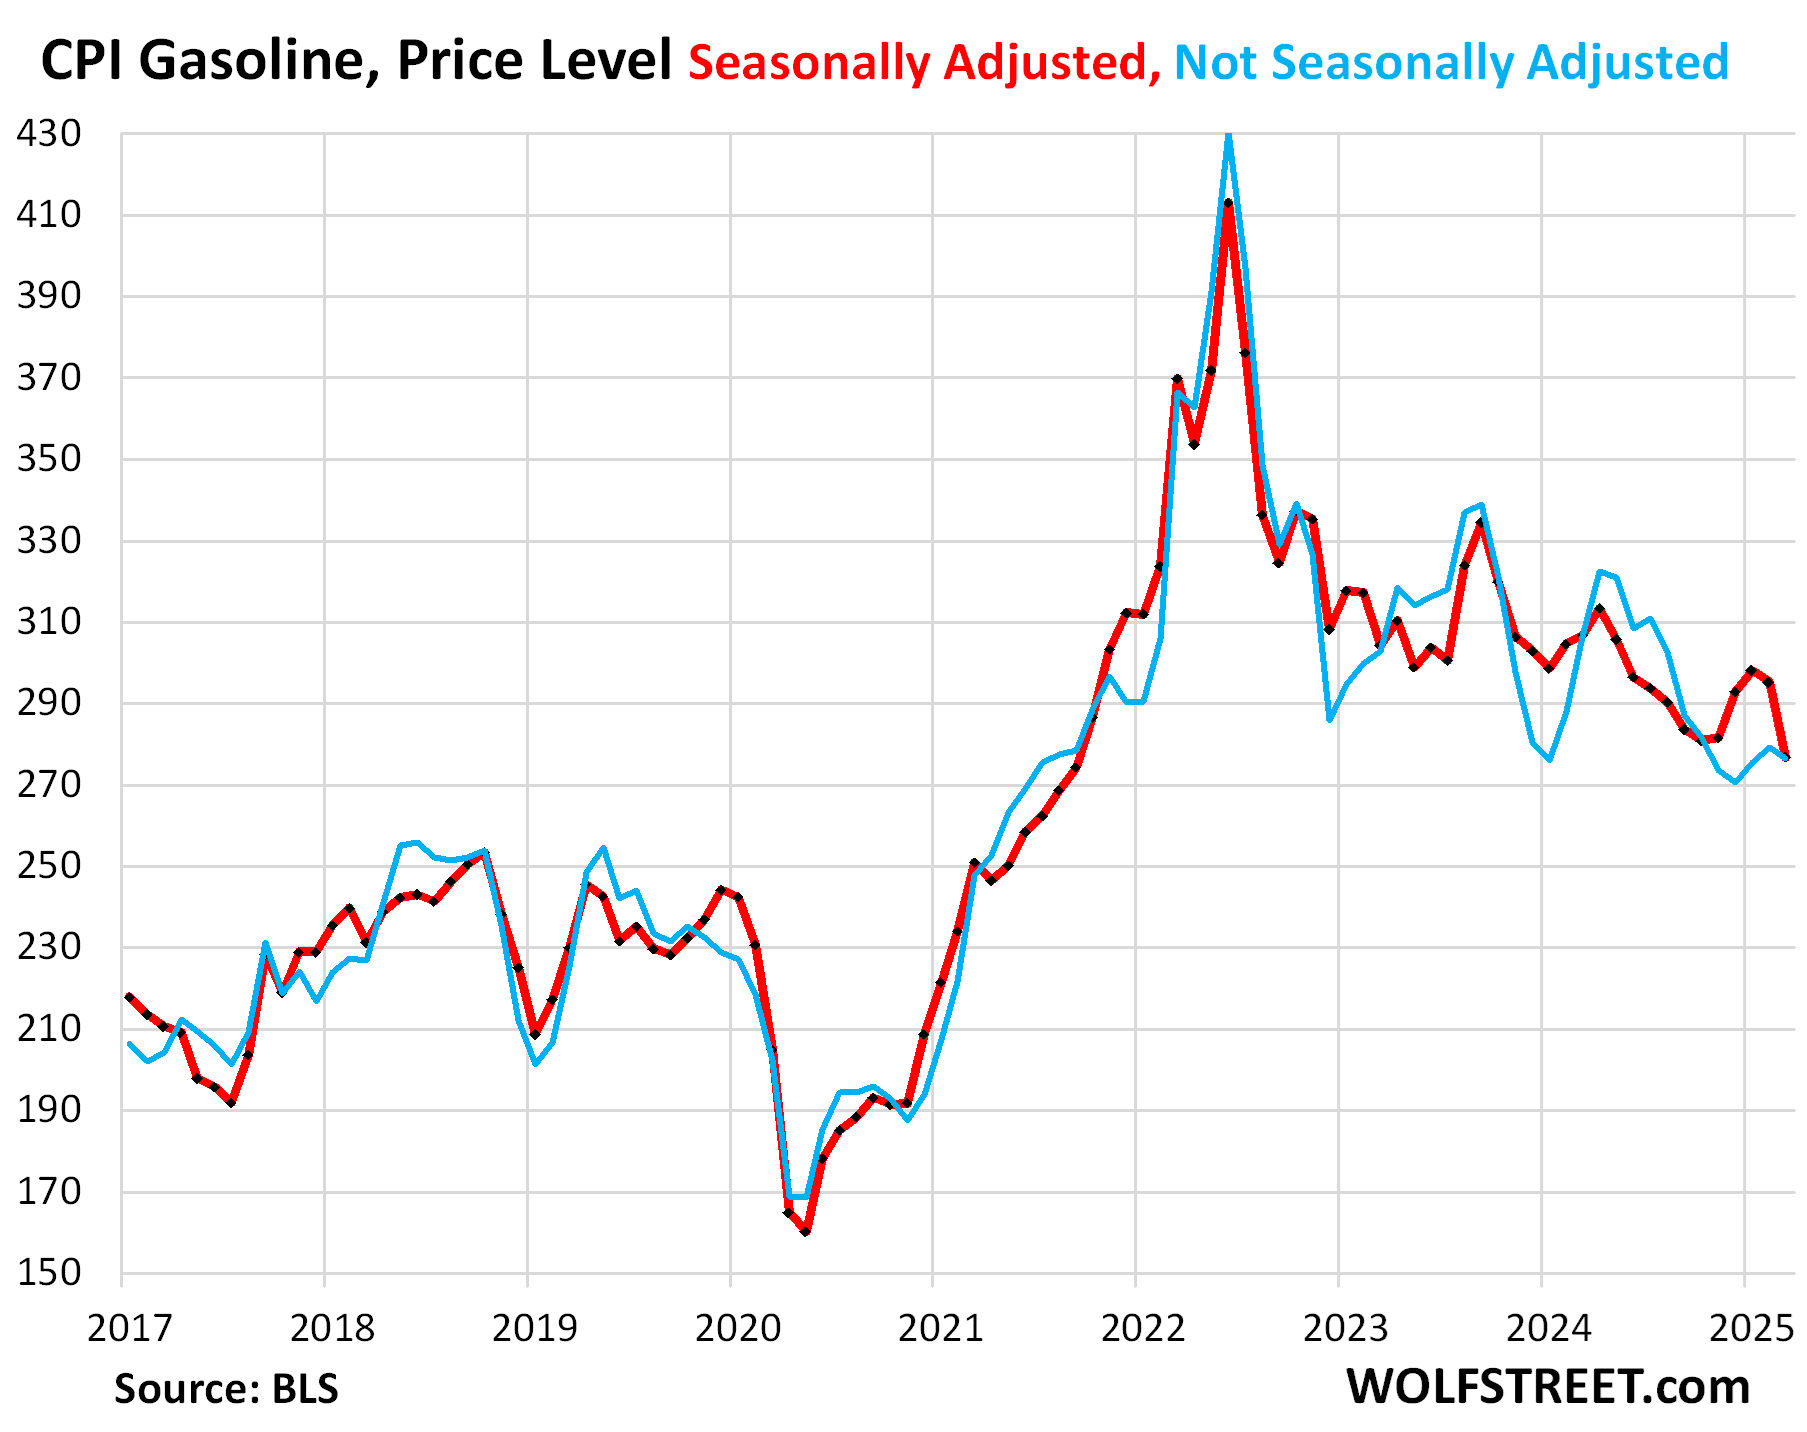
Energy.
The CPI for gasoline, not seasonally adjusted, fell in March from February, which was unusual because gasoline prices generally rise in March. So the seasonally adjusted index plunged by 6.3% (not annualized).
Year-over-year, the gasoline index plunged by 9.8%, to the lowest price level since September 2021. The driver here is the continued plunge in oil prices. Gasoline makes up about half of the overall energy CPI.
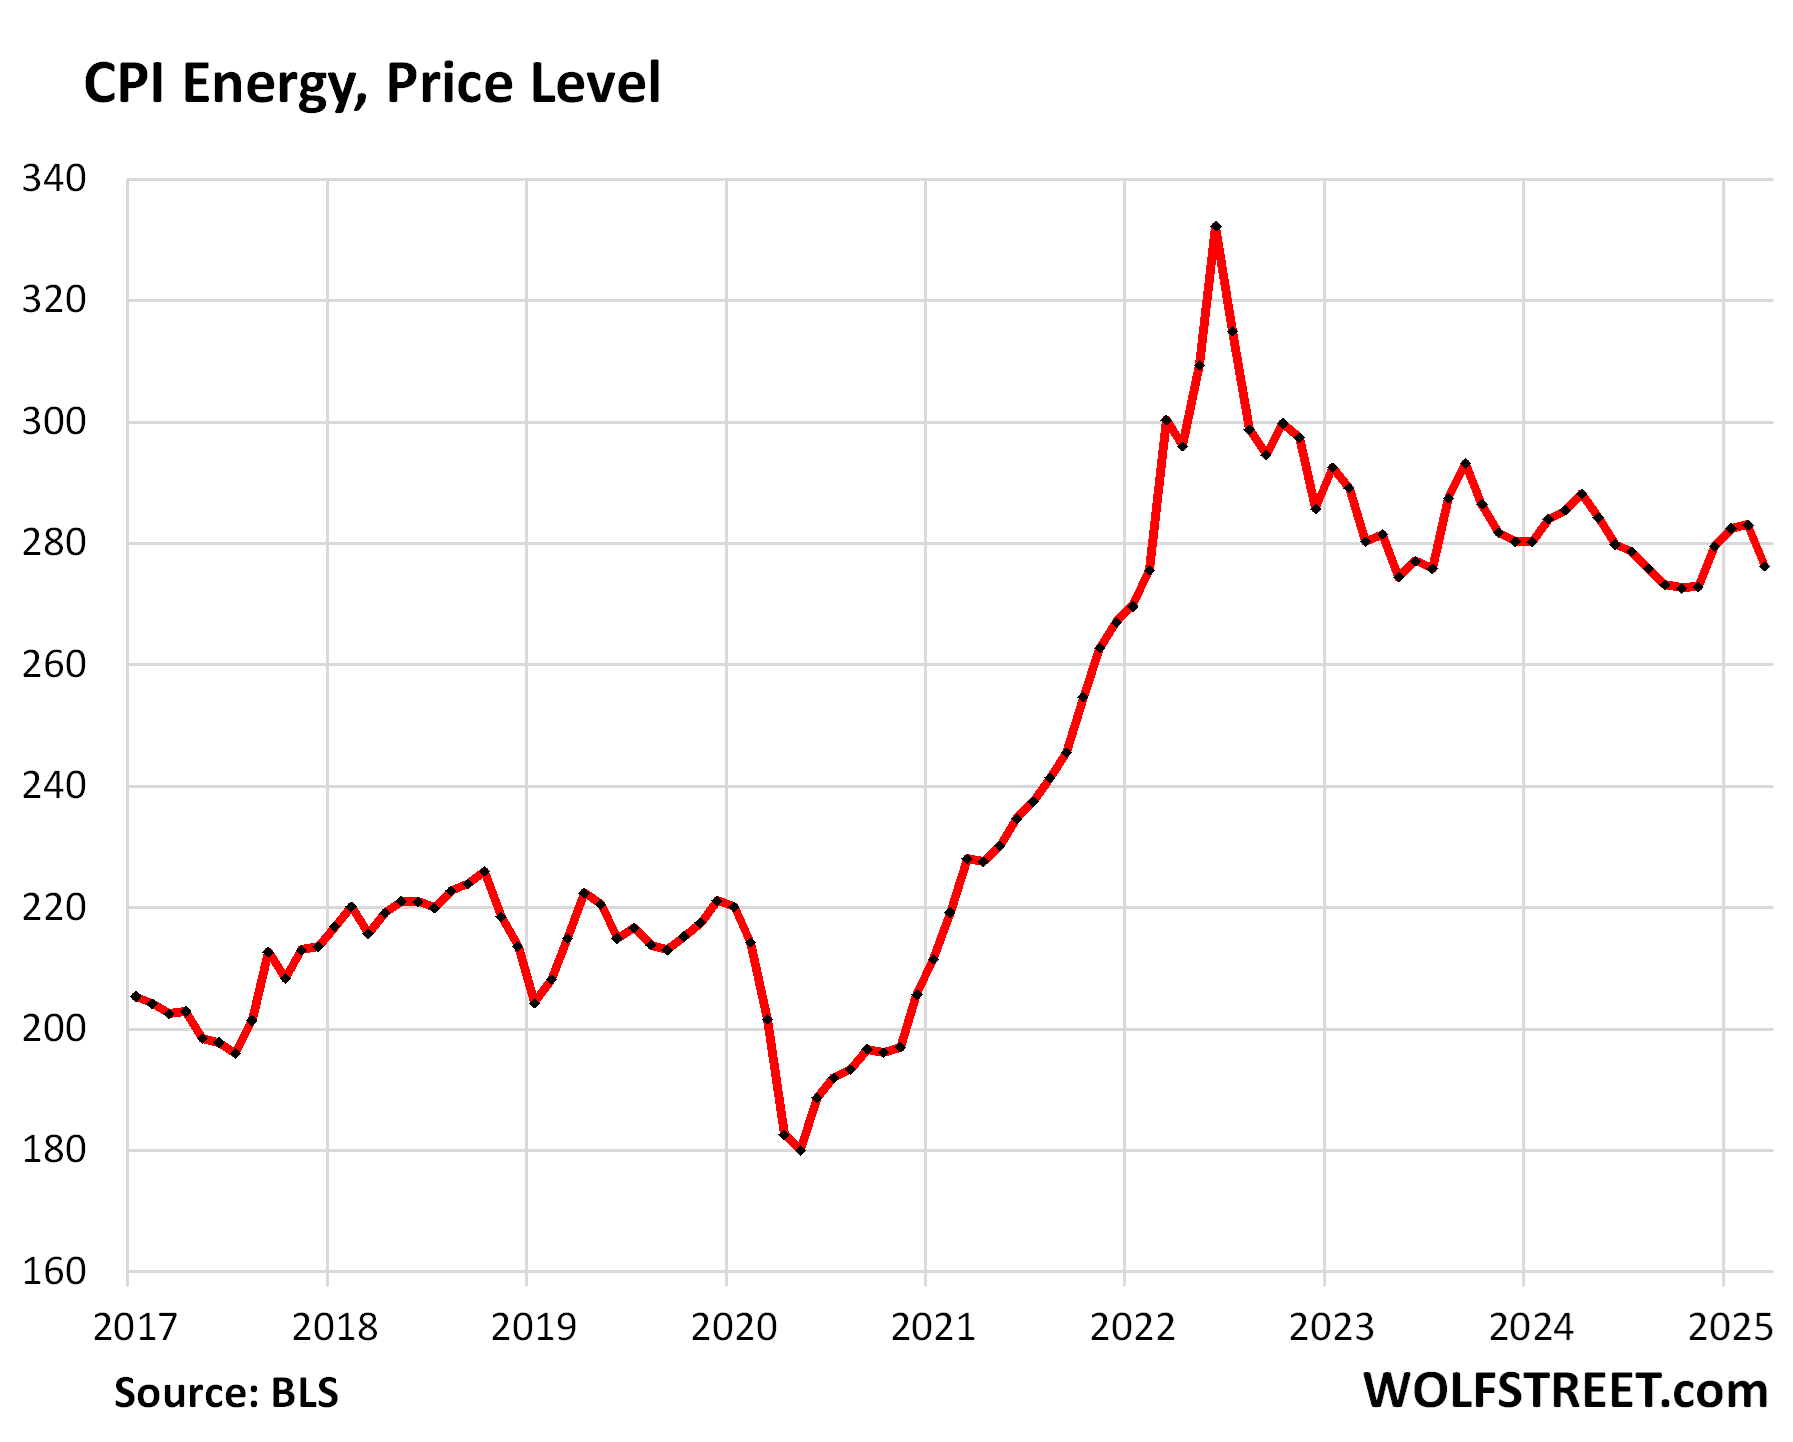
The CPI for energy plunged month-to-month by 2.4% (not annualized), driven by the plunge in gasoline prices. But prices for electricity and natural gas piped to the home jumped.
| CPI for Energy, by Category | MoM | YoY |
| Overall Energy CPI | -2.4% | -3.3% |
| Gasoline | -6.3% | -9.8% |
| Electricity service | 0.9% | 2.8% |
| Utility natural gas to home | 3.6% | 9.4% |
| Heating oil, propane, kerosene, firewood | -3.0% | -3.3% |
Enjoy reading WOLF STREET and want to support it? You can donate. I appreciate it immensely. Click on the mug to find out how:

![]()
The post Beneath the Skin of CPI Inflation: Surging Prices of Food, Housing, Medical Care Meet Plunging Prices of Gasoline & Travel Services appeared first on Energy News Beat.
“}]]
