
 [[{“value”:”
But in some metros, prices continued to spike. By Metro: Toronto, Vancouver, Victoria, Calgary, Ottawa, Montreal, Halifax, Edmonton, Winnipeg, Quebec City.
By Wolf Richter for WOLF STREET.
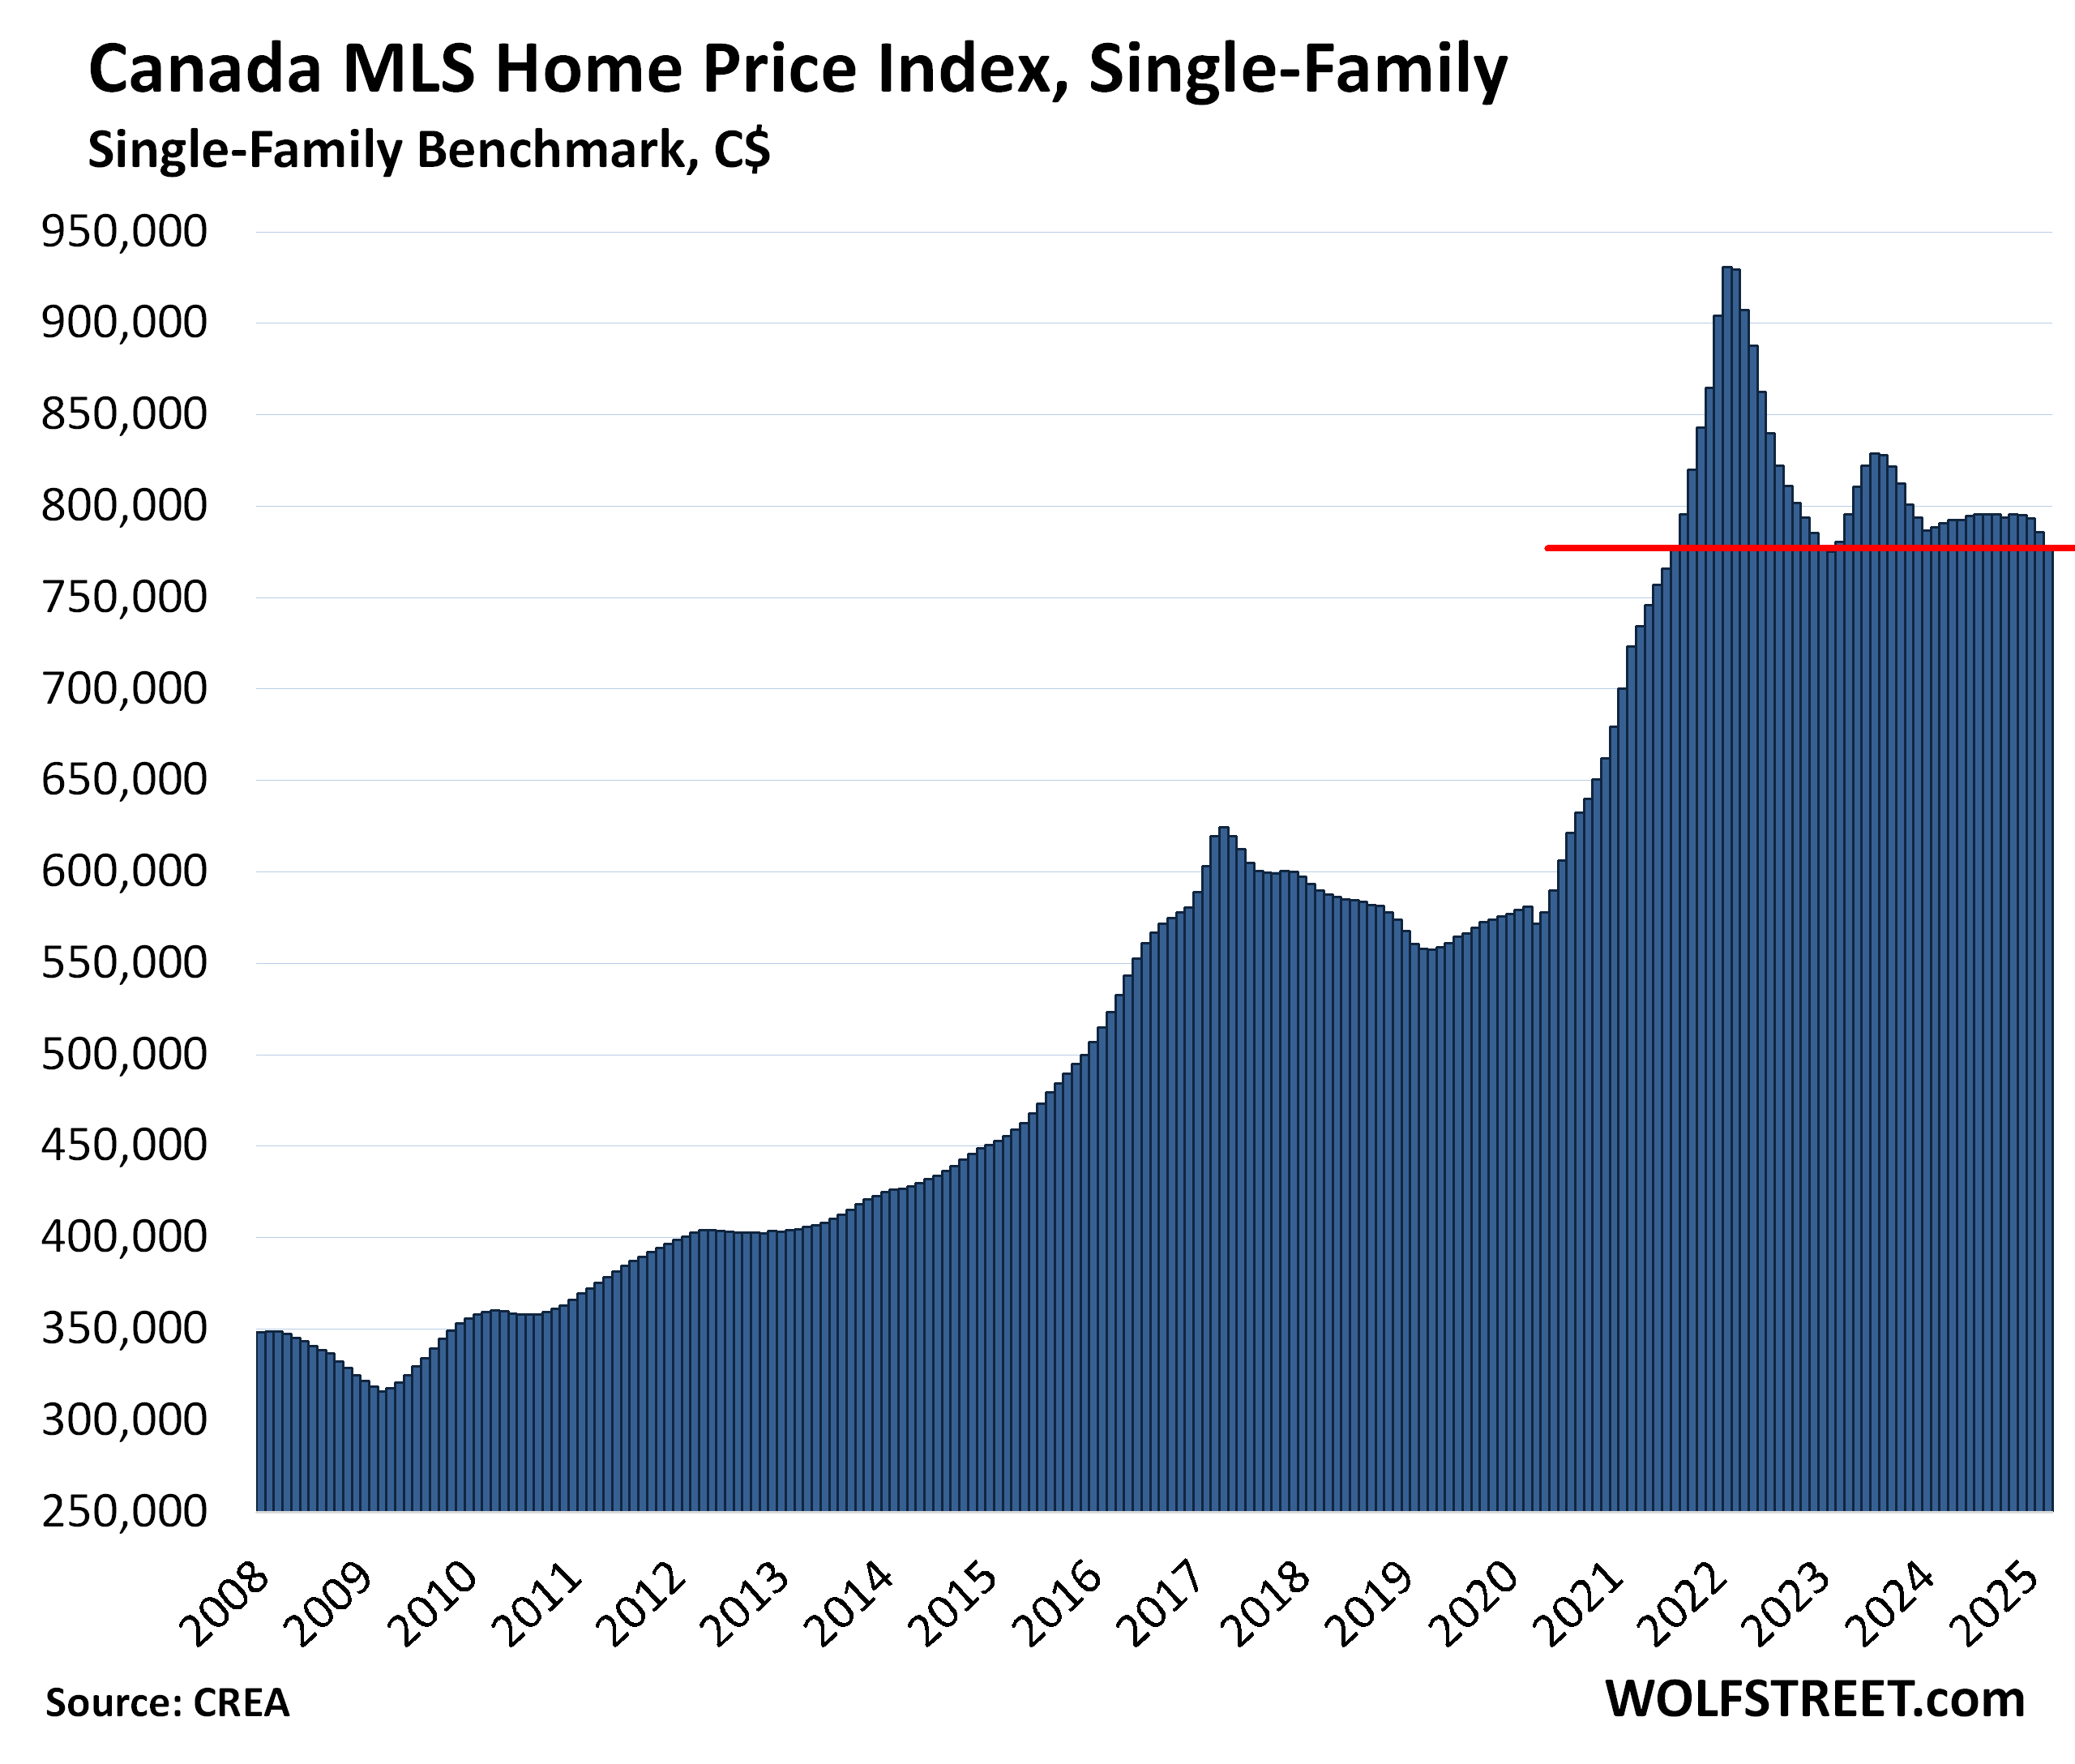
As sales plunged and supply surged, prices of single-family properties in Canada fell by 1.1% in March from February and were down by 1.7% year-over-year, and by 16.5% from the crazy peak in February 2022, and are back to where they’d first been in August 2021, according to the seasonally adjusted Canada MLS Home Price Index released by the Canadian Real Estate Association (CREA) today.
But individual markets show drastically different price-dynamics: The gigantic Greater Toronto and Hamilton market got hit hardest, but prices continued to surge in the Prairies, in the Province of Quebec, and on the East Coast.
Condo prices fell by 0.7% in March from February, by 3.2% year-over-year, and by 11% from the peak in March 2022, to the lowest level since October 2021.
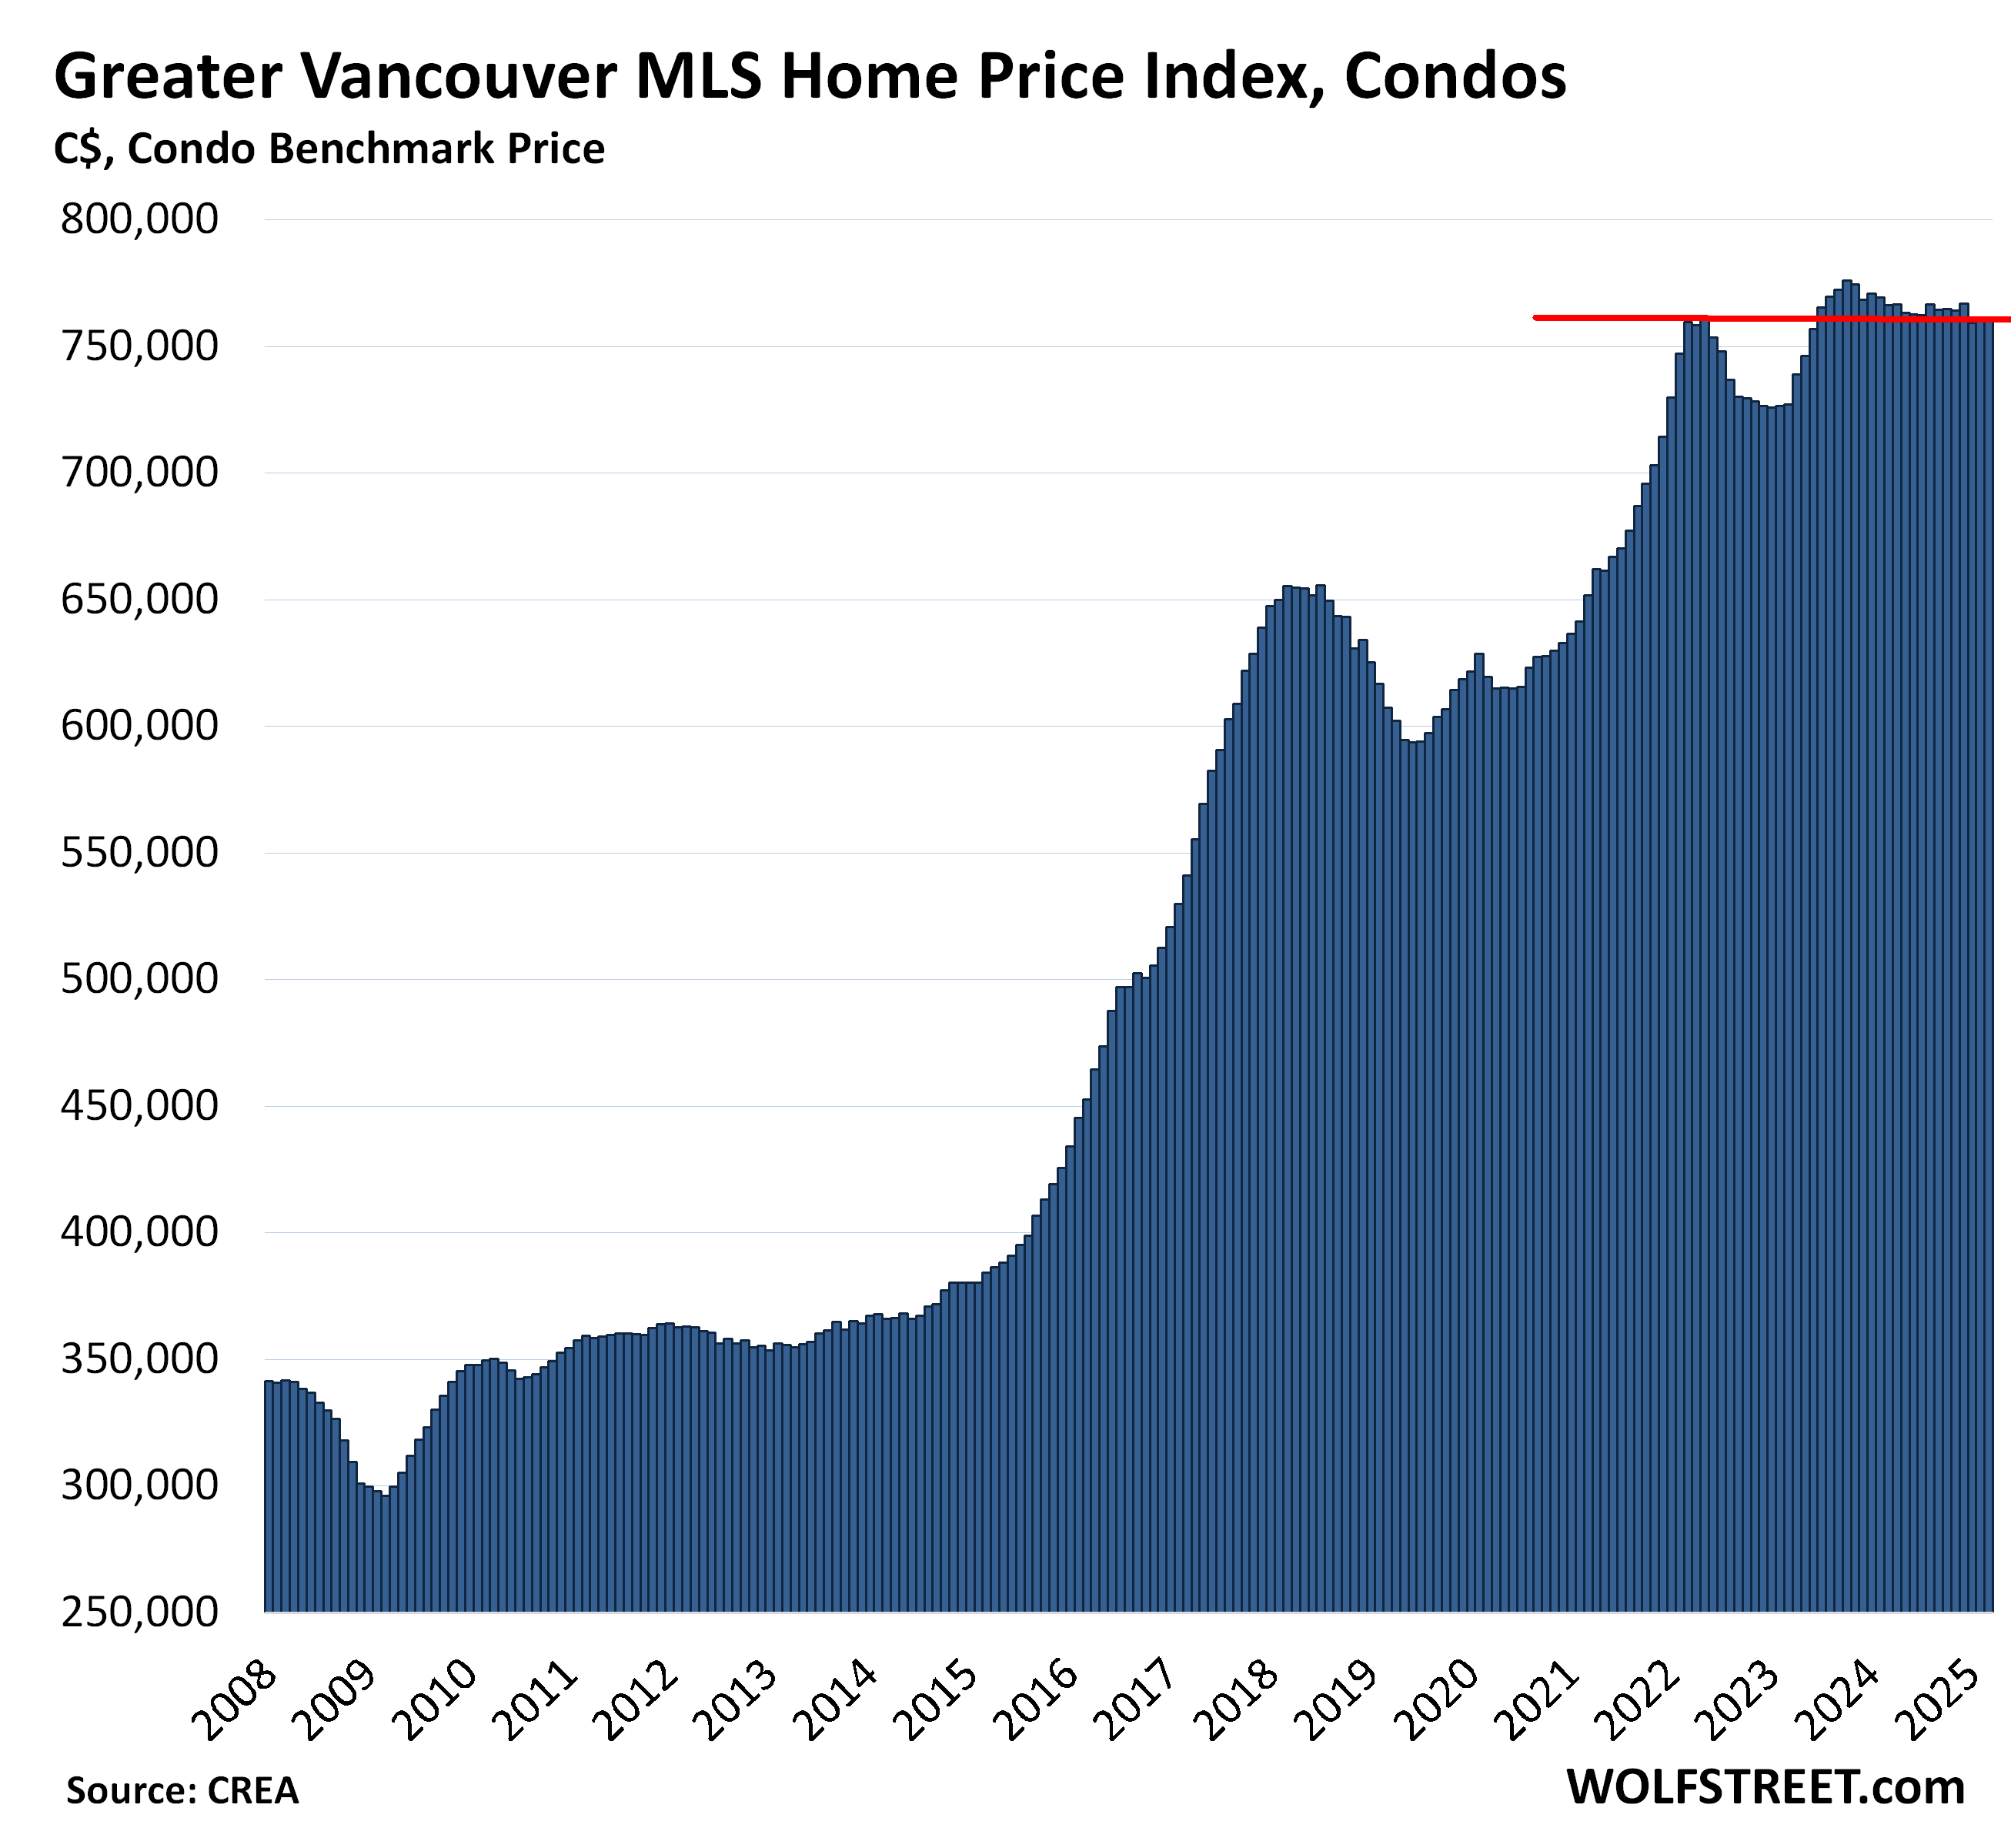
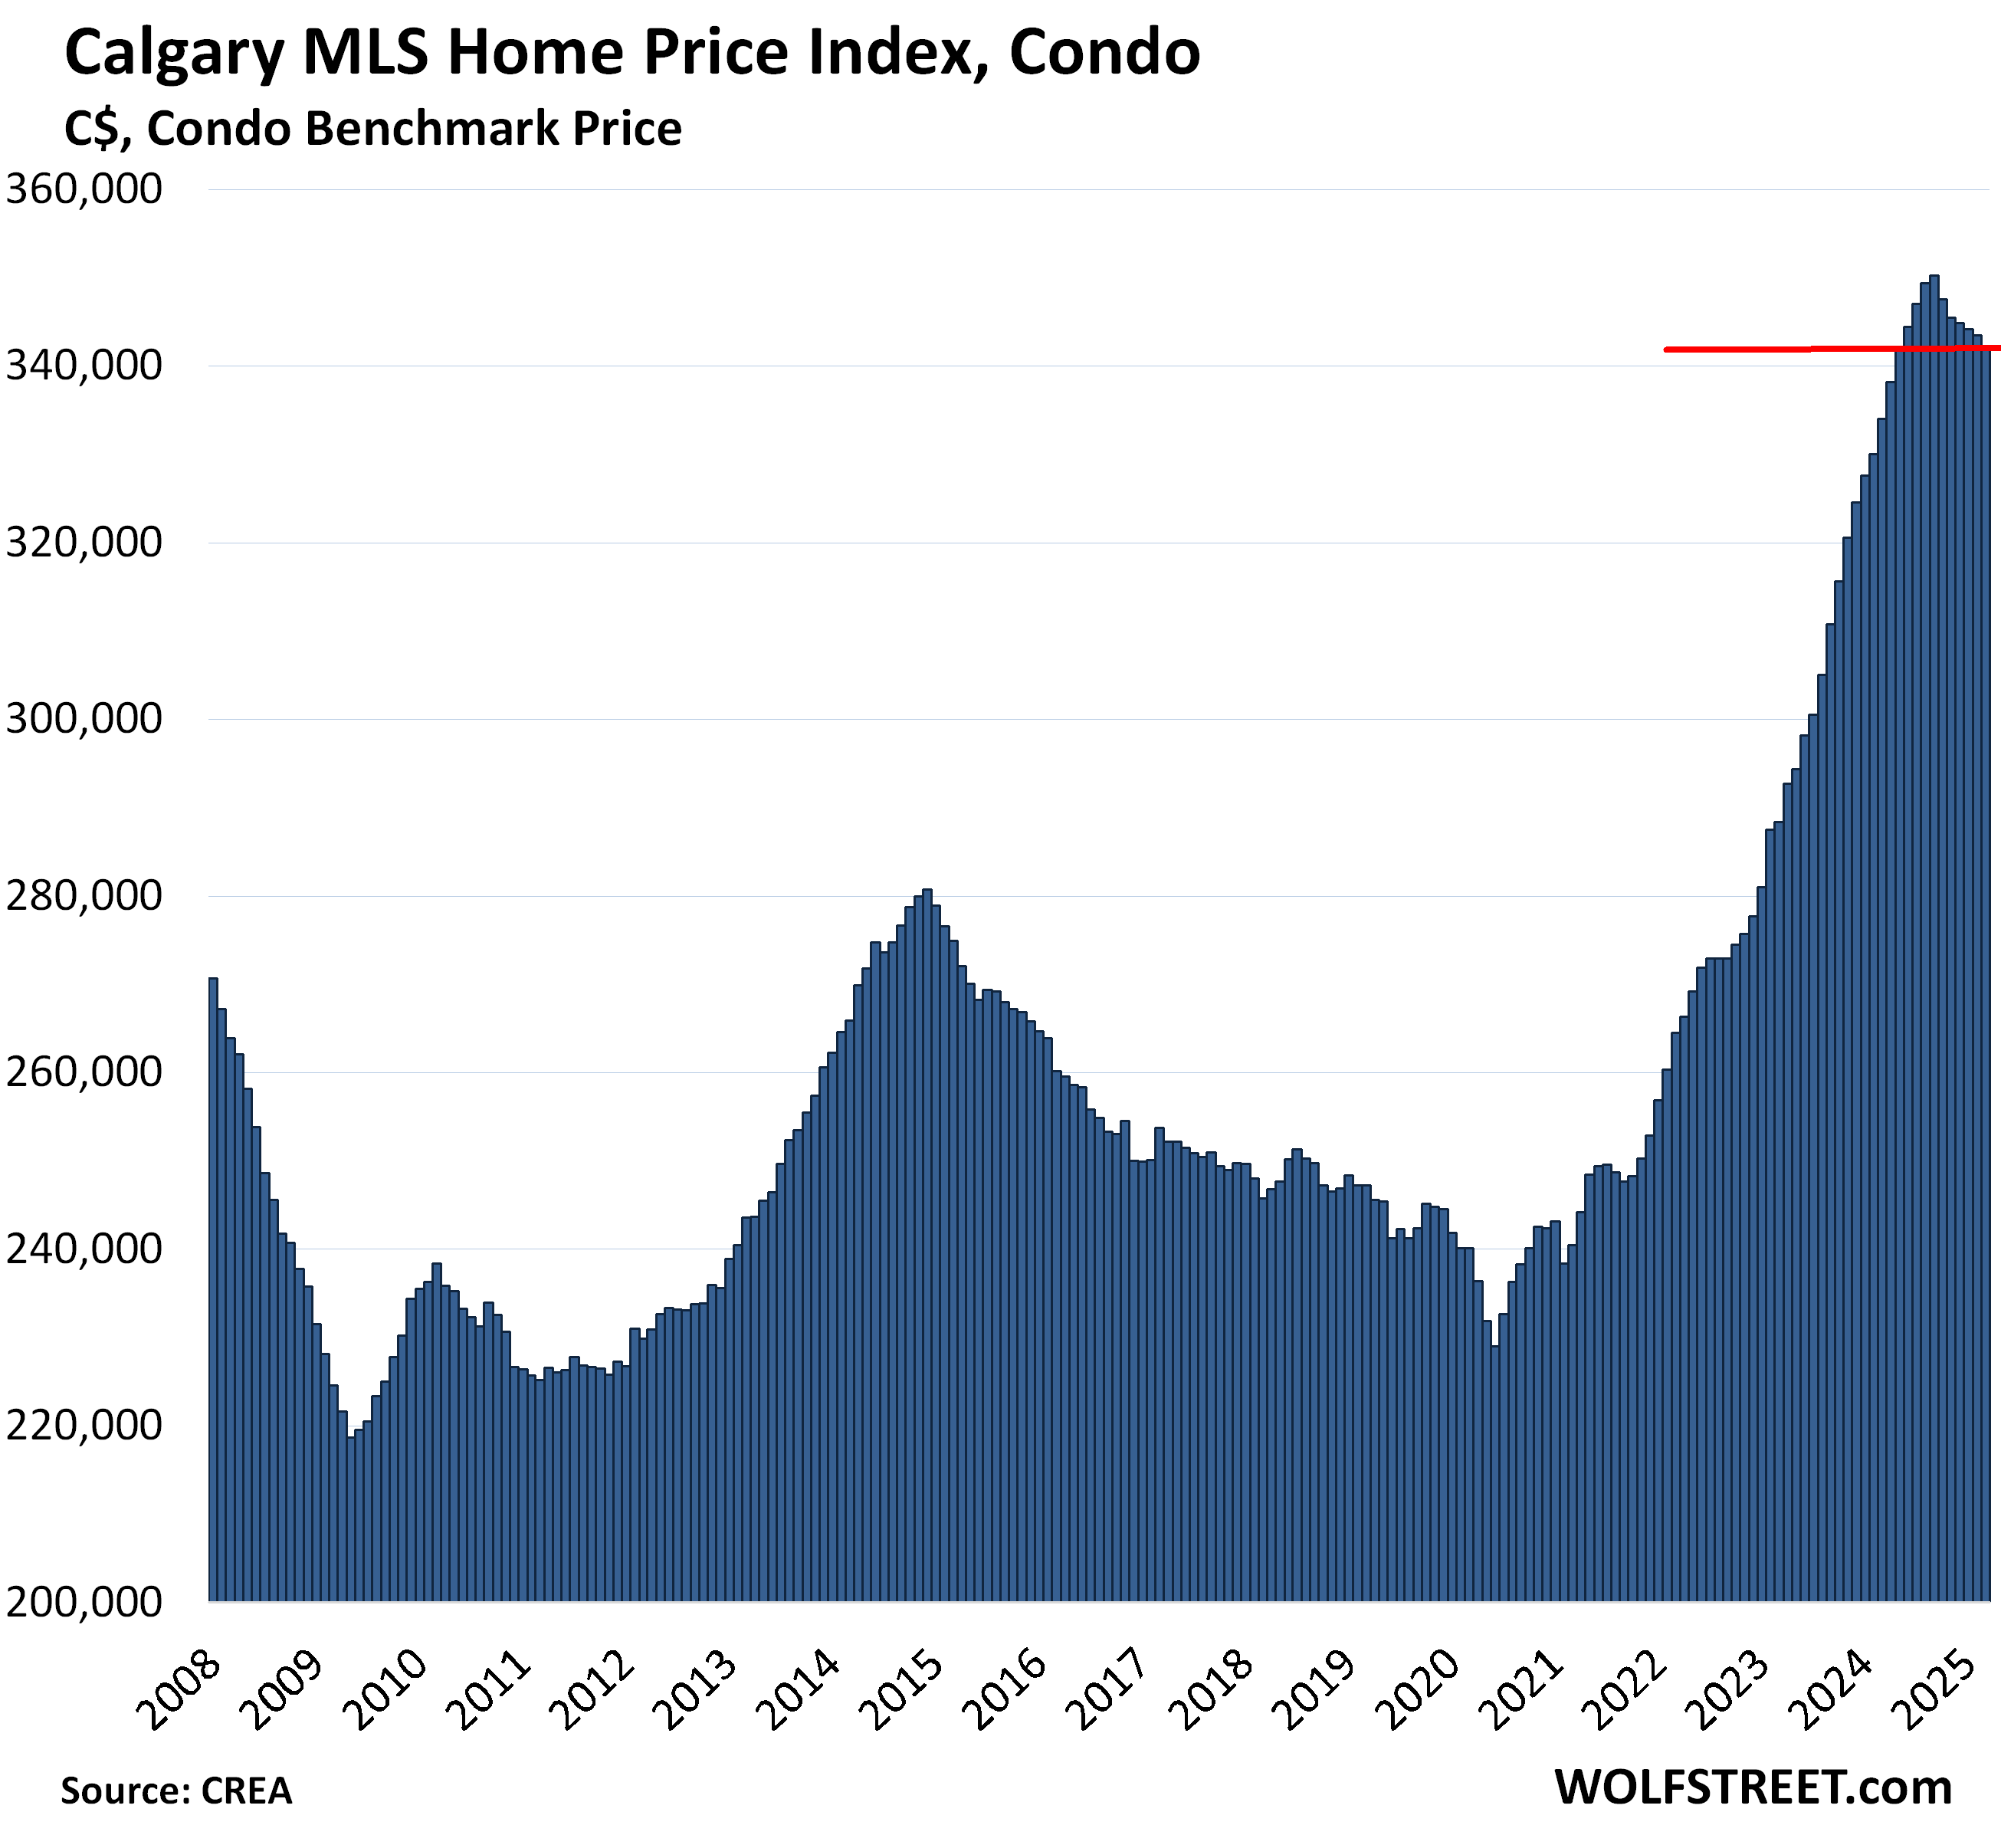
In Toronto, condo prices fell to multi-year lows, and even in Calgary, condo prices started to sag last year. In Greater Vancouver, condo prices declined only a little from the peak in 2023 and are roughly where they had been in February 2022.

Sales plunged, supply surged.
Home sales in Canada fell by 4.8% in March from February, seasonally adjusted, on top of the declines in the prior three months, and by 9.3% year-over-year, and by 20% from November, to the lowest level for any March since 2009, according to CREA today.
Year-over-year, sales plunged by 24.6% in the province of Ontario, driven they plunge in the Greater Toronto Area, and by 9.6% in British Columbia, driven by the declines in Greater Vancouver.
New listings rose by 3.0% in March from February. Inventory on the market for sale rose by 3.3% month-to-month, and by 18.3% year-over-year to 165,800, which is still below average for this time of the year, but sales have plunged, and so supply jumped to 5.1 months at the current rate of sales, the highest since the spike in April and May 2020.
Every market dances to its own drummer.
Big price drops and multi-year lows in the Greater Toronto and Hamilton Area coexist with continued price spikes in smaller markets, such as Edmonton, Winnipeg, and Quebec City.
In the US, a similar pattern is playing out, with big price drops and multi-year lows in some markets, and continued price increases in others: The Most Splendid Housing Bubbles in America: The Price Drops & Gains of 33 Largest Costliest Housing Markets.
The price indices below are seasonally adjusted, in Canadian dollars.
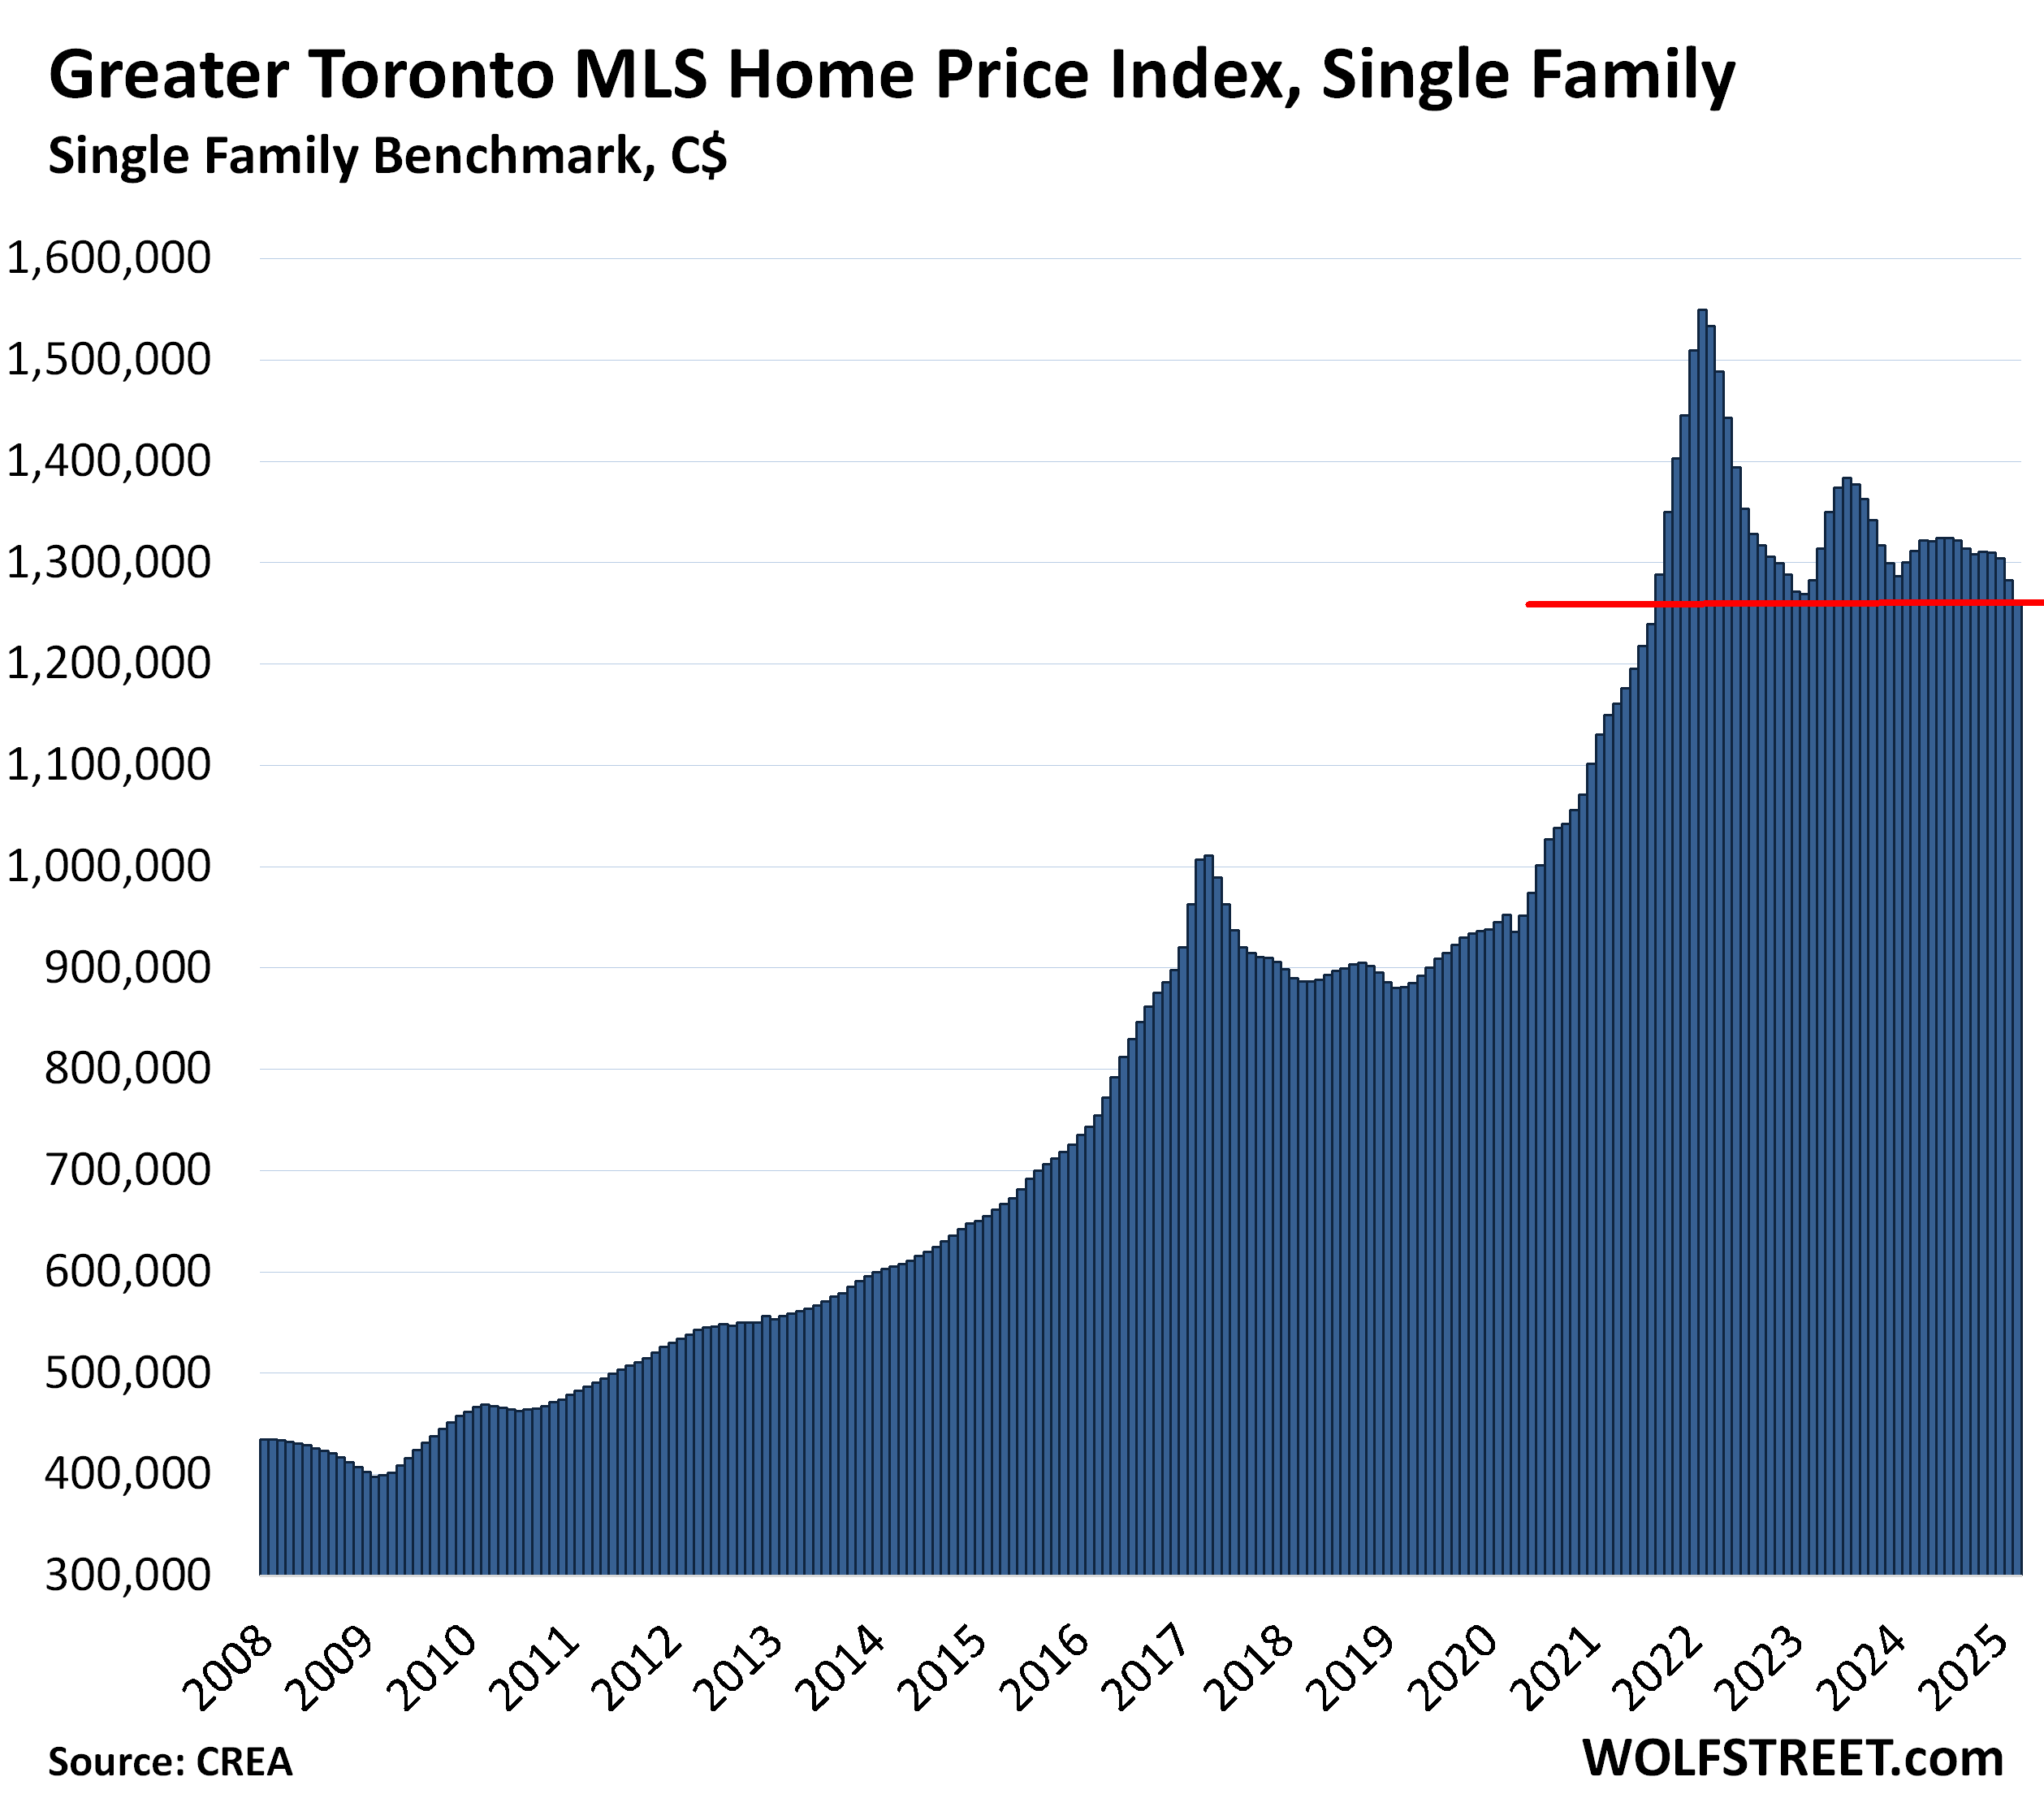
Greater Toronto Area, single-family MLS Home Price Benchmark Index:
- Month-to-month: -1.6%, to at $1,262,100; the lowest since August 2021
- From peak in February 2022: -18.6%
- Year-over-year: -3.8%.
The three descending peaks occurred in February 2022, June 2023, and June 2024. The peak of the prior housing-mania spike occurred in April 2017.
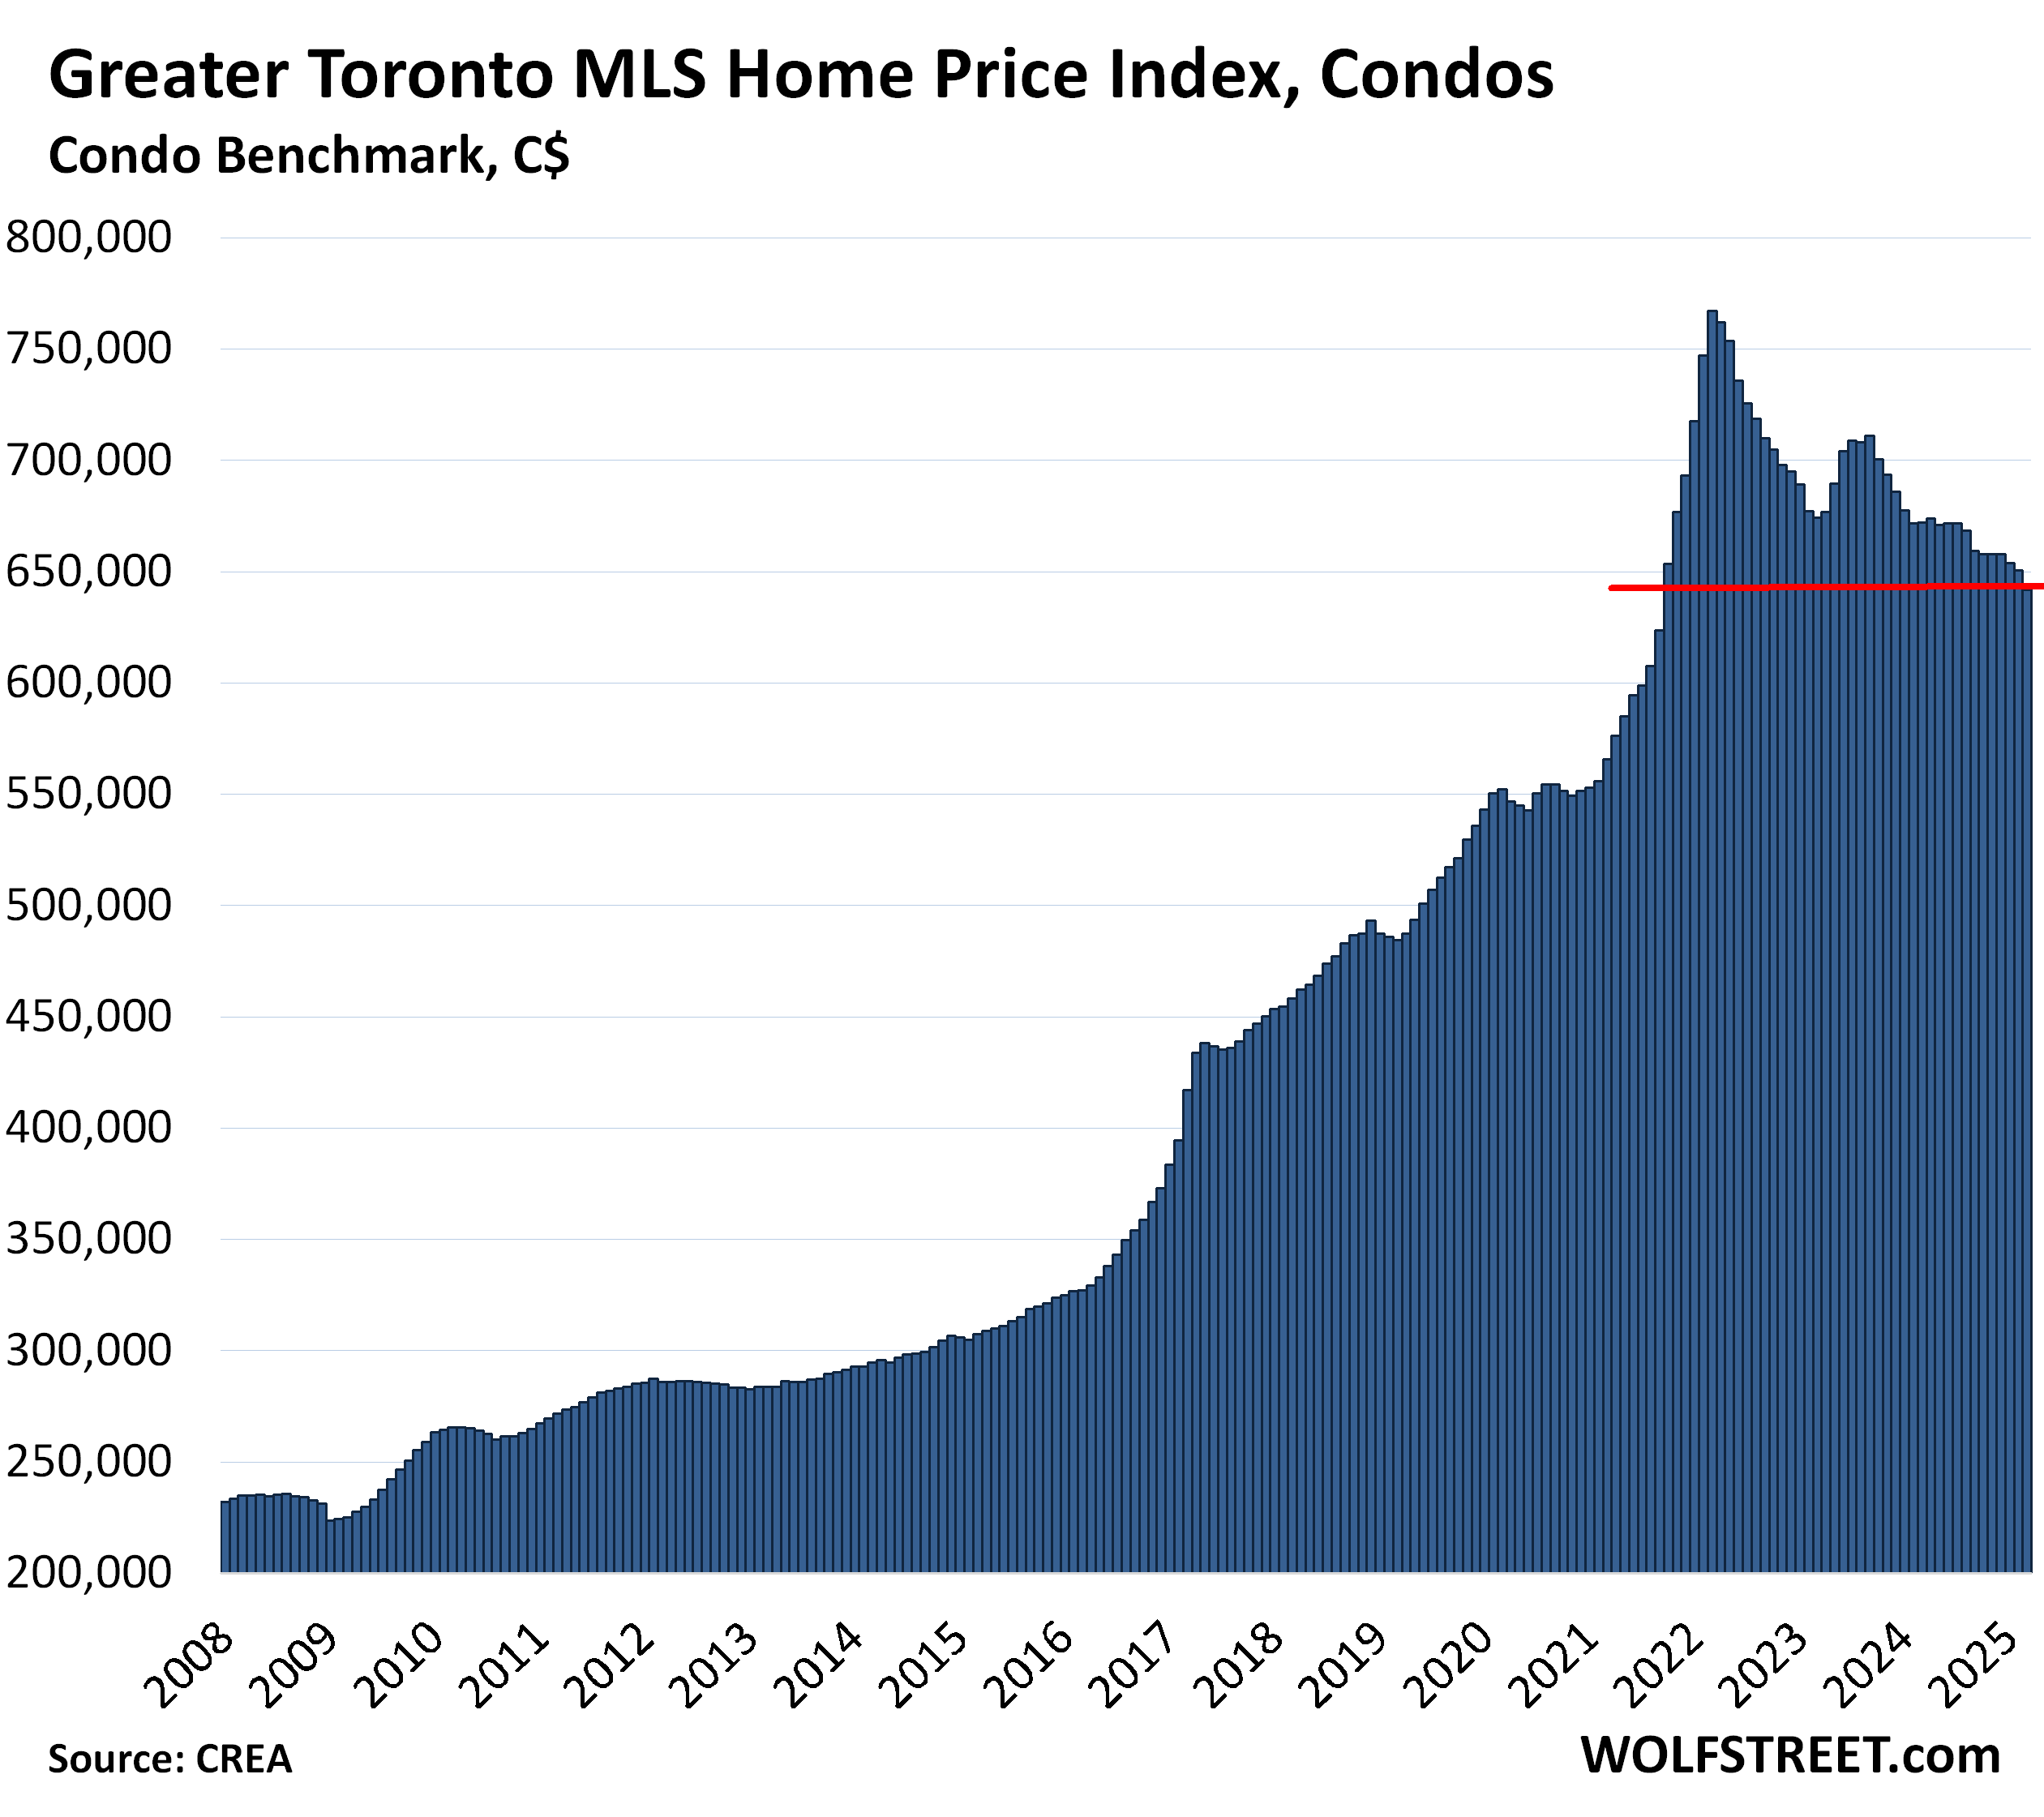
Greater Toronto Area, condo benchmark price:
- Month-to-month: -1.4% to $641,800, lowest since September 2021.
- From peak in April 2022: -16.3%
- Year-over-year: -4.5%, with year-over-year declines in 26 of the past 27 months.
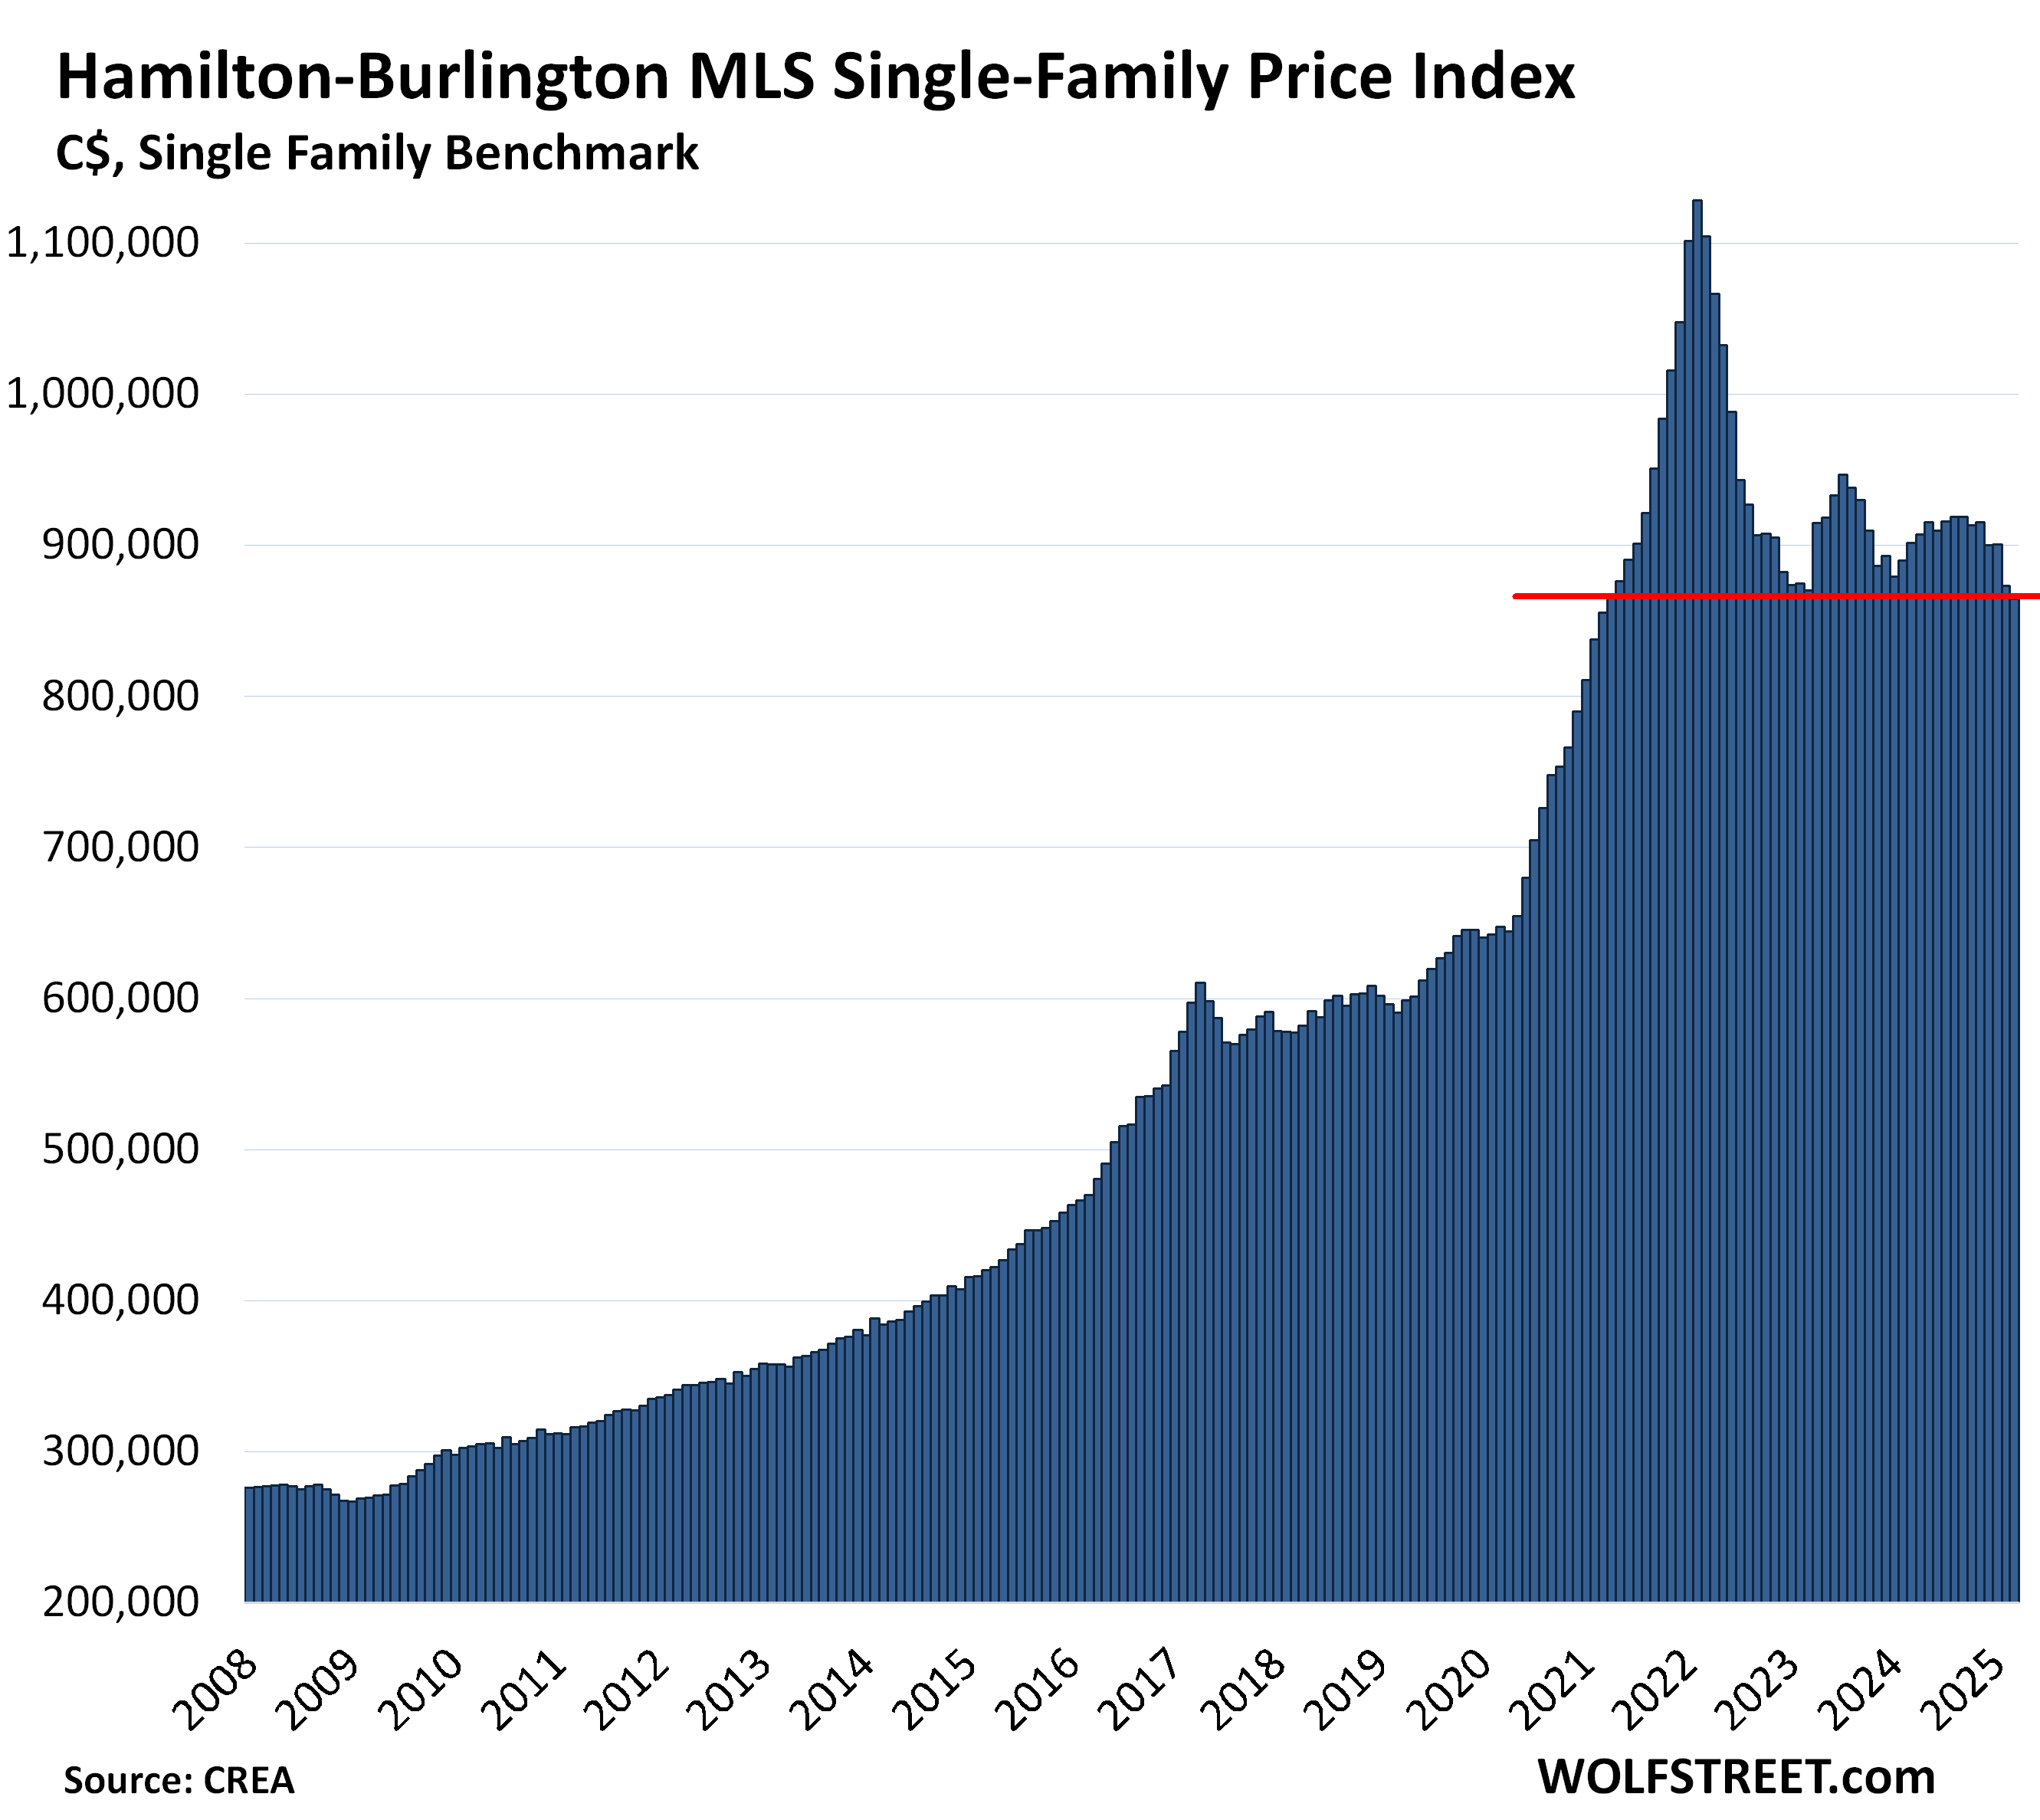
Hamilton-Burlington metro single family benchmark price (part of the “Greater Toronto and Hamilton Area”):
- Month-to-month: -1.0% to $864,700, lowest since March 2021
- From peak in February 2022: -23.4%
- Year-over-year: -4.1%.
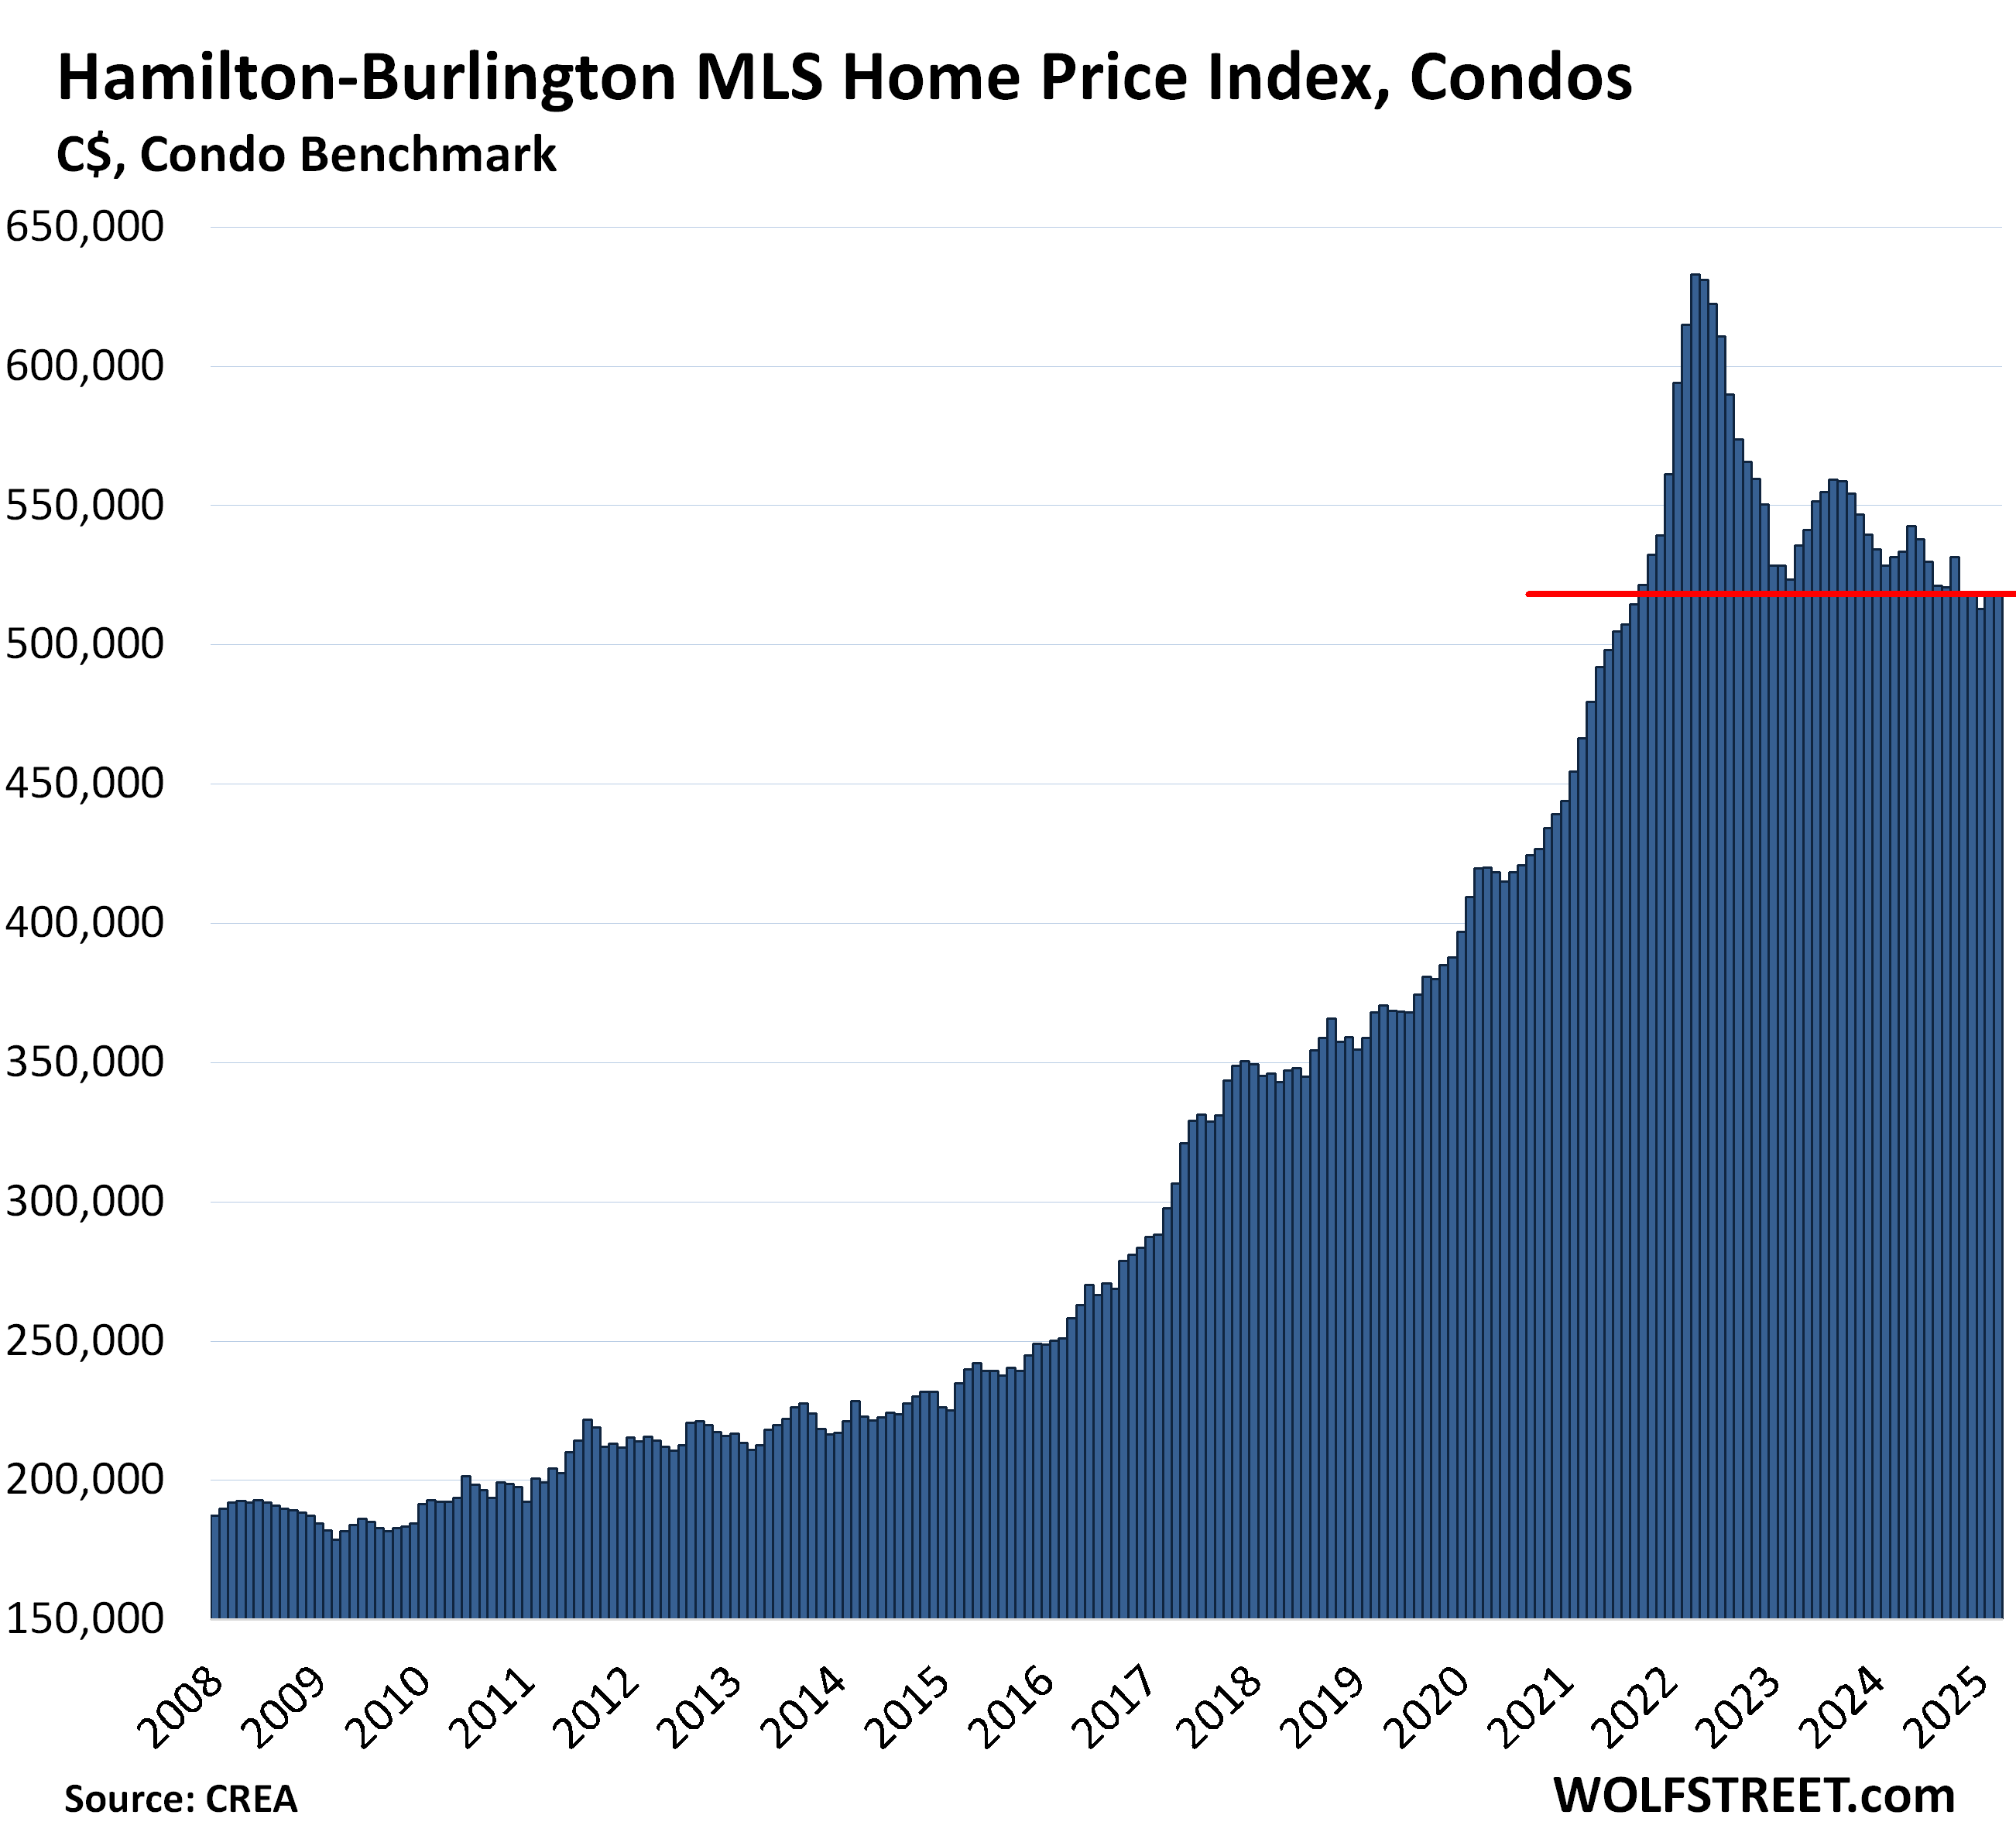
Hamilton-Burlington metro condo benchmark price:
- Month-to-month: -0.2% to $517,900, back where it had first been in September 2021.
- From peak in April 2022: -18.2%
- Year-over-year: -2.5%.
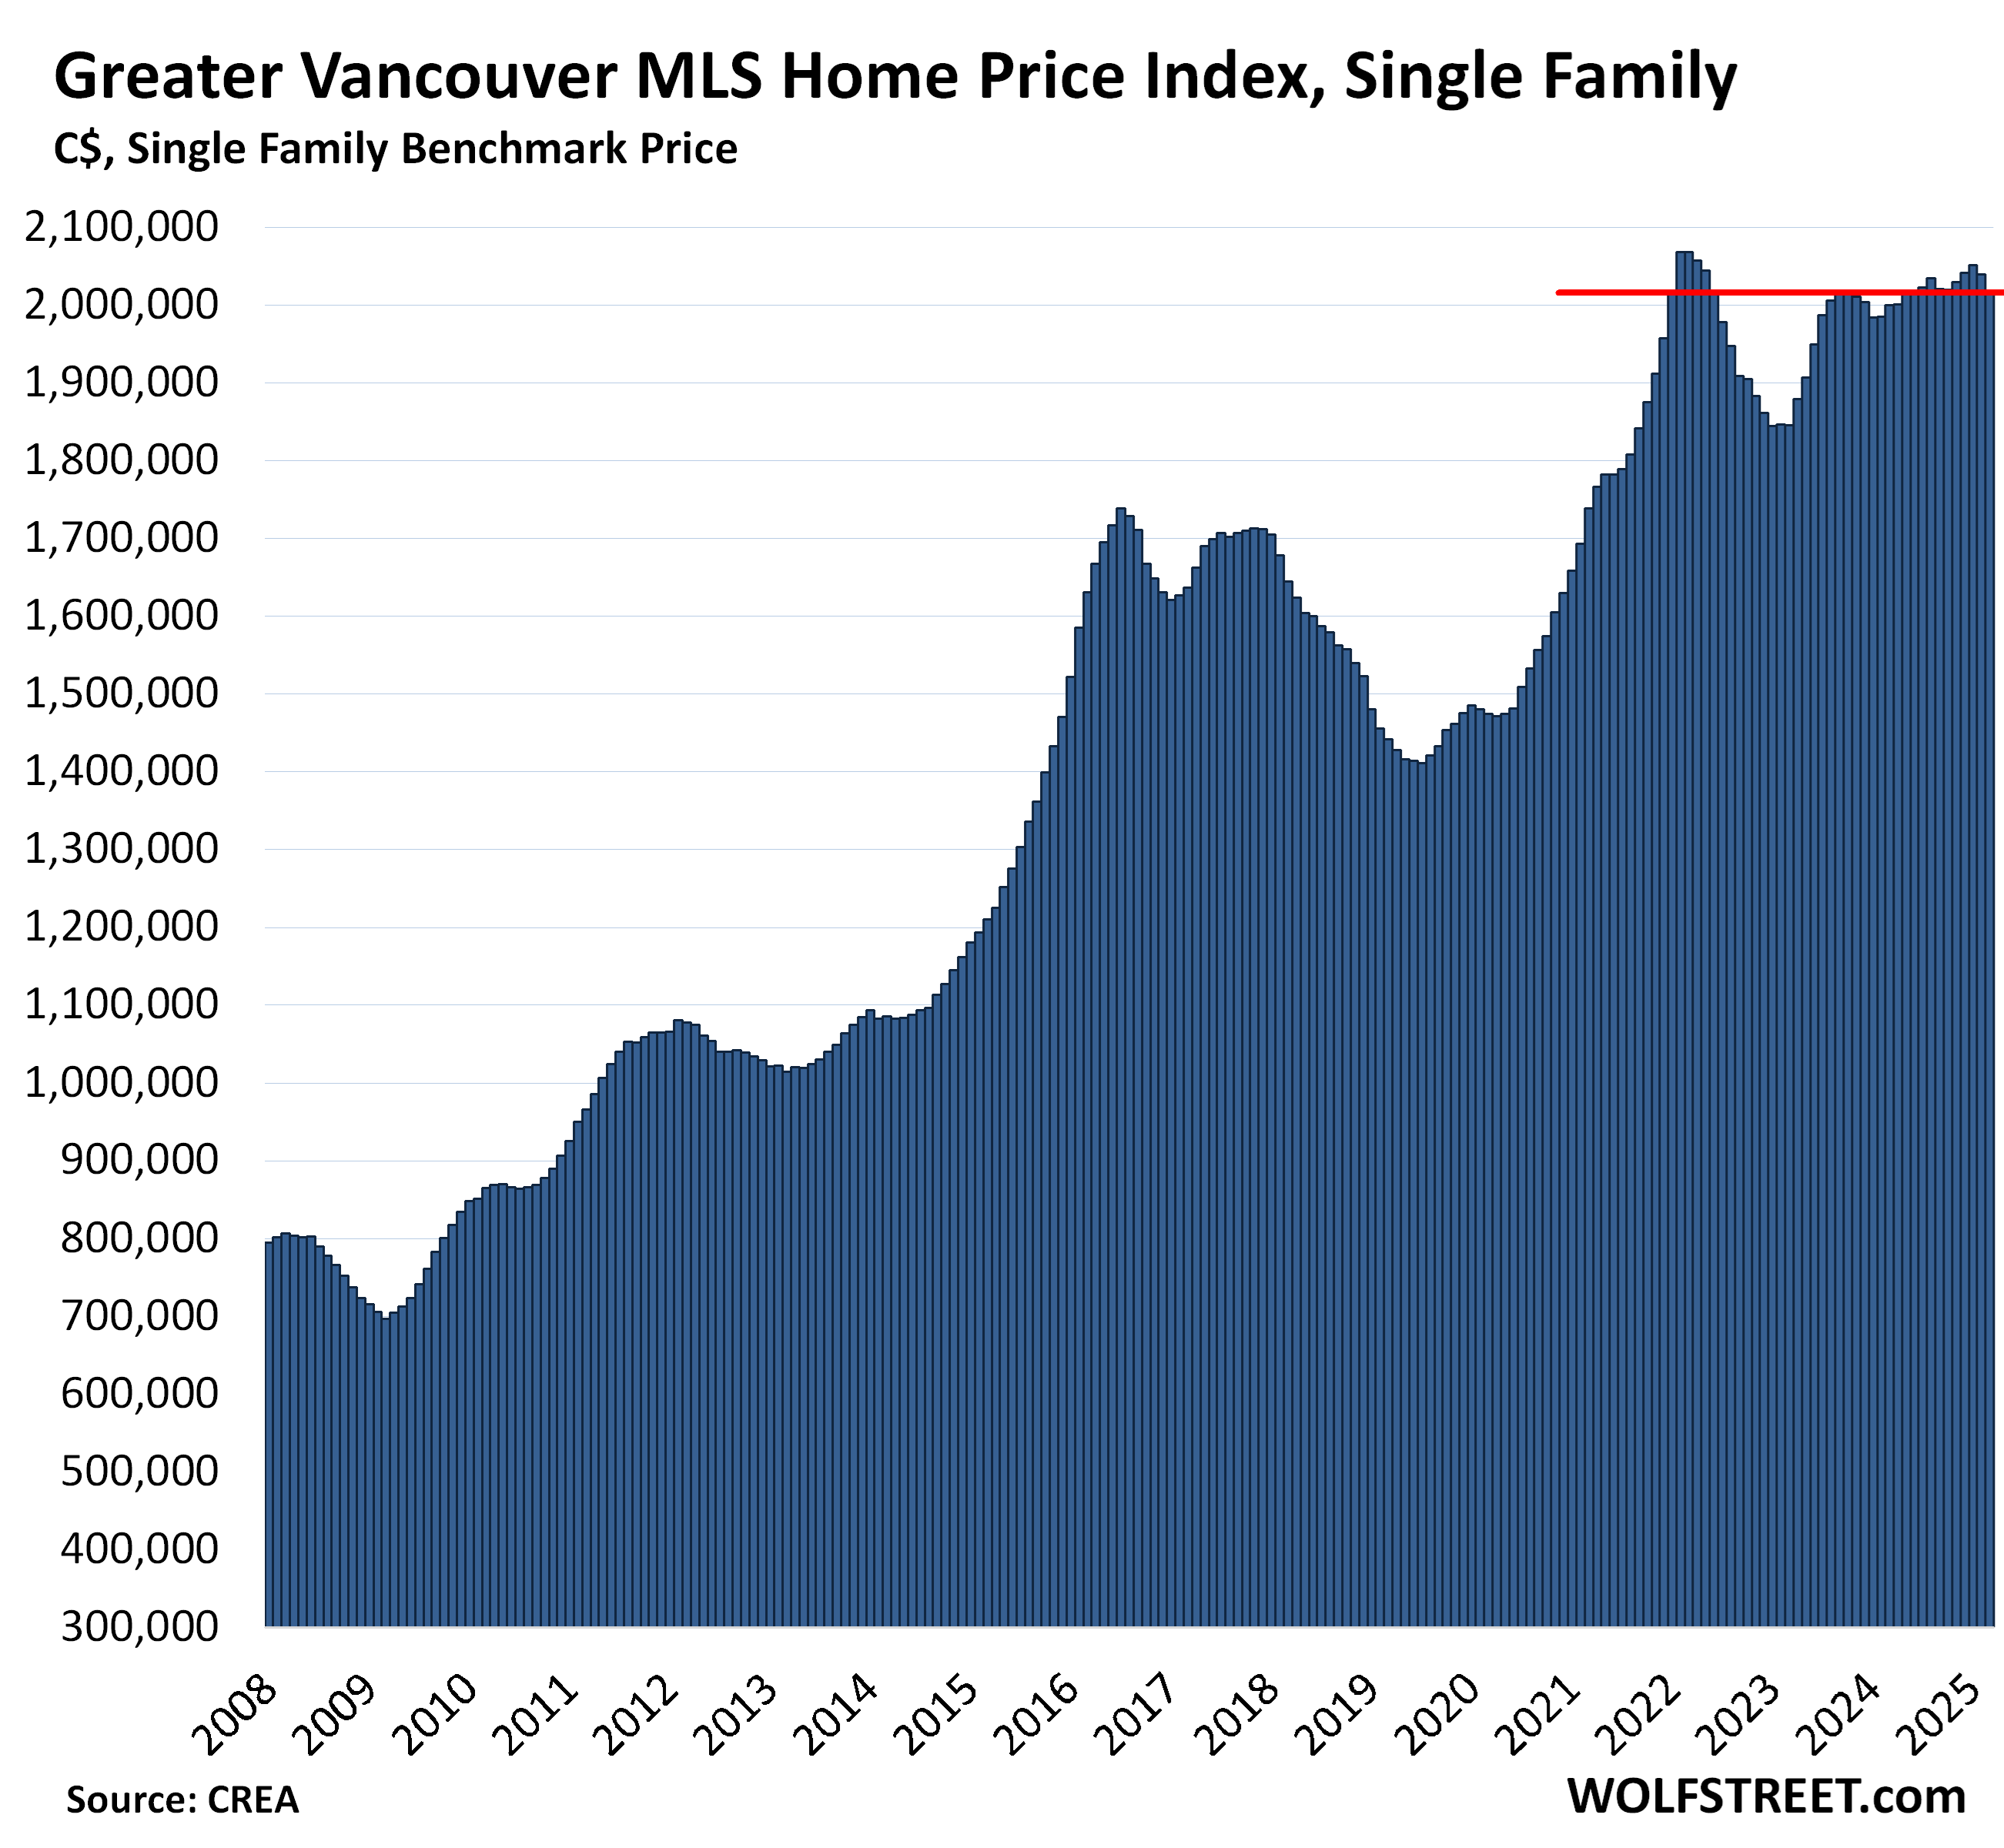
Greater Vancouver single-family benchmark price:
- Month-to-month: -1.2%, to $2,015,700, about where it had been in January 2022.
- From peak in March 2022: -2.5%
- Year-over-year: +0.8%.
Greater Vancouver condo benchmark price:
- Month-to-month: unchanged, at $761,400, where they’d first been in March 2022.
- From high in October 2023: -1.9%.
- Year-over-year: -0.6%, the 9th year-over-year decline in a row.
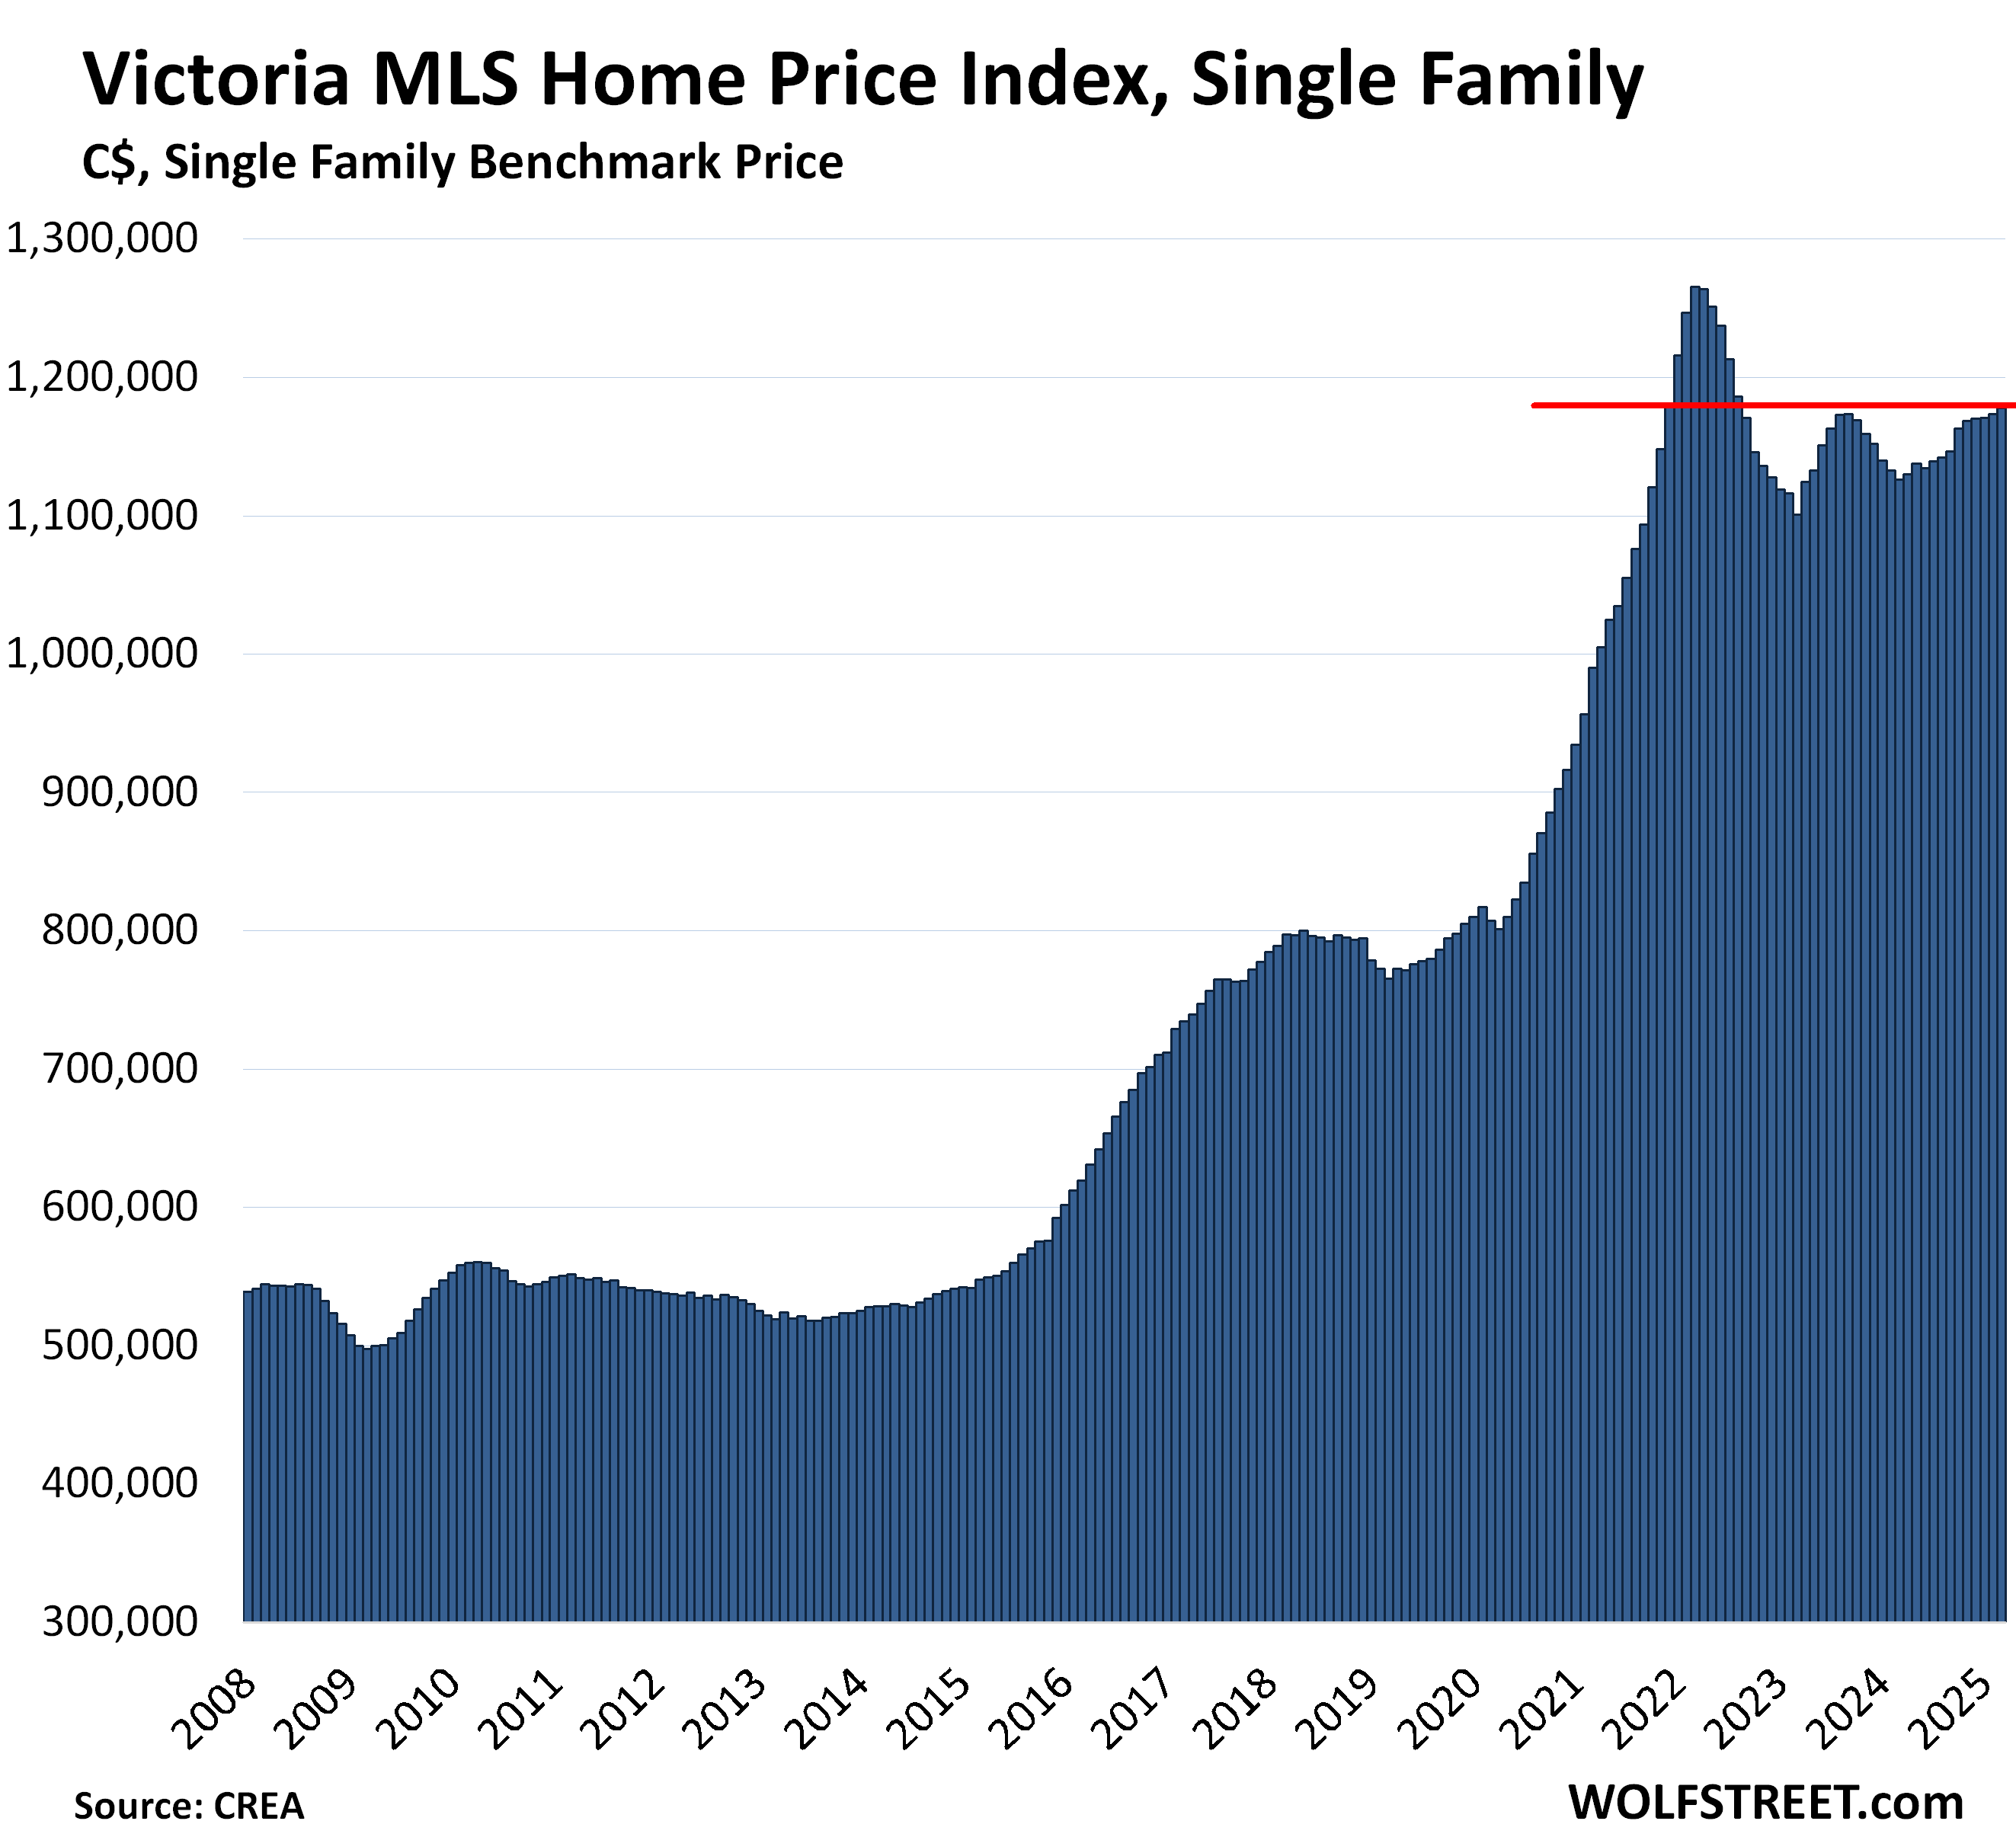
Victoria, single-family benchmark price:
- Month-to-month: +0.4% to $1,178,000, where it had first been in December 2021
- From peak in March 2022: -6.9%
- Year-over-year: +4.6%.
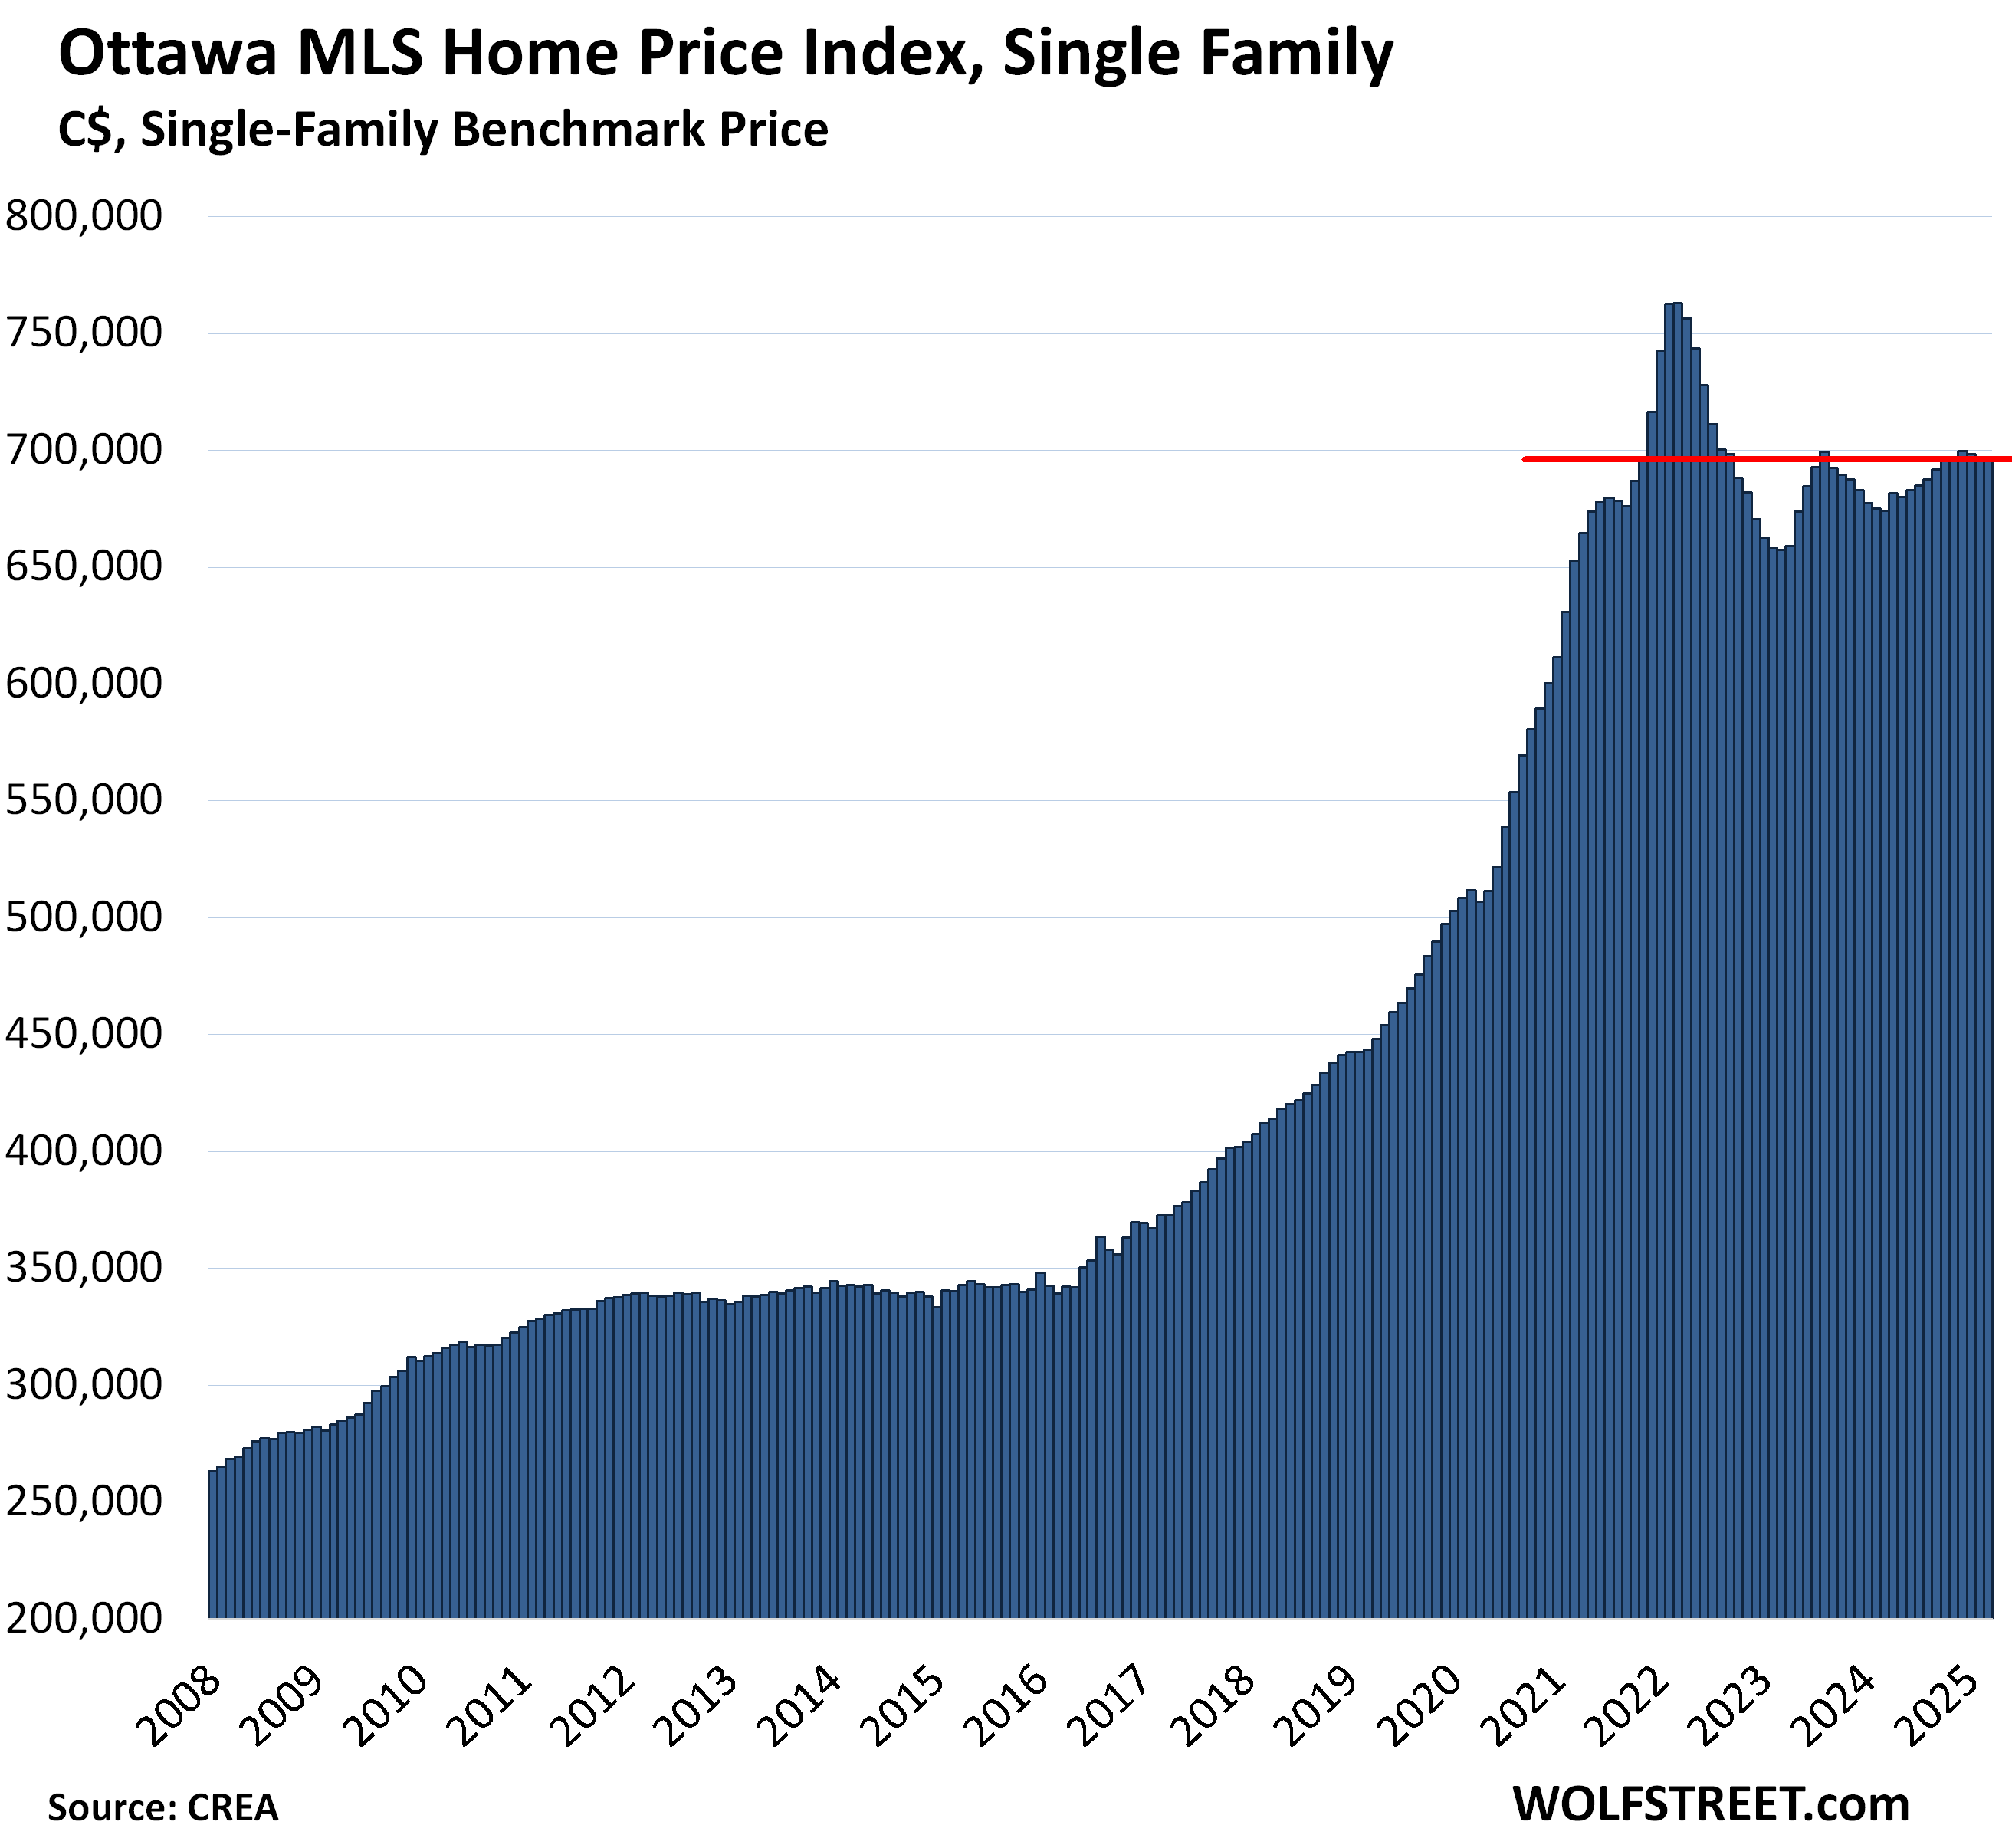
Ottawa, single family benchmark price:
- Month-to-month: +0.1% to $696,100 where it had first been in November 2021
- From peak in March 2022: -8.8%
- Year-over-year: +3.2%.
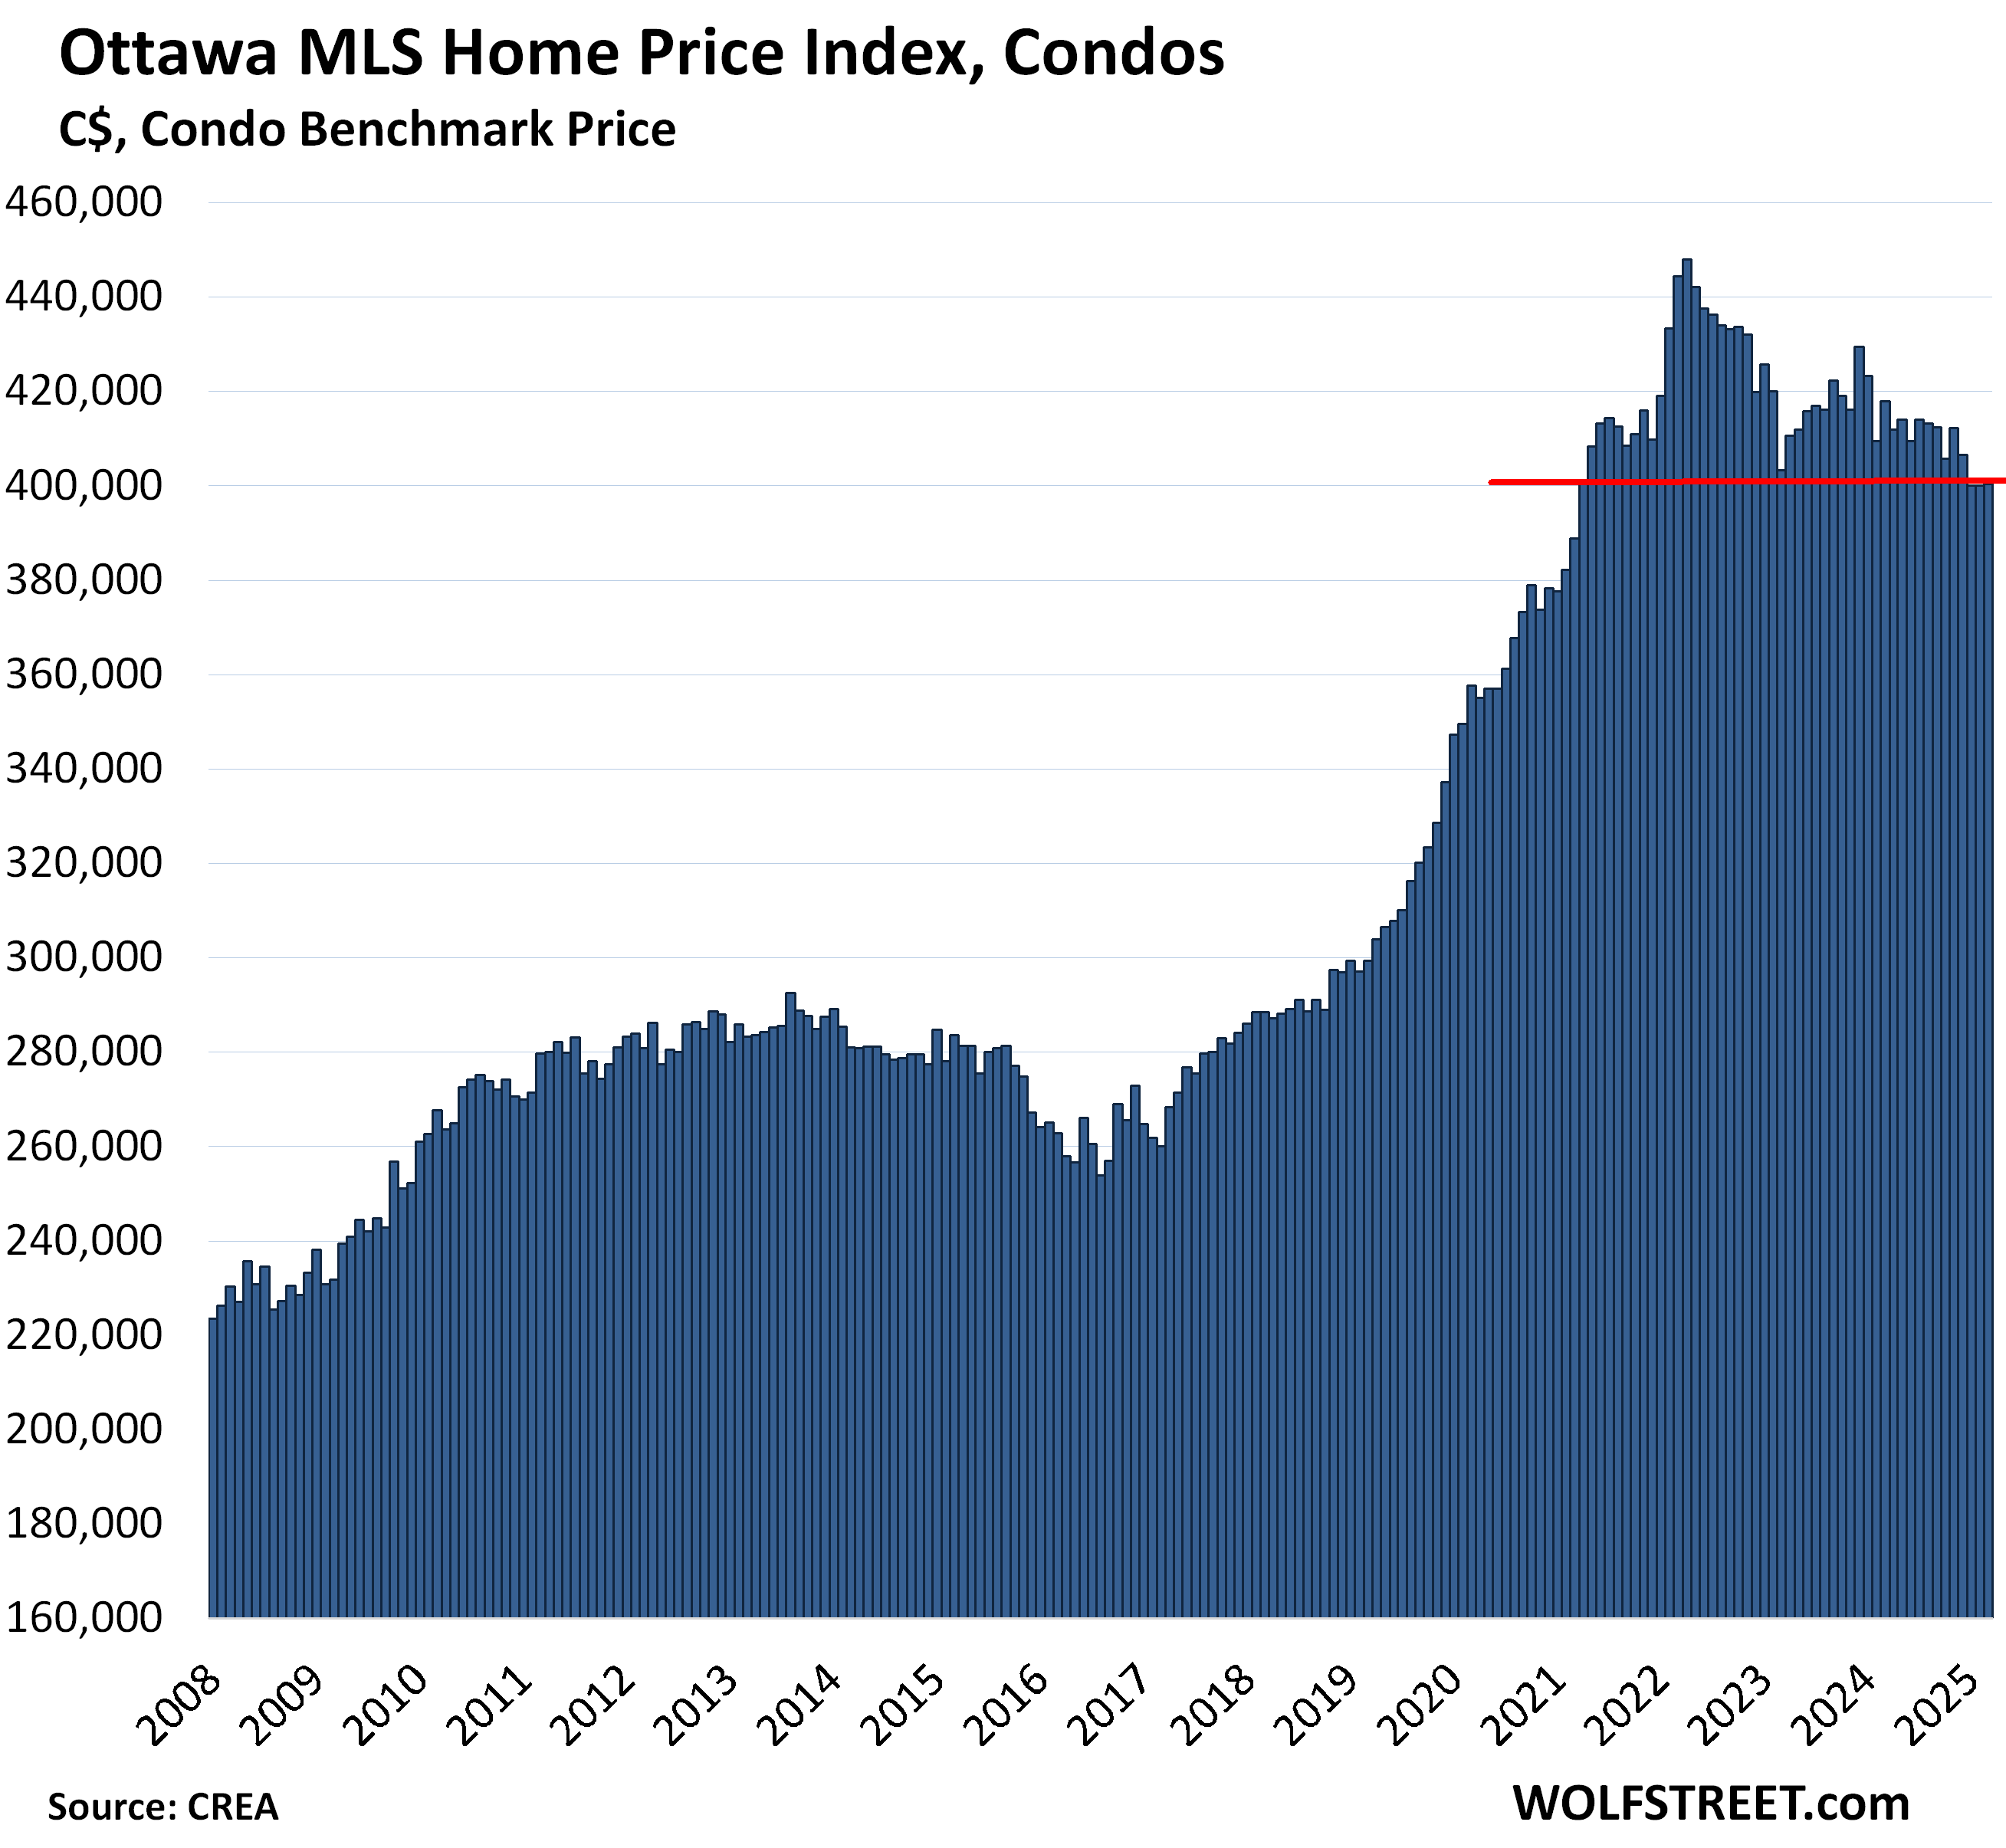
Ottawa, condo benchmark price:
- Month-to-month: unchanged at $400,300, lowest since April 2021
- From peak in March 2022: -10.6%
- Year-over-year: -4.2%.
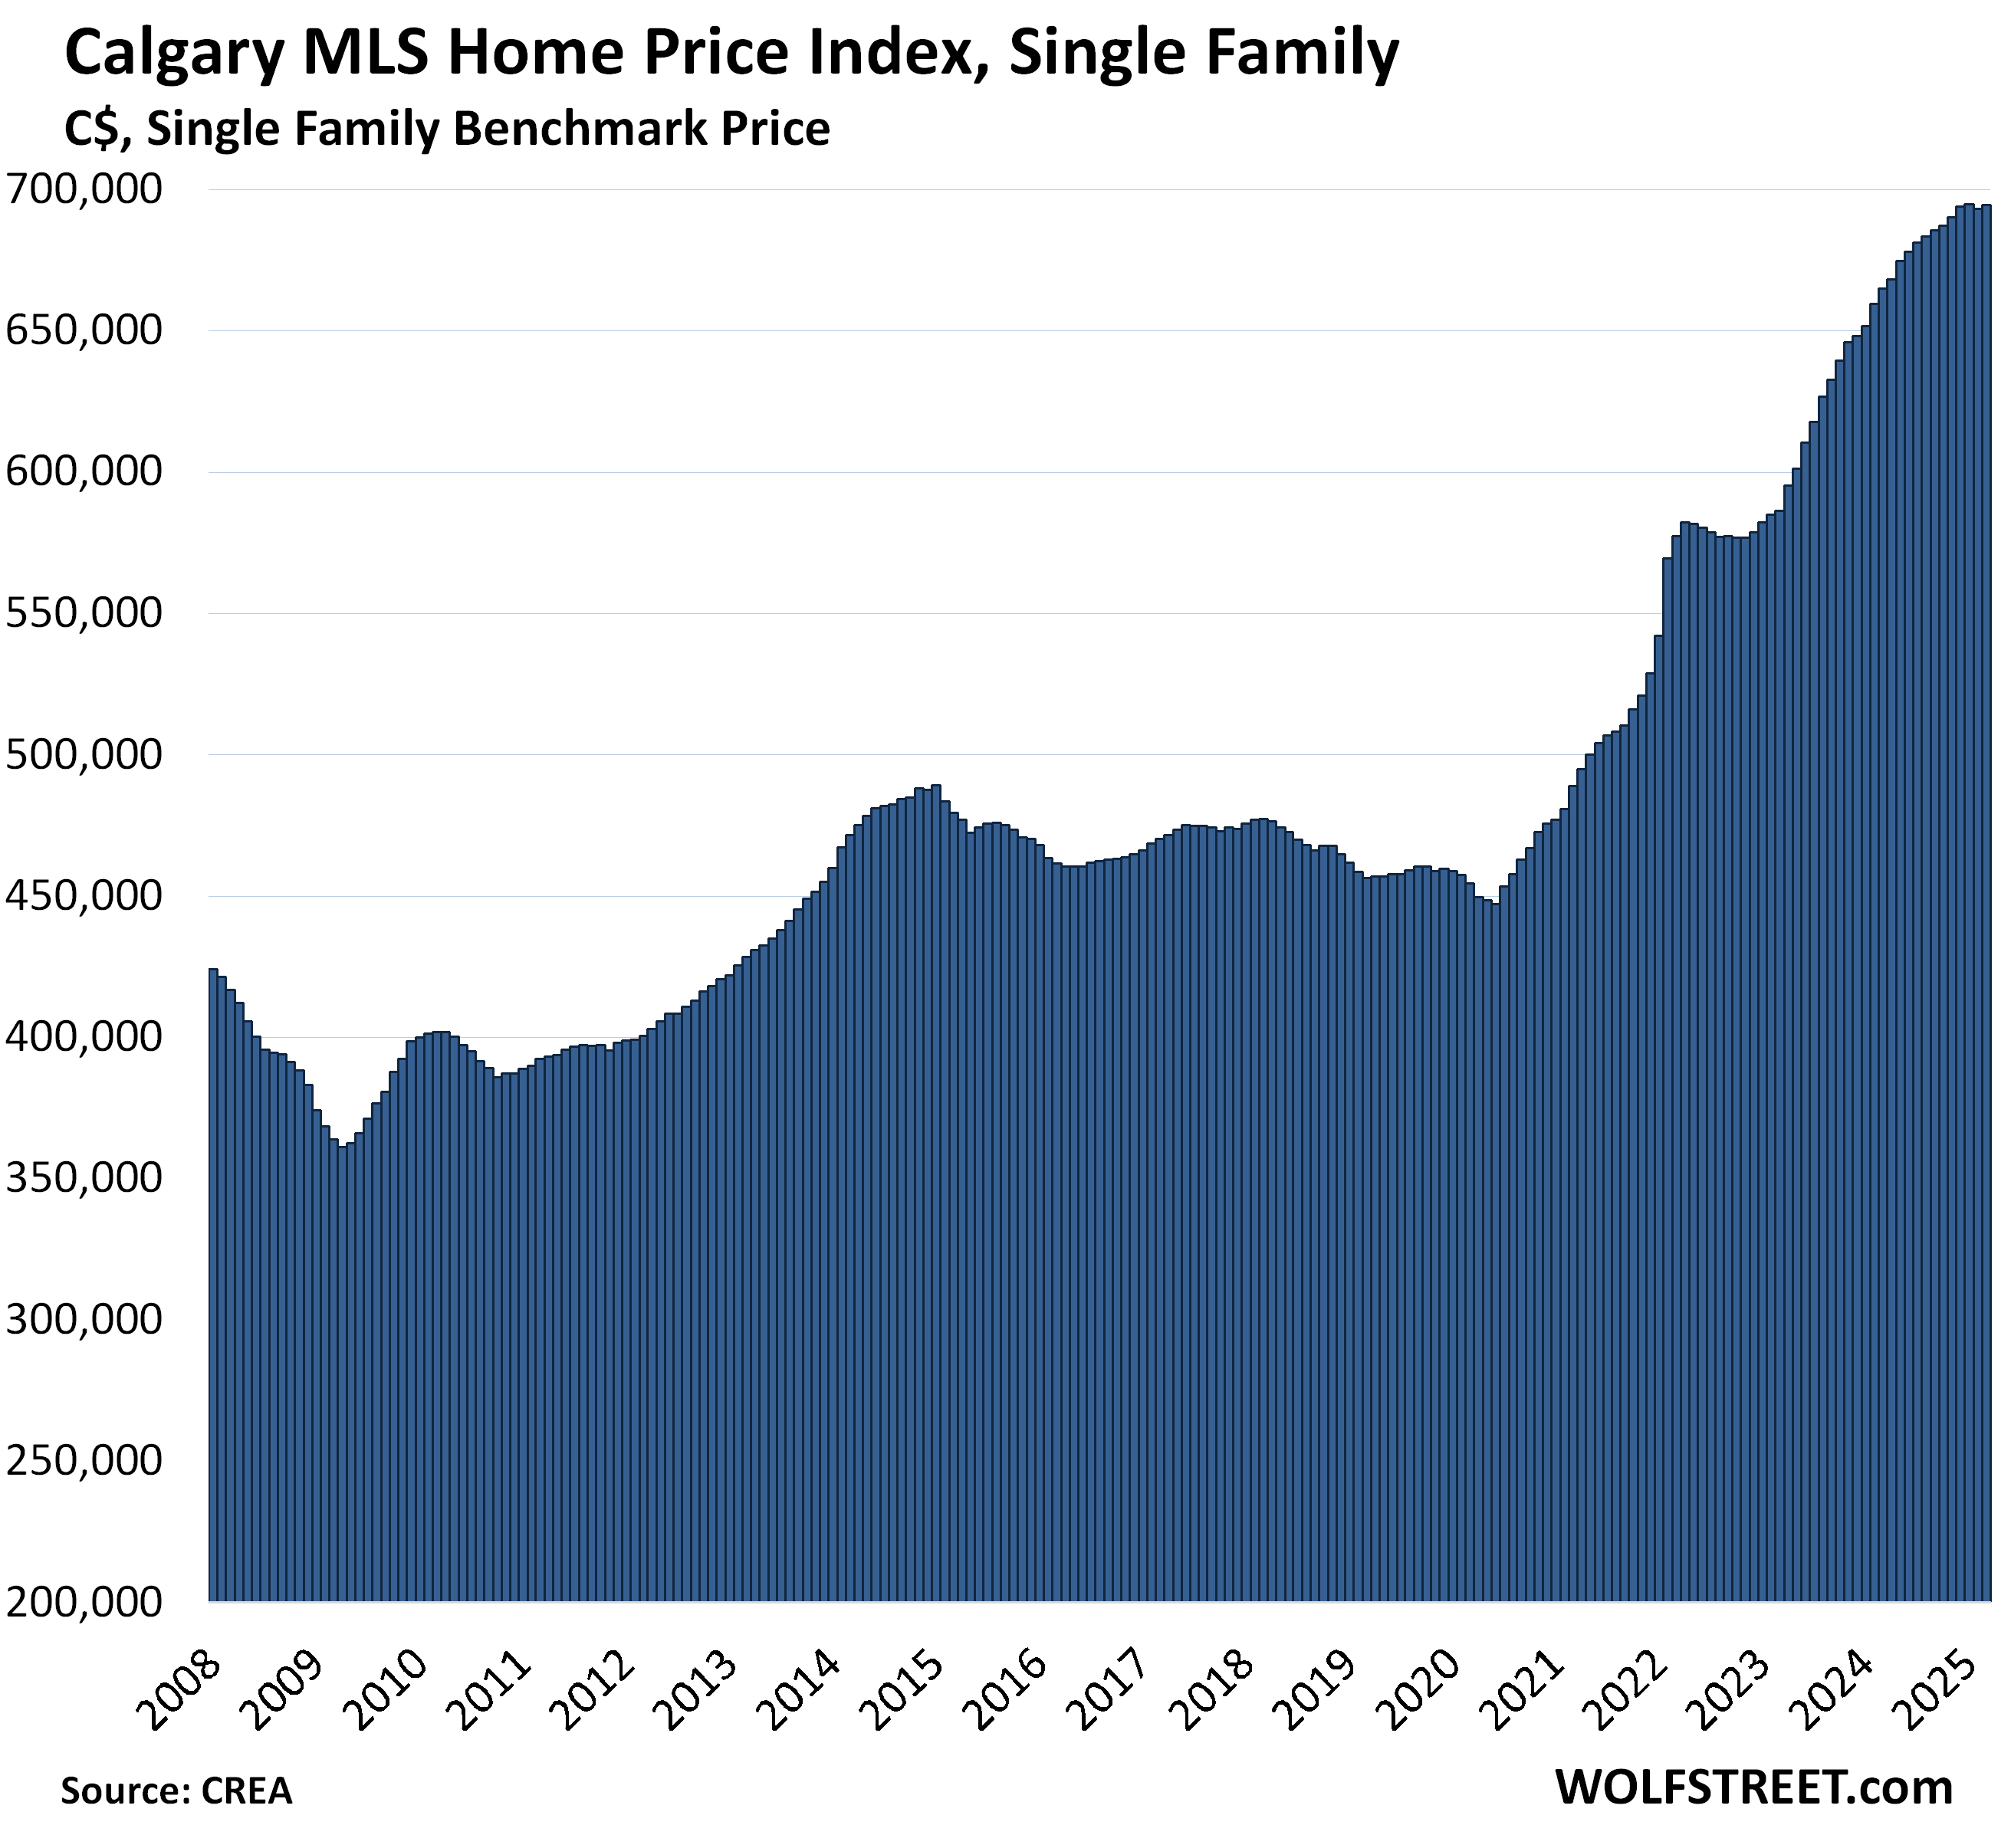
Calgary, single family benchmark price:
- Month-to-month: +0.2%, to $694,600, roughly unchanged from December and January, after a relentless two-year spike.
- Year-over-year: +4.5%, smallest increase since June 2023.
Calgary, condo benchmark price:
- Month-to-month: -0.5%, to $341,900, the 6th month in a row of declines after the spike.
- From peak in August 2024: -2.4%
- Year-over-year: +2.4%, the lowest year-over-year gain since March 2021.
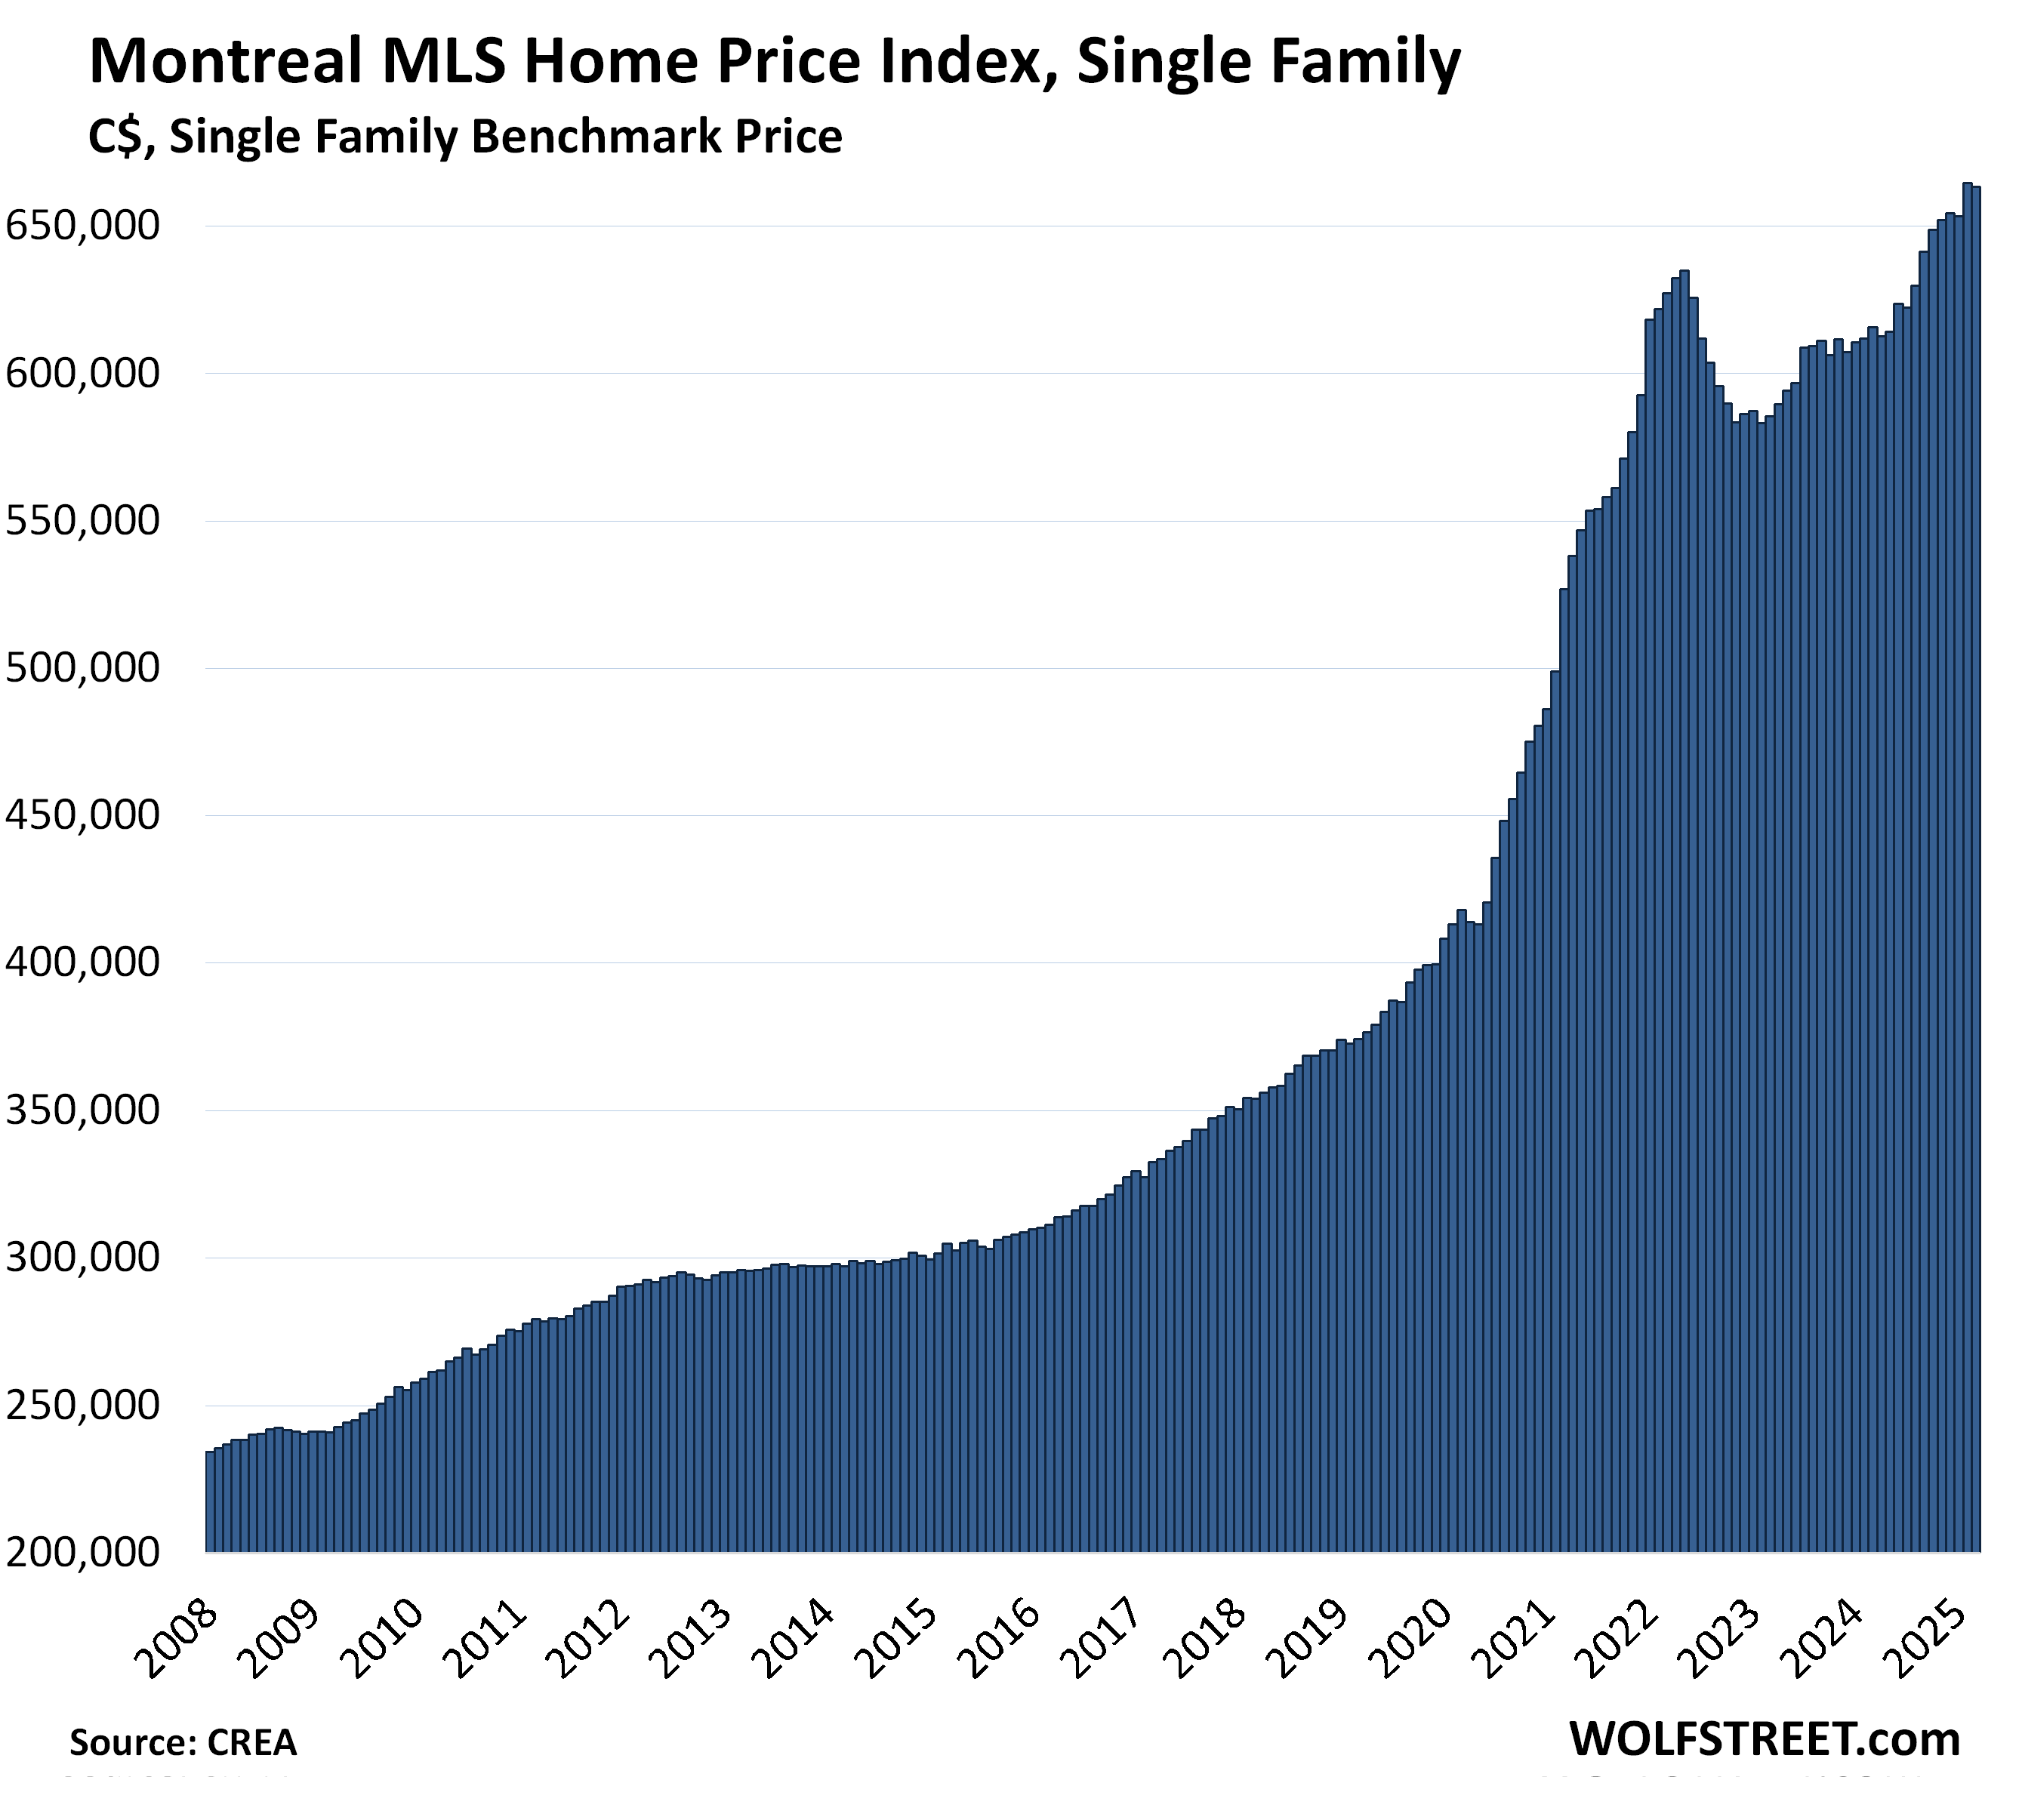
Montreal, single family benchmark price:
- Month-to-month: -0.2%, to $663,200.
- Year-over-year: +7.7%.
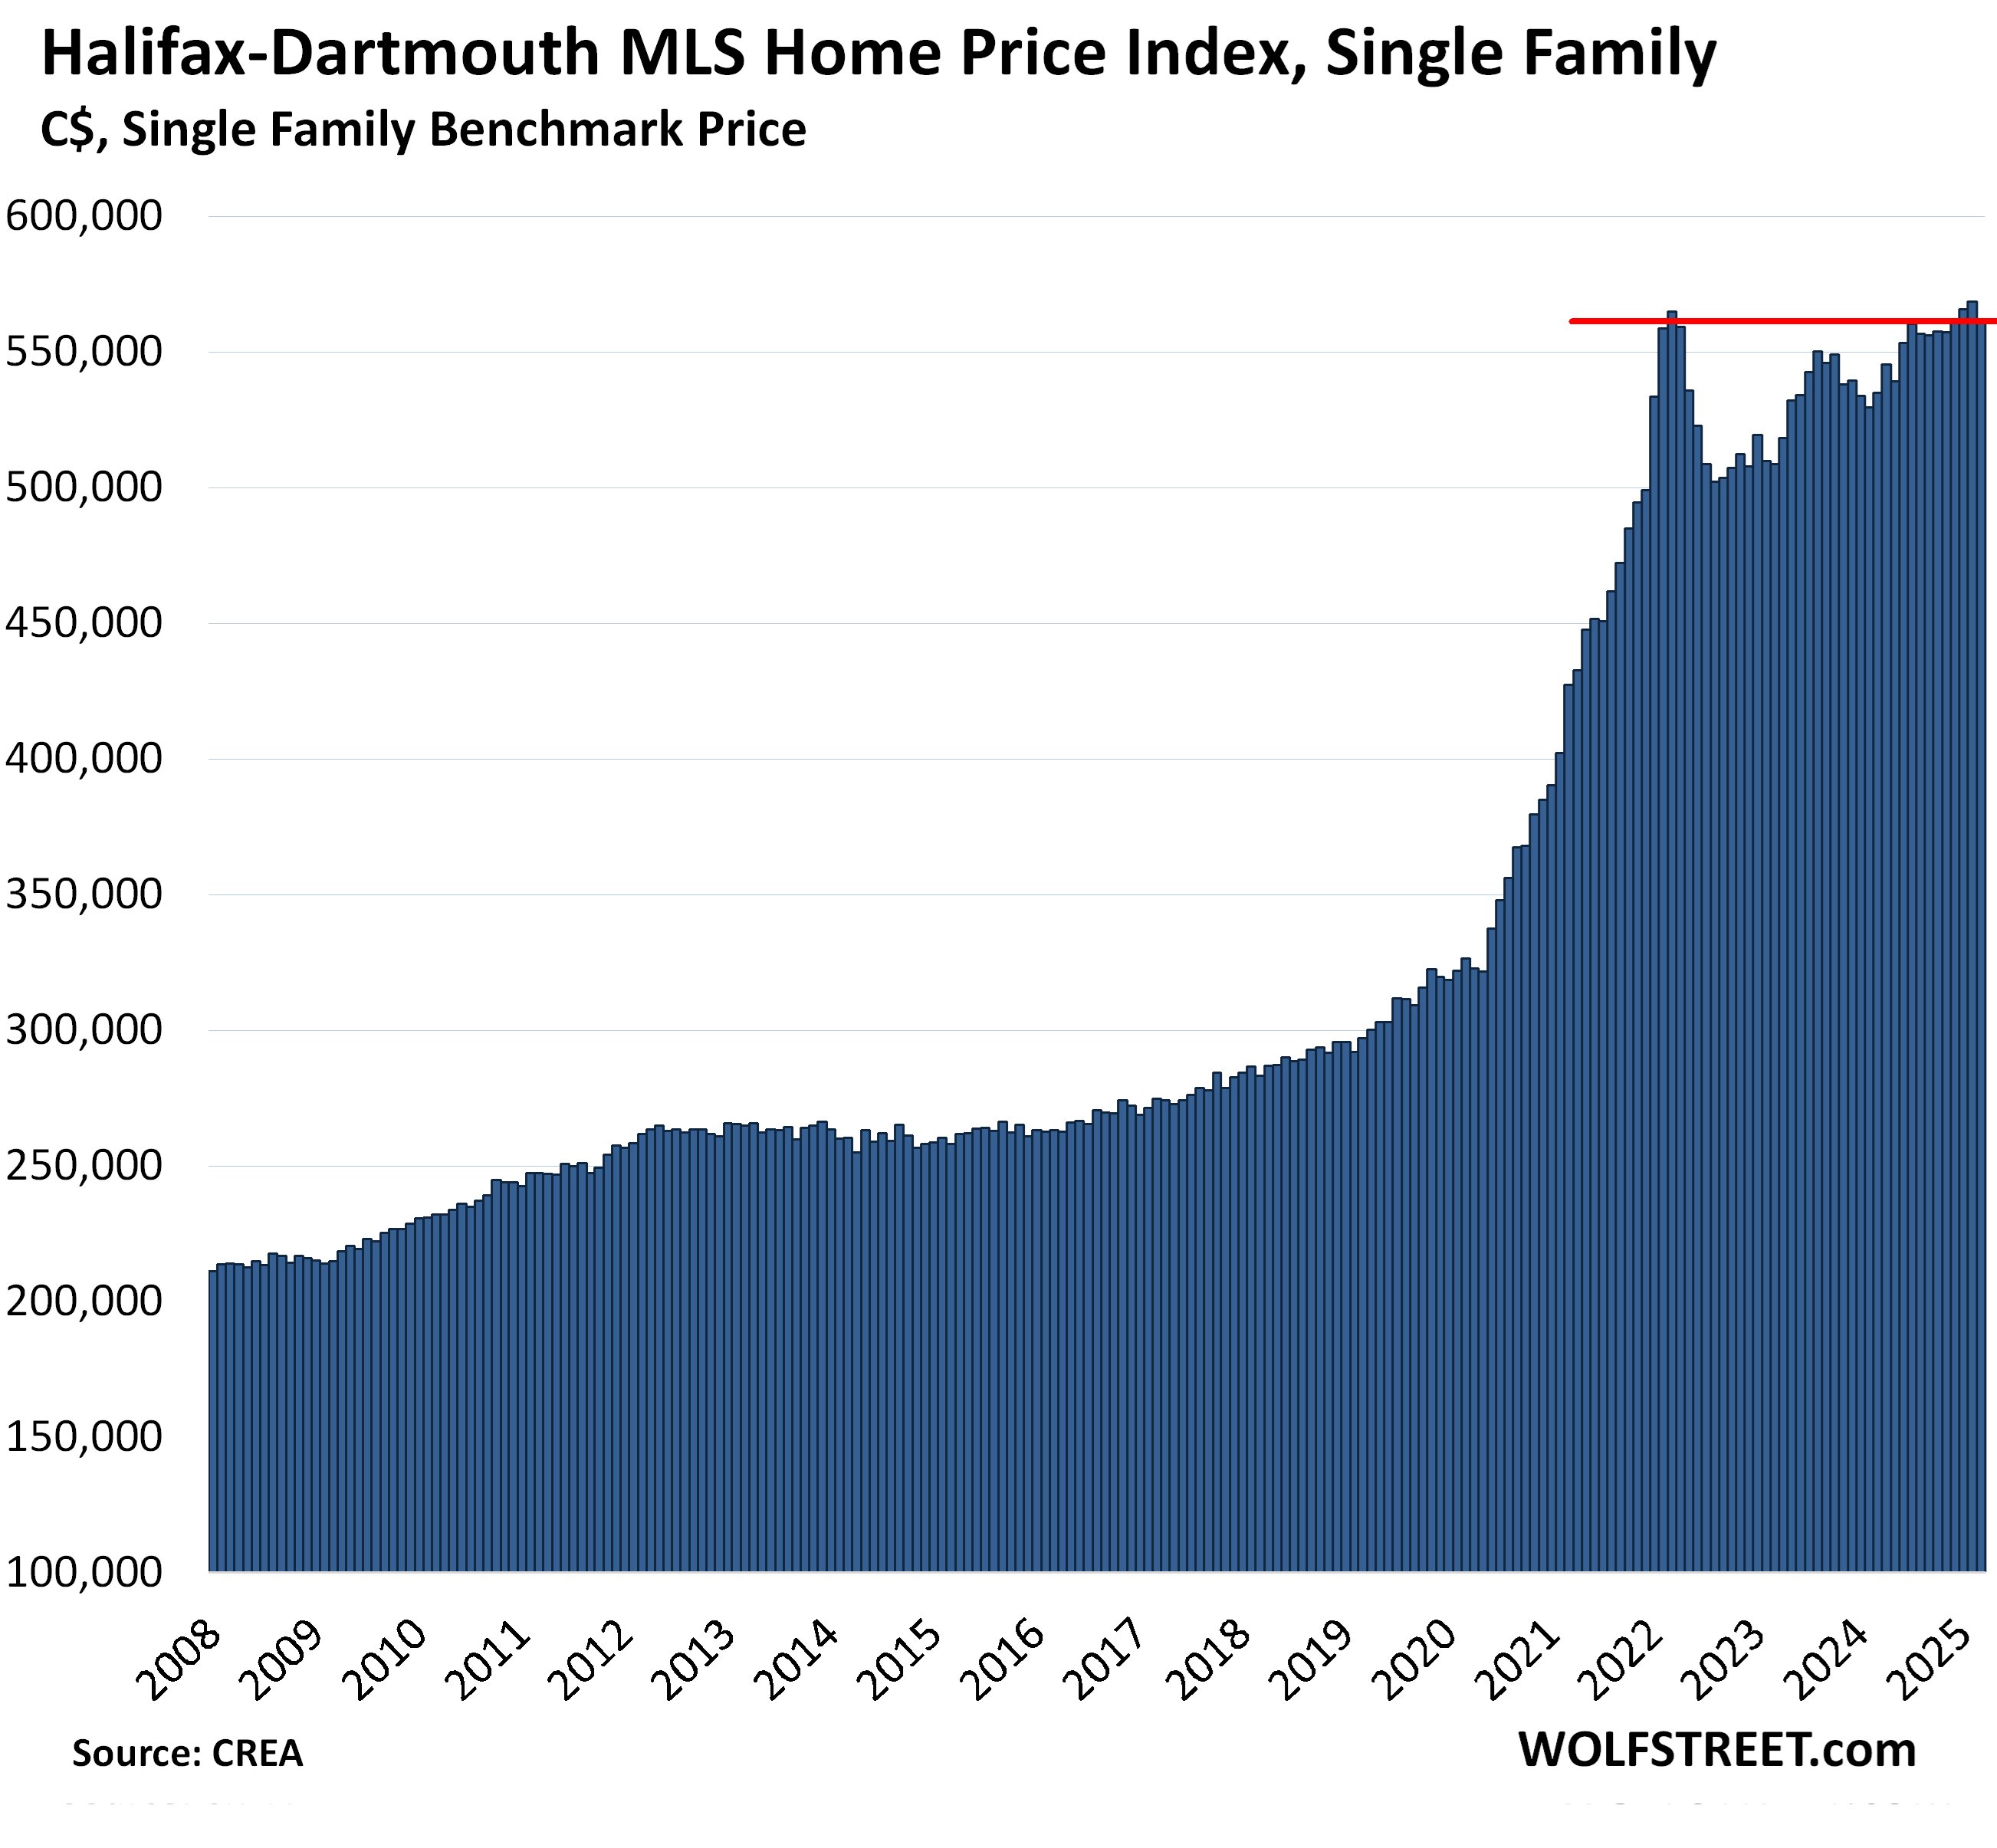
Halifax-Dartmouth, single family benchmark price:
- Month-to-month: -1.3% to $561,200
- From peak in March 2022: -0.7%
- Year-over-year: +4.9%.
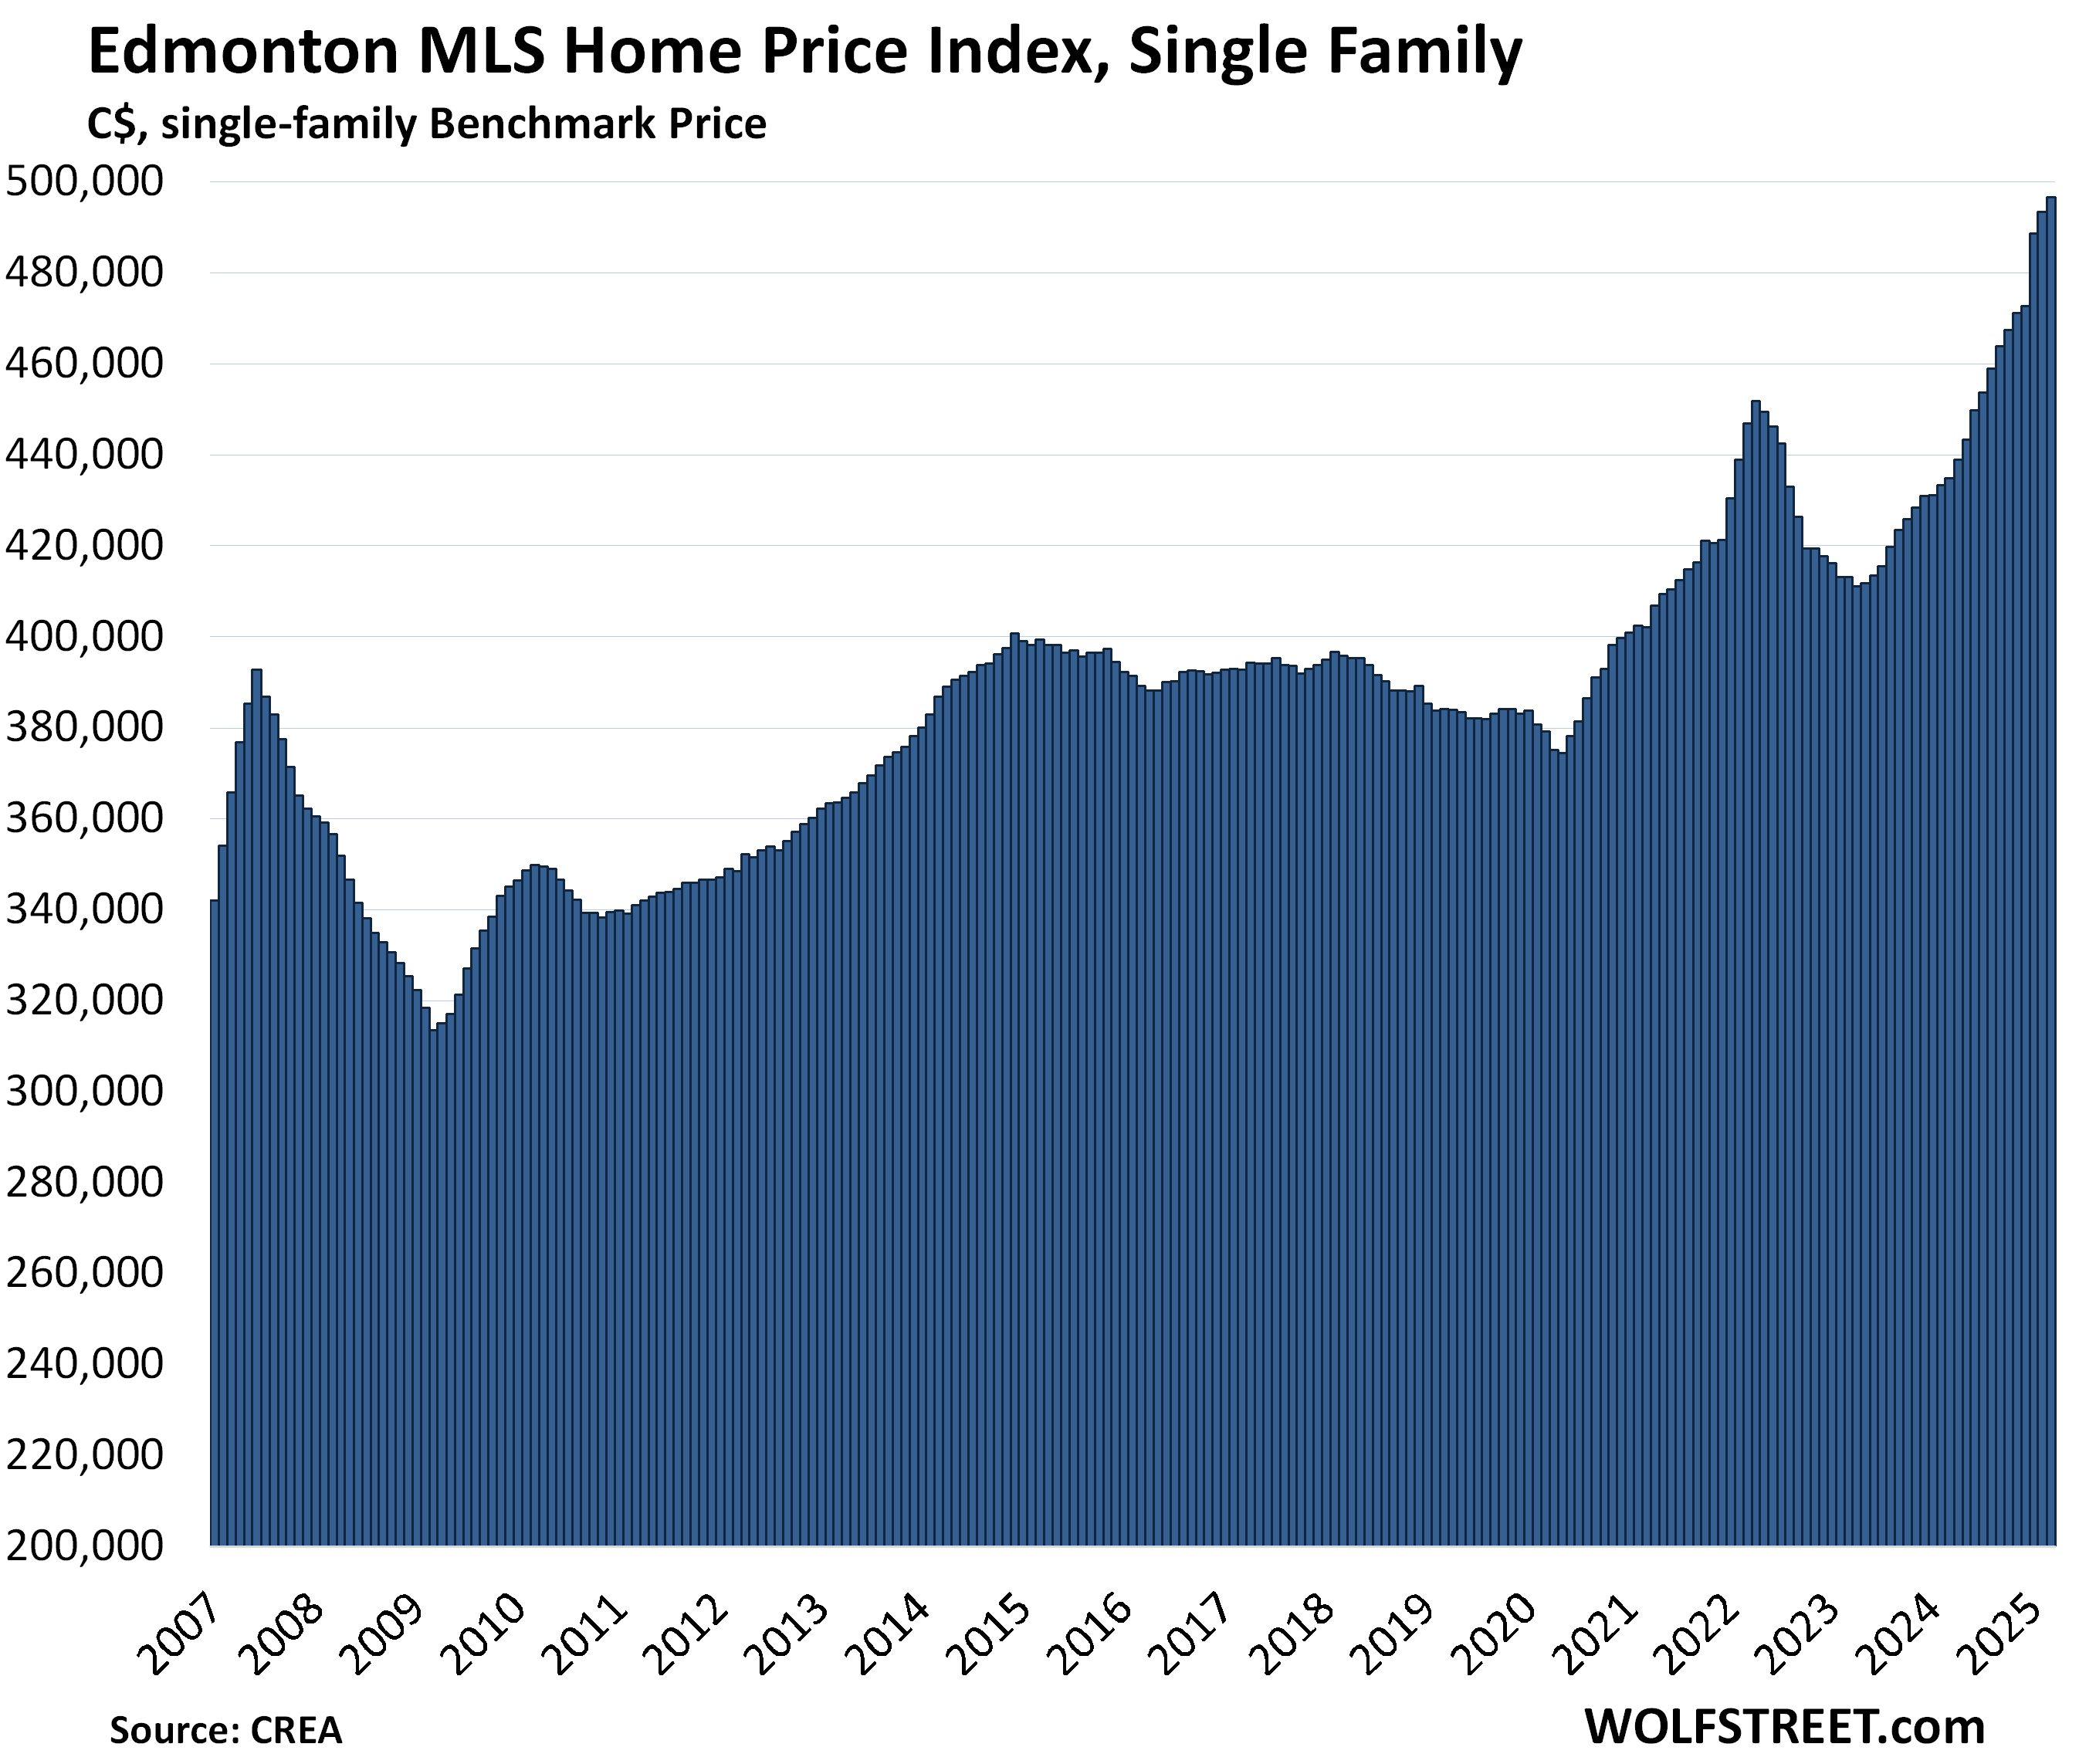
Edmonton, single-family benchmark price:
- Month-to-month: +0.6% to $496,600.
- Year-over-year: +14.2%
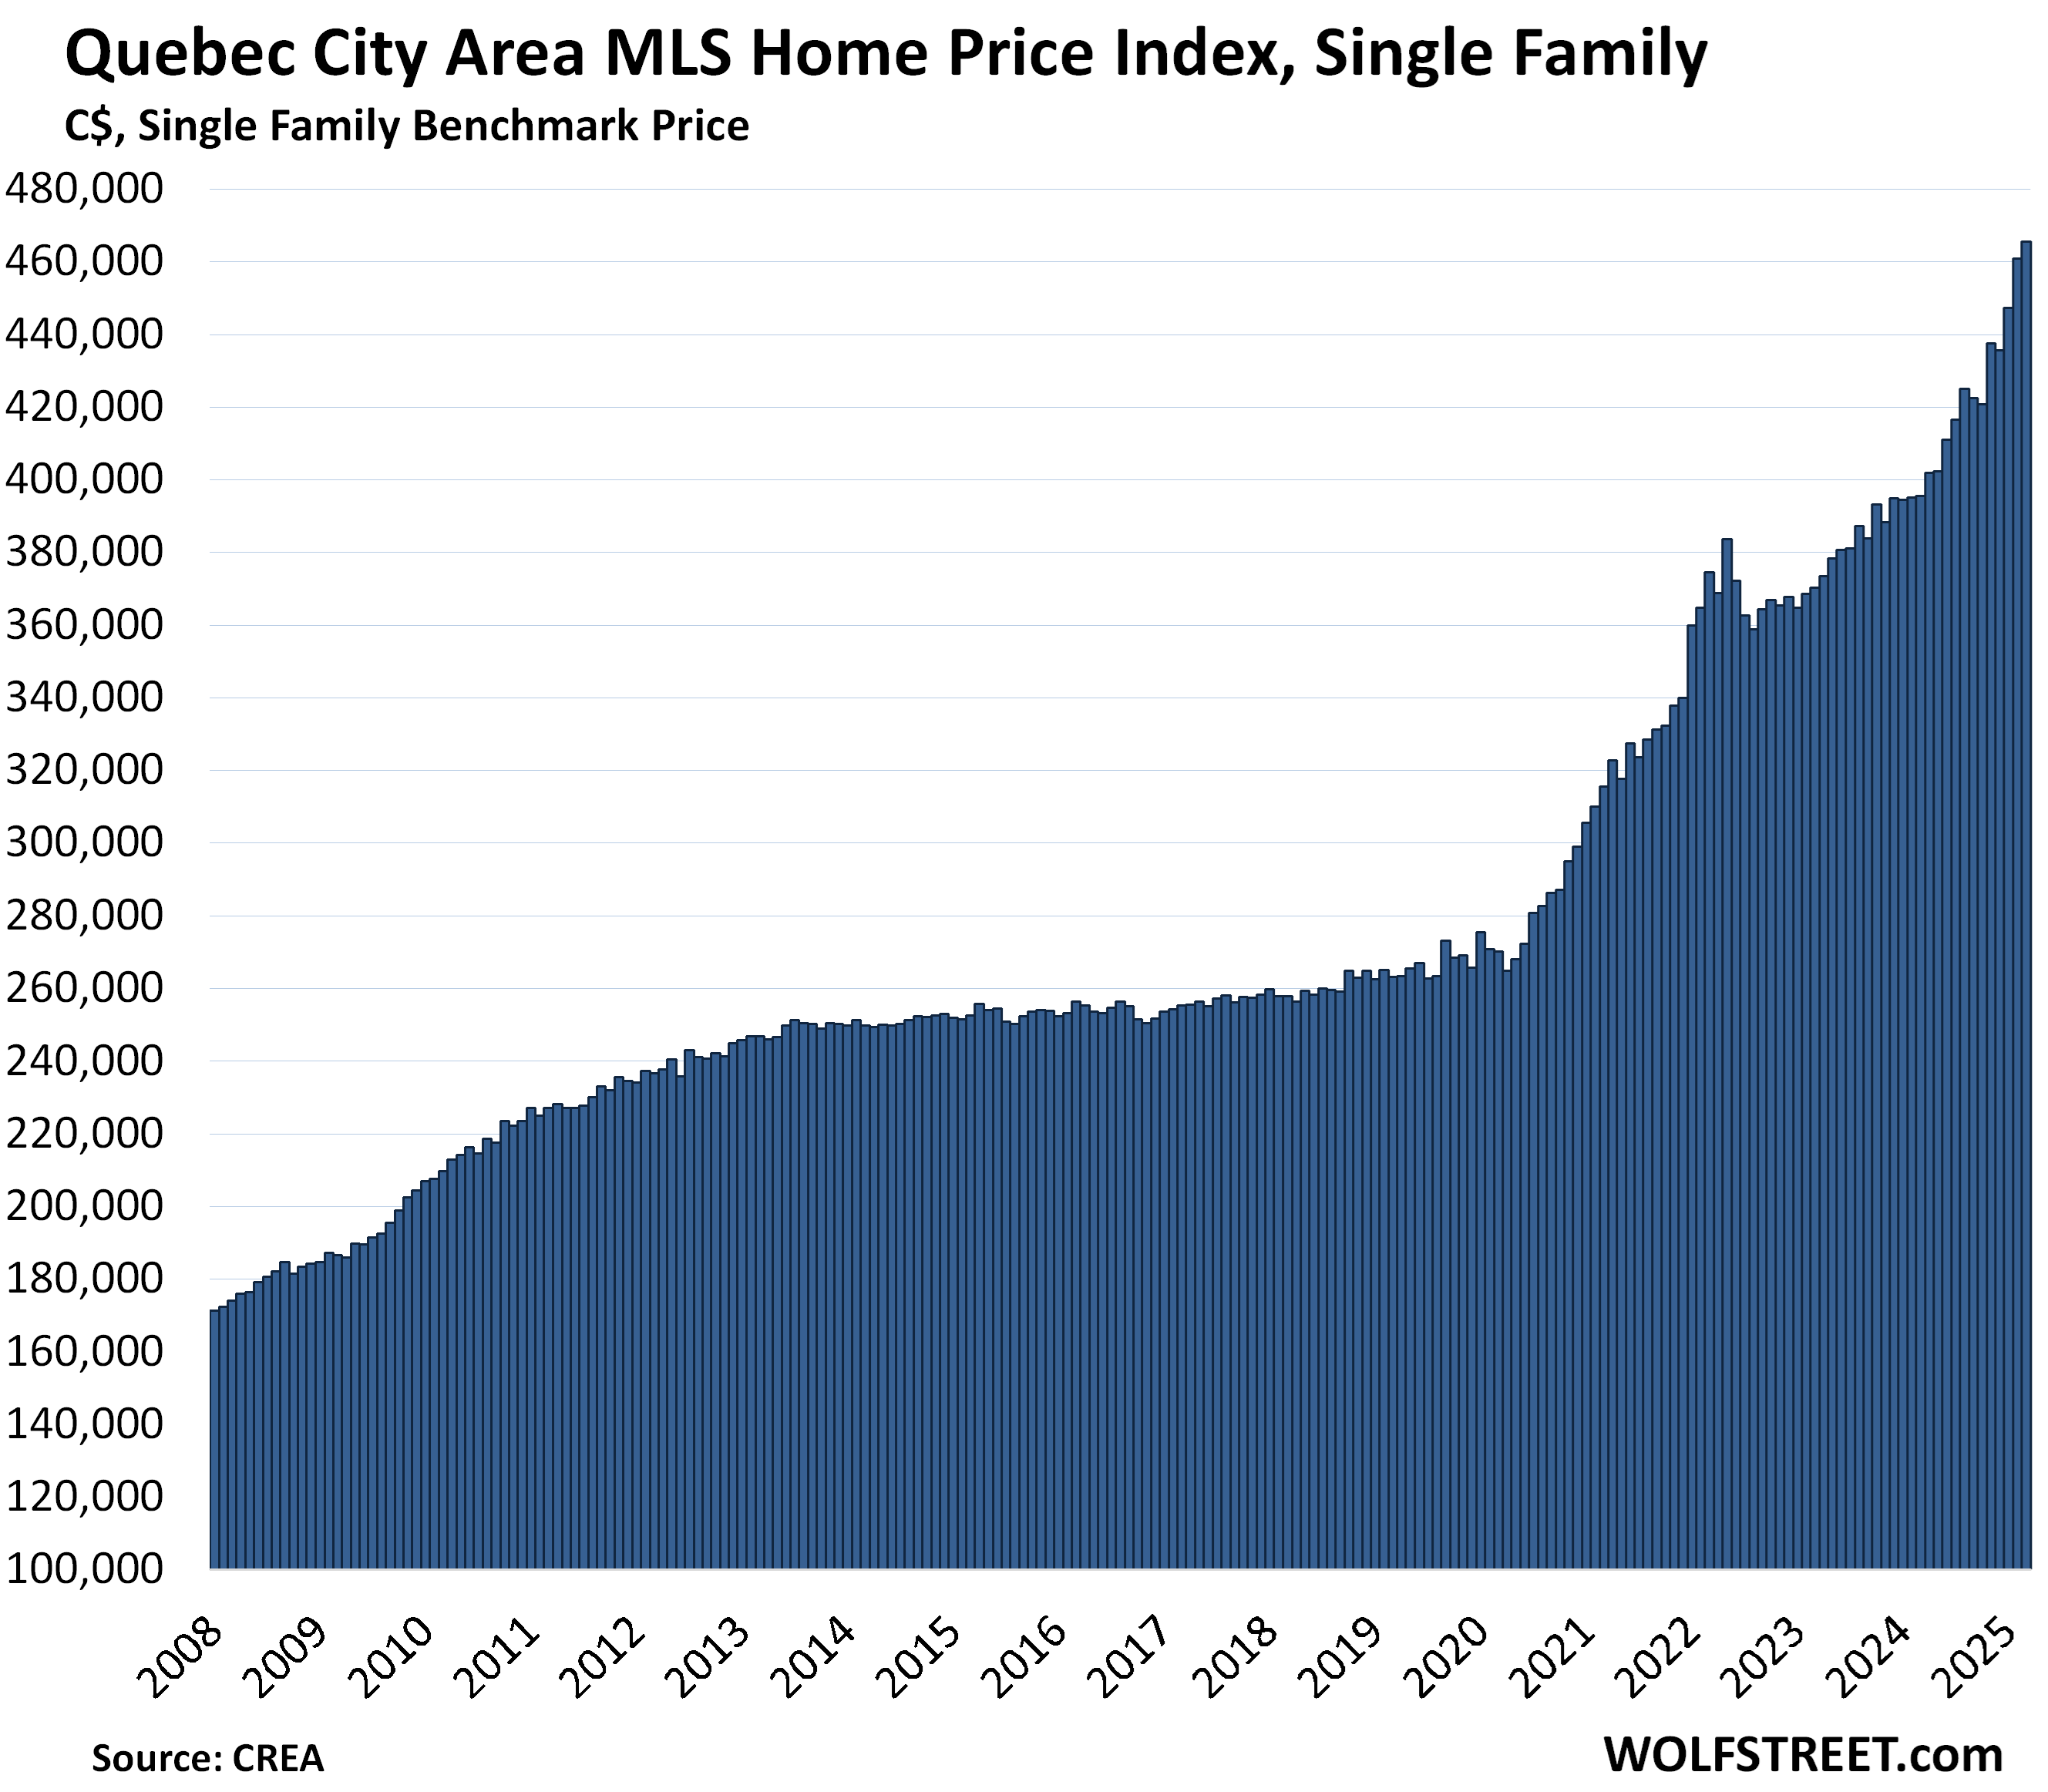
Quebec City Area, single-family benchmark price:
- Month-to-month: +1.0%, to $465,600
- Year-over-year: +17.7%
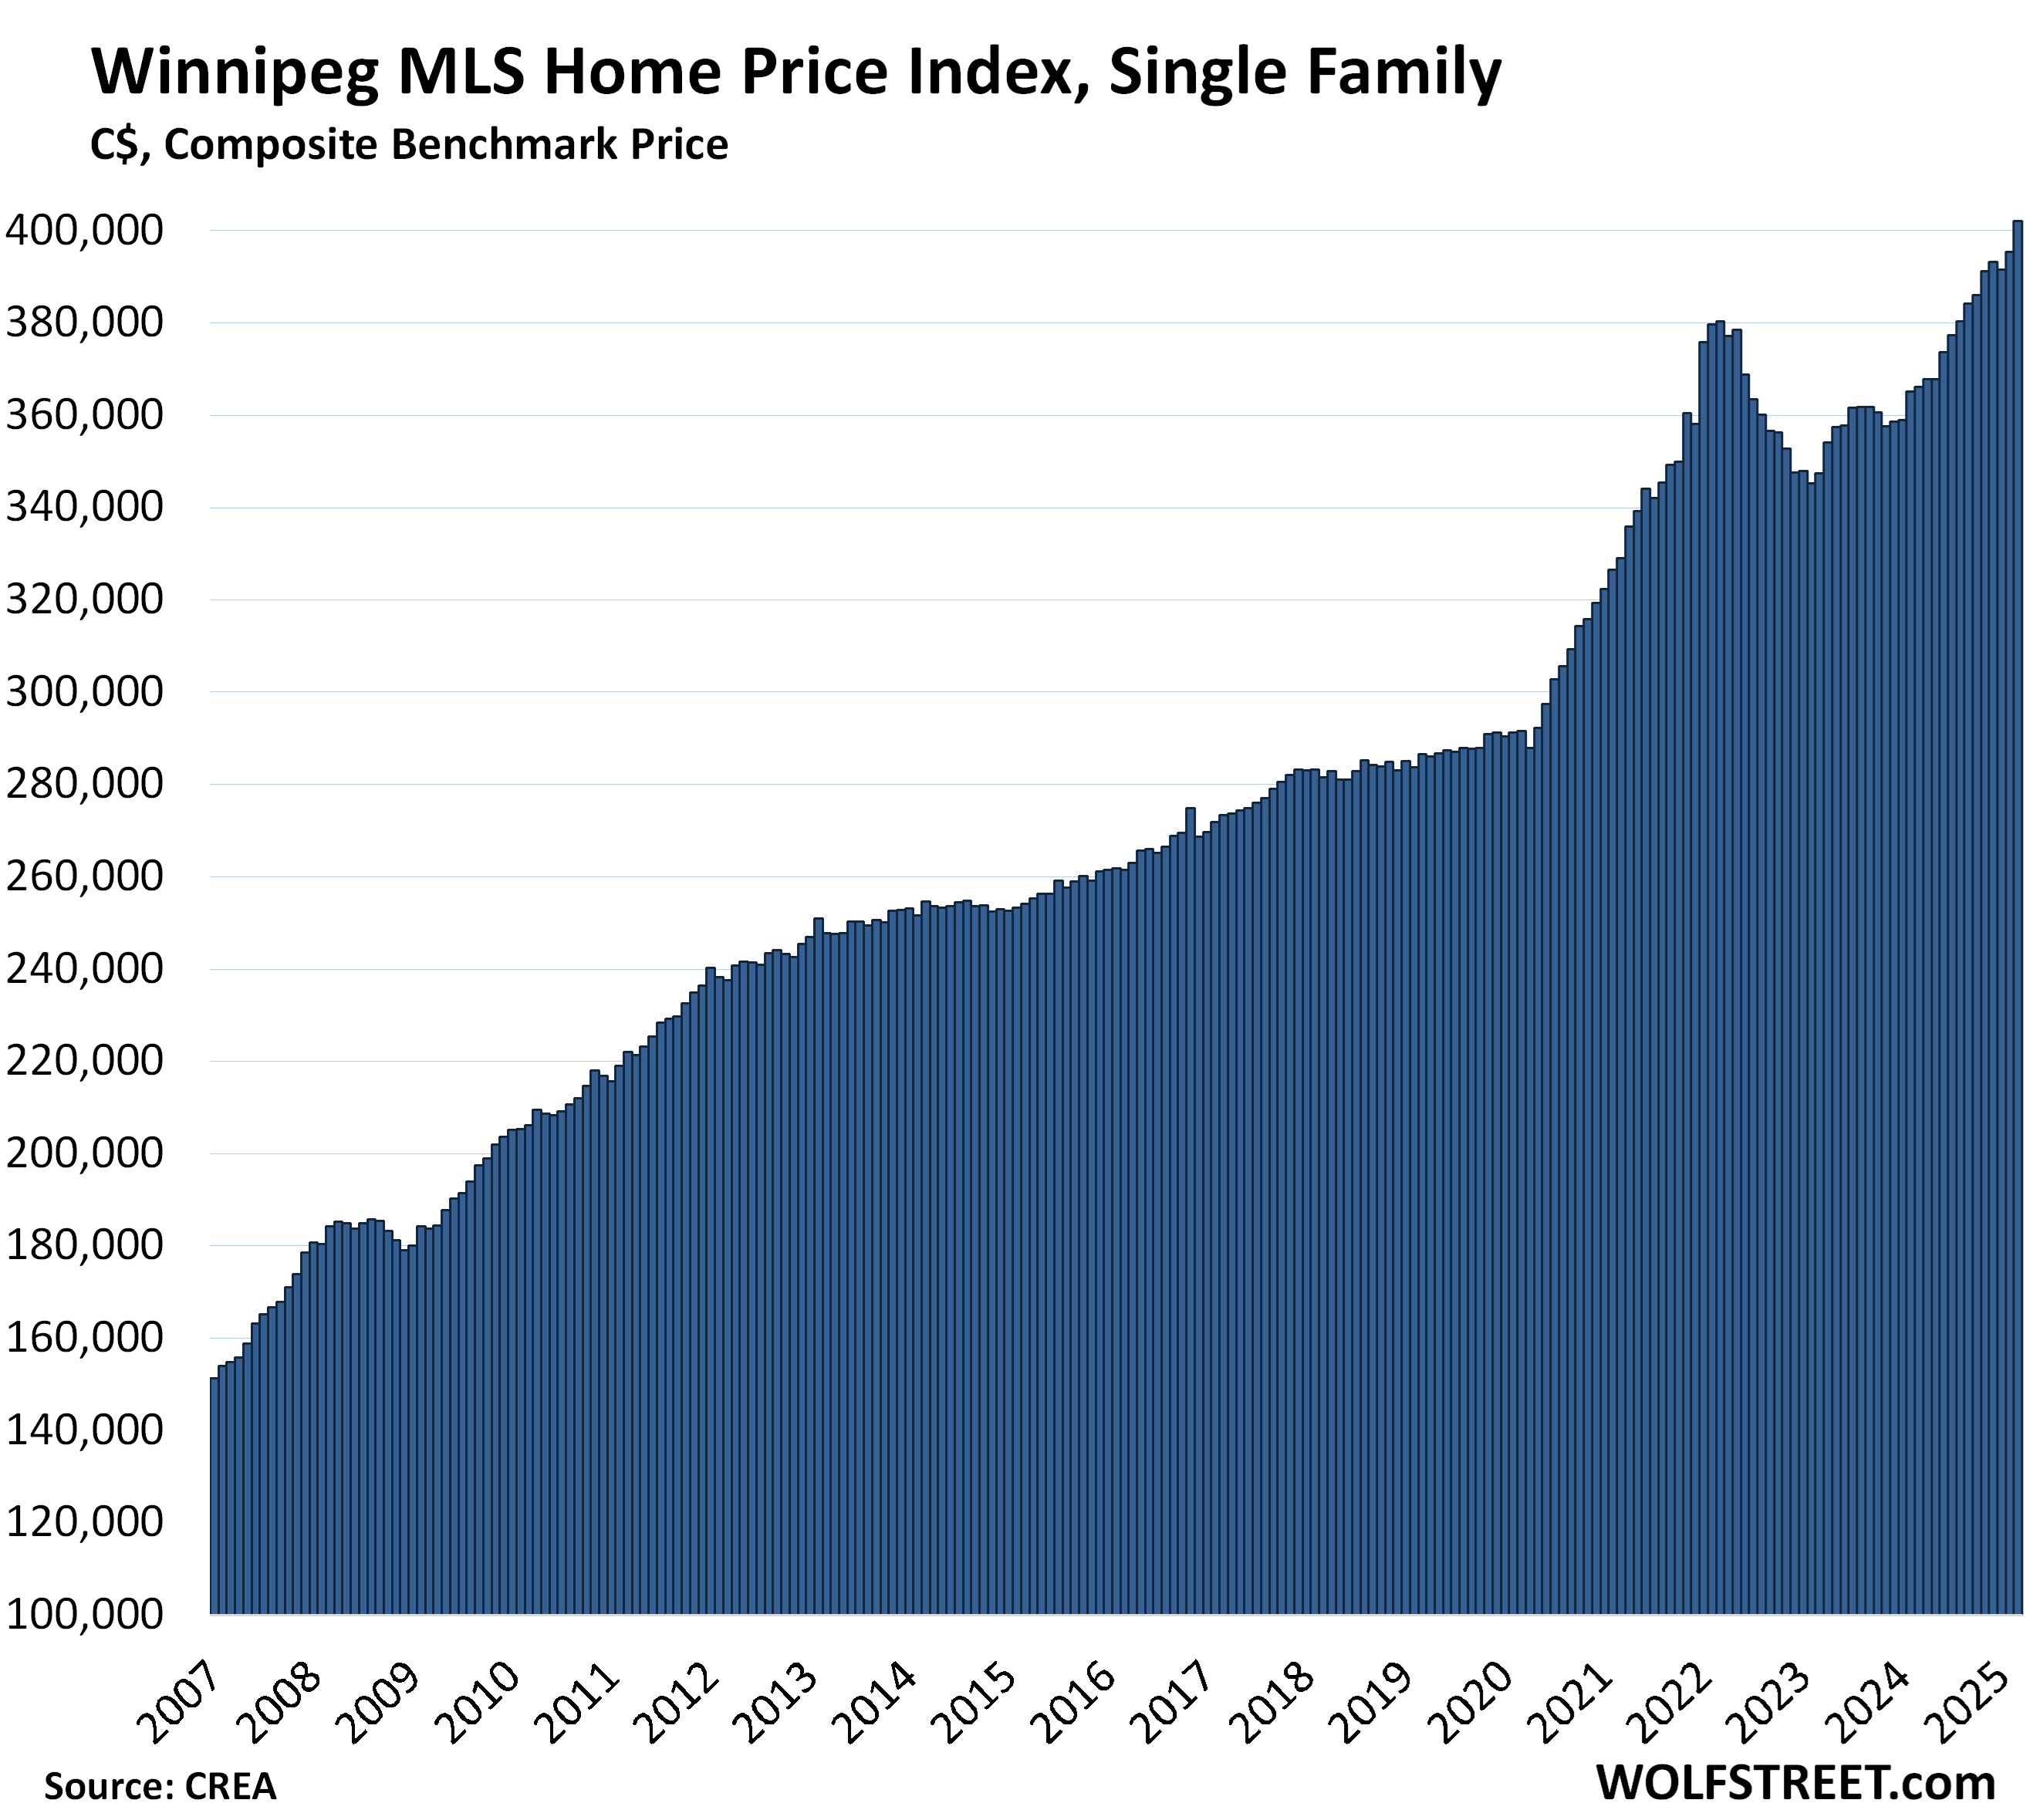
Winnipeg, single-family benchmark price:
- Month-to-month: +1.7% to $402,100
- Year-over-year: +9.8%
In the US, a similar pattern is playing out, with big price drops and multi-year lows in some markets, and continued price increases in others: The Most Splendid Housing Bubbles in America: The Price Drops & Gains of 33 Largest Costliest Housing Markets.
Enjoy reading WOLF STREET and want to support it? You can donate. I appreciate it immensely. Click on the mug to find out how:

![]()
The post The Most Splendid Housing Bubbles in Canada, March 2025: Sales Plunge, Supply Surges, Overall Prices Drop to Multi-Year Lows, Driven by Toronto appeared first on Energy News Beat.
“}]]
