
 [[{“value”:”
The Atlanta Fed’s GDPNow could be all over the place, but nothing compares to how gold imports blew it up this time.
By Wolf Richter for WOLF STREET.
The U.S. Bureau of Economic Analysis (BEA) will release its first estimate of GDP for Q1 on April 30. The Atlanta Fed designed and maintains a model – an algo essentially – that takes in all kinds of economic data for each quarter and provides a running estimate of the BEA’s first estimate of “real” (inflation-adjusted) quarter-to-quarter annualized GDP growth.
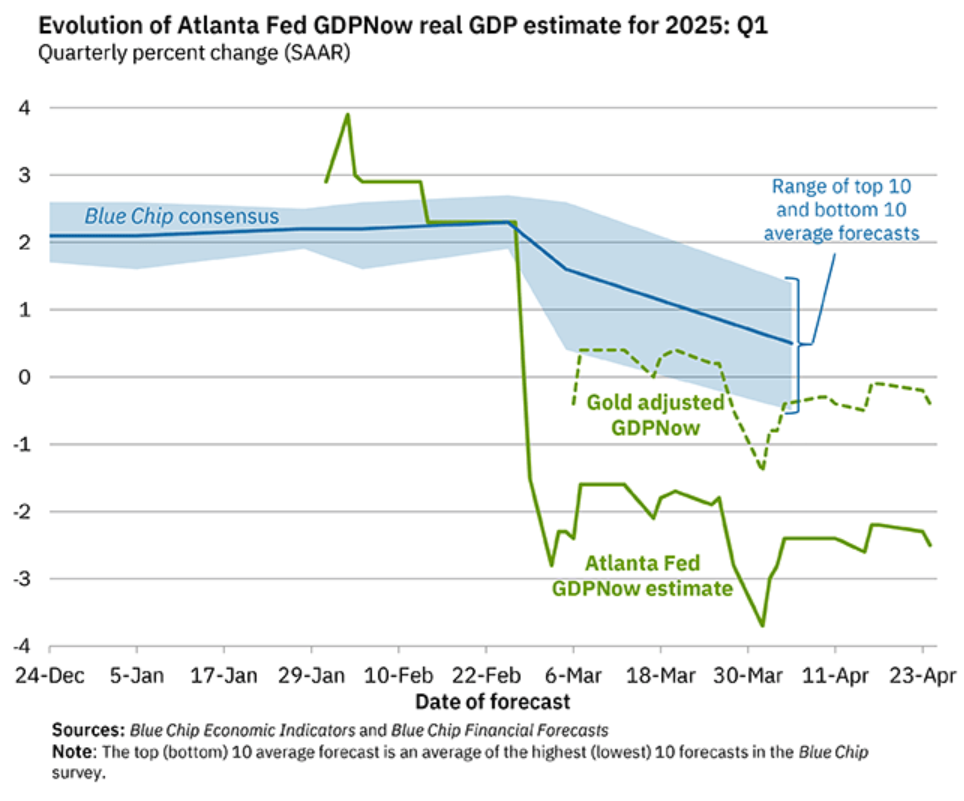
For Q1, GDPNow began providing estimates in late January, and they looked OK, with growth of over 2% annualized. But on February 28, when imports for January were released and taken into the GDPNow model, GDPNow plunged by 5 percentage points to nearly -3%, and went viral. The depression was here, if you believed the clickbait on the internet.
The problem was the spike in imports of gold that investors buy. Imports are a negative in the GDP calculations by the BEA. But gold that investors buy and sell, import or export, is treated like stocks or cryptos that investors buy and sell: It doesn’t enter into the GDP calculation. So imports of gold that investors buy have always been removed from the BEA’s GDP calculation and don’t reduce GDP growth.
But the designers of the Atlanta Fed’s GDPNow model ignored the issue of gold imports. The amounts were small, and it didn’t matter much, until the amounts of gold imports spiked in January, and since monthly amounts are “annualized” (multiplied by 12) to feed into annualized quarterly GDP growth, that one-month spike became a 12-month spike that blew up its GDPNow model, made worse by an additional large amount of gold imports in February, causing the model to forecast a collapse of the US economy.
On March 6, the Atlanta Fed began calculating an alternate GDPNow (the green dotted line) that treats gold imports and exports correctly, by removing them from the GDPNow model. That “Gold adjusted GDPNow” has ranged from slightly positive to slightly negative. The last estimate, released on April 24, was -0.4%. The final estimate will be released tomorrow, April 29, one day before the BEA will release its first estimate of Q1 GDP.
Ignoring gold imports in its GDPNow model went unnoticed until there was an unusual spike in gold imports. And that happens with models: They’re working fine, until they aren’t. The pandemic blew up all kinds of models, including seasonal adjustments and of course infamously on WOLF STREE the CPI for Health Insurance. And those models then have to be fixed in some way.
Last week, the Atlanta Fed published an explanation of what blew up its GDPNow model and how it fixed that in its “New GDPNow Model.” The current GDPNow model will die on April 29. The “New GDPNow Model” (described in detail in this 10-page PDF) will start on April 30.
The Atlanta Fed described the issues and complexities that felled its GDPNow model, and how it included them in its “New GDPNow Model”:
“The measure of nonmonetary gold imports, tracked by the orange line in figure 1 and whose monthly value has never exceeded $9 billion in its 35-year history and has never exceeded $4 billion since 2020, is reported … jointly by the BEA and the US Census Bureau…. Not included in that report, but released [two hours later by the BEA] is a second ‘balance of payments’ (BOP) measure of nonmonetary gold imports. That measure spiked to a monthly average of $29.1 billion for January and February of 2025 (the yellow line in figure 1).”
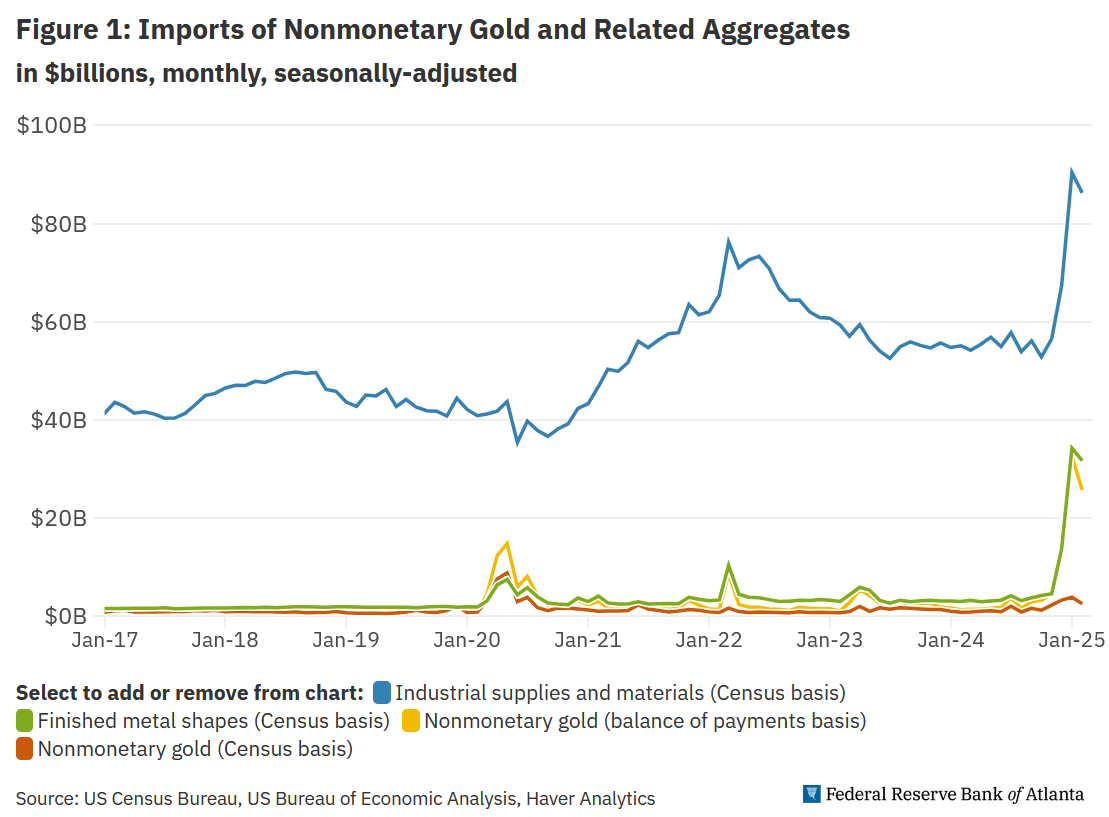
“Why the disparity in these measures of gold imports?”
“As the BEA notes in an FAQ, the BOP measure of gold includes a portion of ‘finished metal shapes’ imports (the green line in figure 1) that are reclassified by the BEA as gold. Recently, the most important of these commodities by far is identified as harmonized system code 7115900530: ‘Articles of precious metal, in rectangular shapes, 99.5 percent or more by weight of precious metal, not otherwise marked or decorated, of gold.’ In other words, gold bars. According to data from USA Trade Online, these imports surged from $2.08 billion in November of 2024 to $28.69 billion in January 2025 before falling back a bit to $22.96 billion in February 2025.”
“In the 8:30 a.m. (ET) international trade report, the finished metal shapes imports that include these gold bar imports are all classified on a Census basis within “industrial supplies and materials.” These also spiked recently, as can be seen in figure 1 (the blue line). Industrial supplies and materials imports are of interest because they, along with five other sub-aggregates of goods exports and imports, are included in the Census Bureau’s Advance Economic Indicators (AEI) report often released about a week before the full international trade report.”
So how to deal with this mess in its New GDPNow model?
“Unfortunately, the AEI report does not separate gold bars or finished metal shapes from the remainder of the industrial supplies and materials imports aggregate, and this affects our methodology. Is there a way we can utilize the international trade data in the AEI until the full report is released?
“A number of analysts have noted Swiss gold exports to the United States have surged. According to Swiss-Impex data and Federal Reserve Board exchange rates, Swiss gold exports to the United States spiked from under $400 million in each of the first two months of 2024 to $17.2 billion in January 2025 and $14.8 billion in February 2025.
“The reason for the spike is likely due to the move of smaller gold bars, stored in London, to Switzerland, where they are refined into the larger gold bars acceptable in the New York market. These Swiss data are often released about a week to ten days before the AEI, and Comex data on gold inventories are available even earlier.
“Nonetheless, because this data is not available from US government sources and the industrial supplies and materials trade data in the AEI is not further disaggregated, we discard that trade data when using the report to forecast net exports. We do, however, use the remaining trade data in that report as described here”….
Long live the “New GDPNow Model.” Until the next thing blows it up.
We give you energy news and help invest in energy projects too, click here to learn more
Crude Oil, LNG, Jet Fuel price quote
ENB Top News
ENB
Energy Dashboard
ENB Podcast
ENB Substack
The post How Gold Imports Blew up Atlanta Fed GDPNow: The Old Model is Dead, Long Live the “New GDPNow Model” Starting Apr 30 appeared first on Energy News Beat.
“}]]
