
 [[{“value”:”
The Fed improves its Standing Repo Facility to prevent another repo market blowout as the balance sheet continues to drop.
By Wolf Richter for WOLF STREET.
Total assets on the Fed’s balance sheet declined by $36 billion in May, to $6.67 trillion, the lowest since April 2020, according to the Fed’s weekly balance sheet today.
Since peak balance sheet at end of QE in April 2022, the Fed’s QT has shed $2.29 trillion, or 25.6% of its total assets.
In terms of Pandemic QE, it has shed 47.7% of $4.81 trillion in assets it had piled on from March 2020 through April 2022.
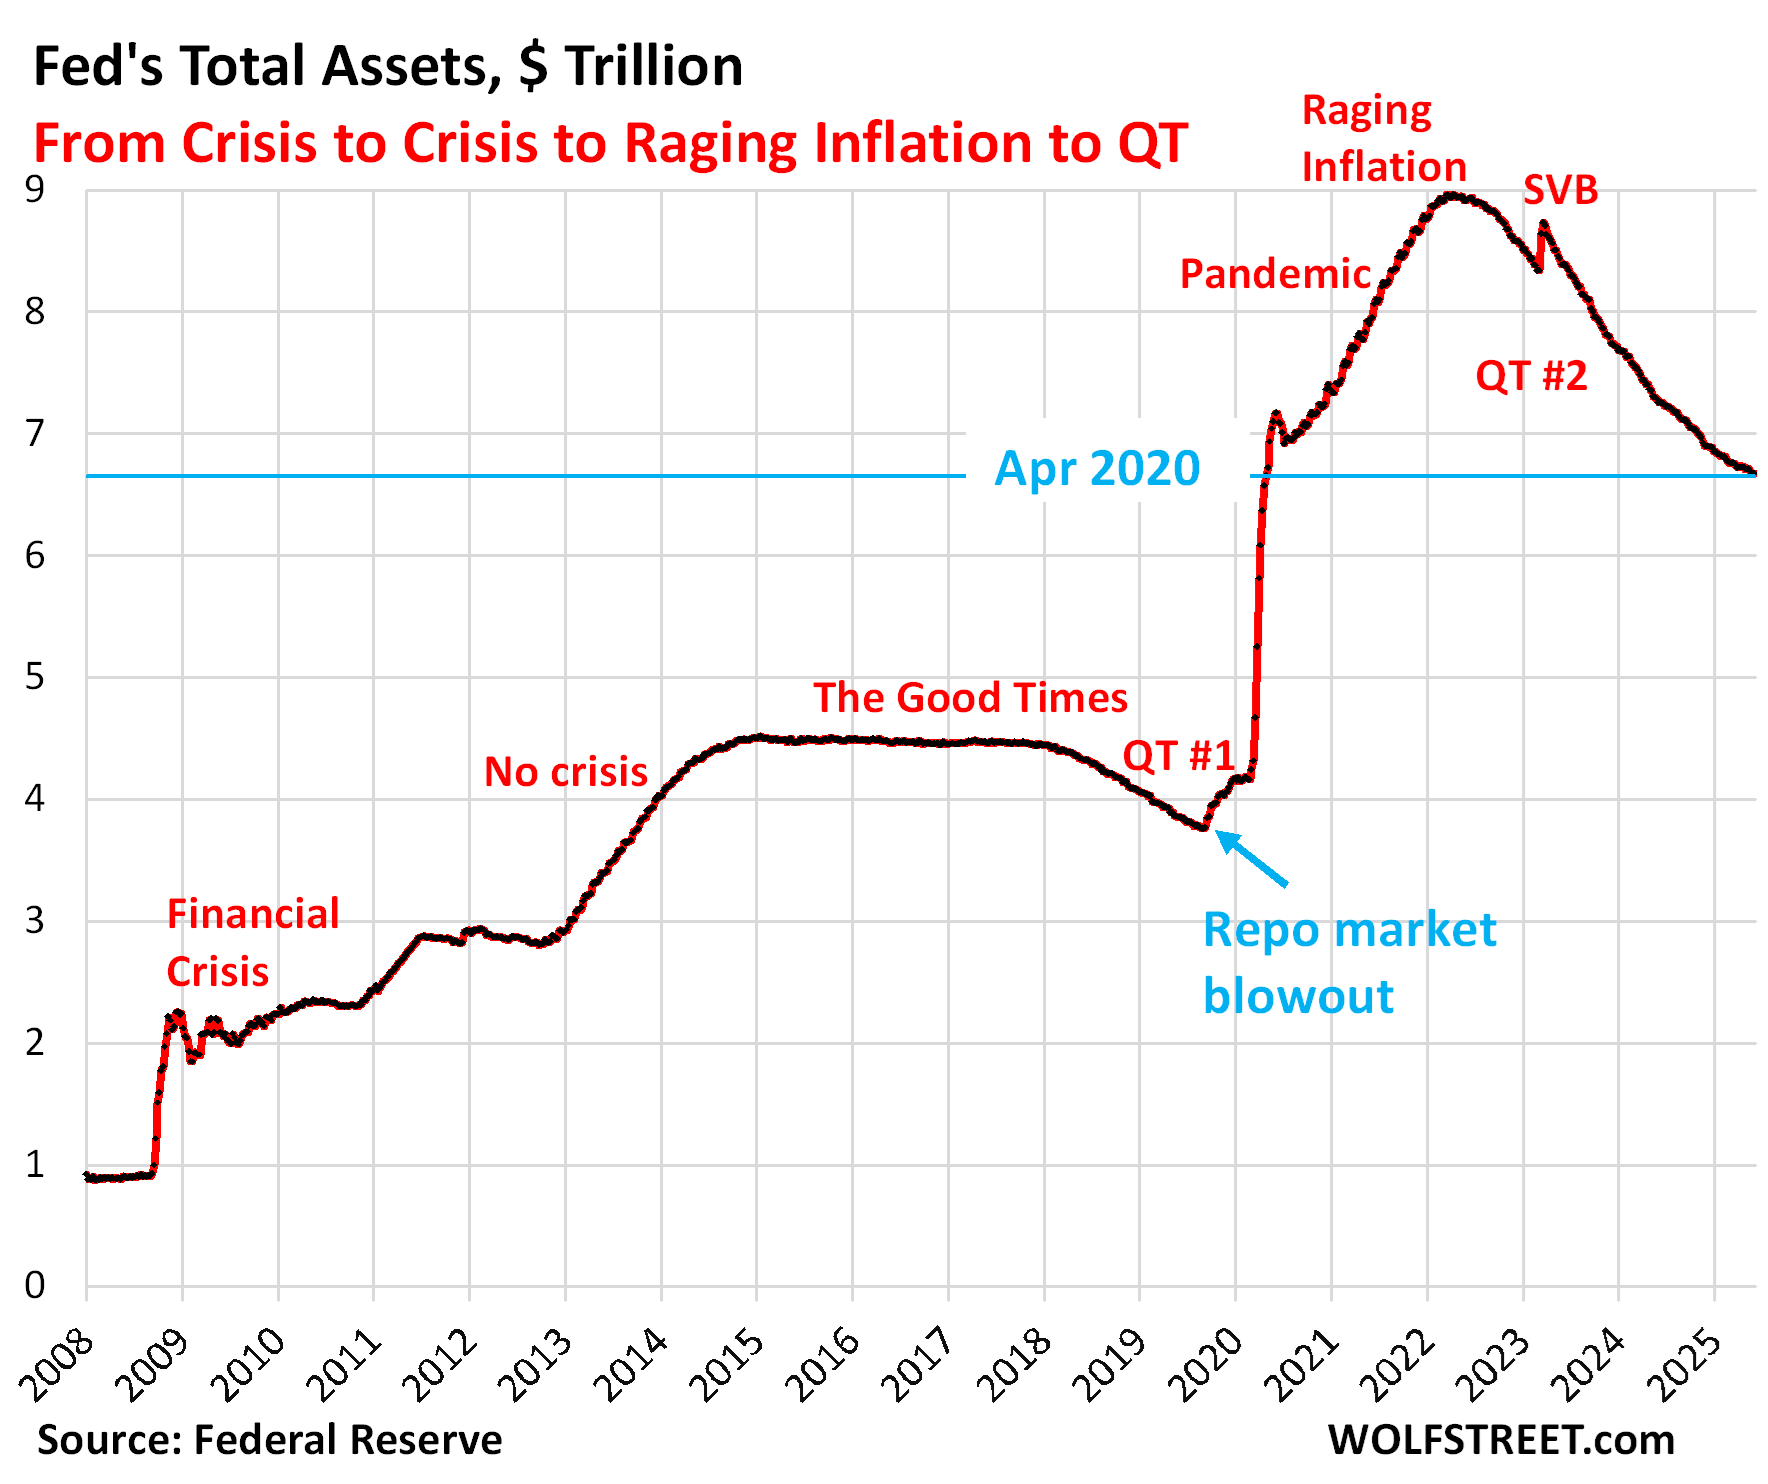
In April 2020, the Fed had piled $1.47 trillion in securities onto its balance sheet, in just that month. To get to a pre-April 2020 balance sheet, QT would have to run for another $860 billion, on top of the $2.29 trillion already under its belt, for a total of $3.15 trillion in QT, to bring total assets below the $5.81 trillion where they’d been at the beginning of April 2020.
At the recently reduced average pace of $20 billion a month, it would take 43 months. QT has already been going on for 35 months, and nothing outside of a few regional banks, led by SVB, has blown up yet.
QT assets.
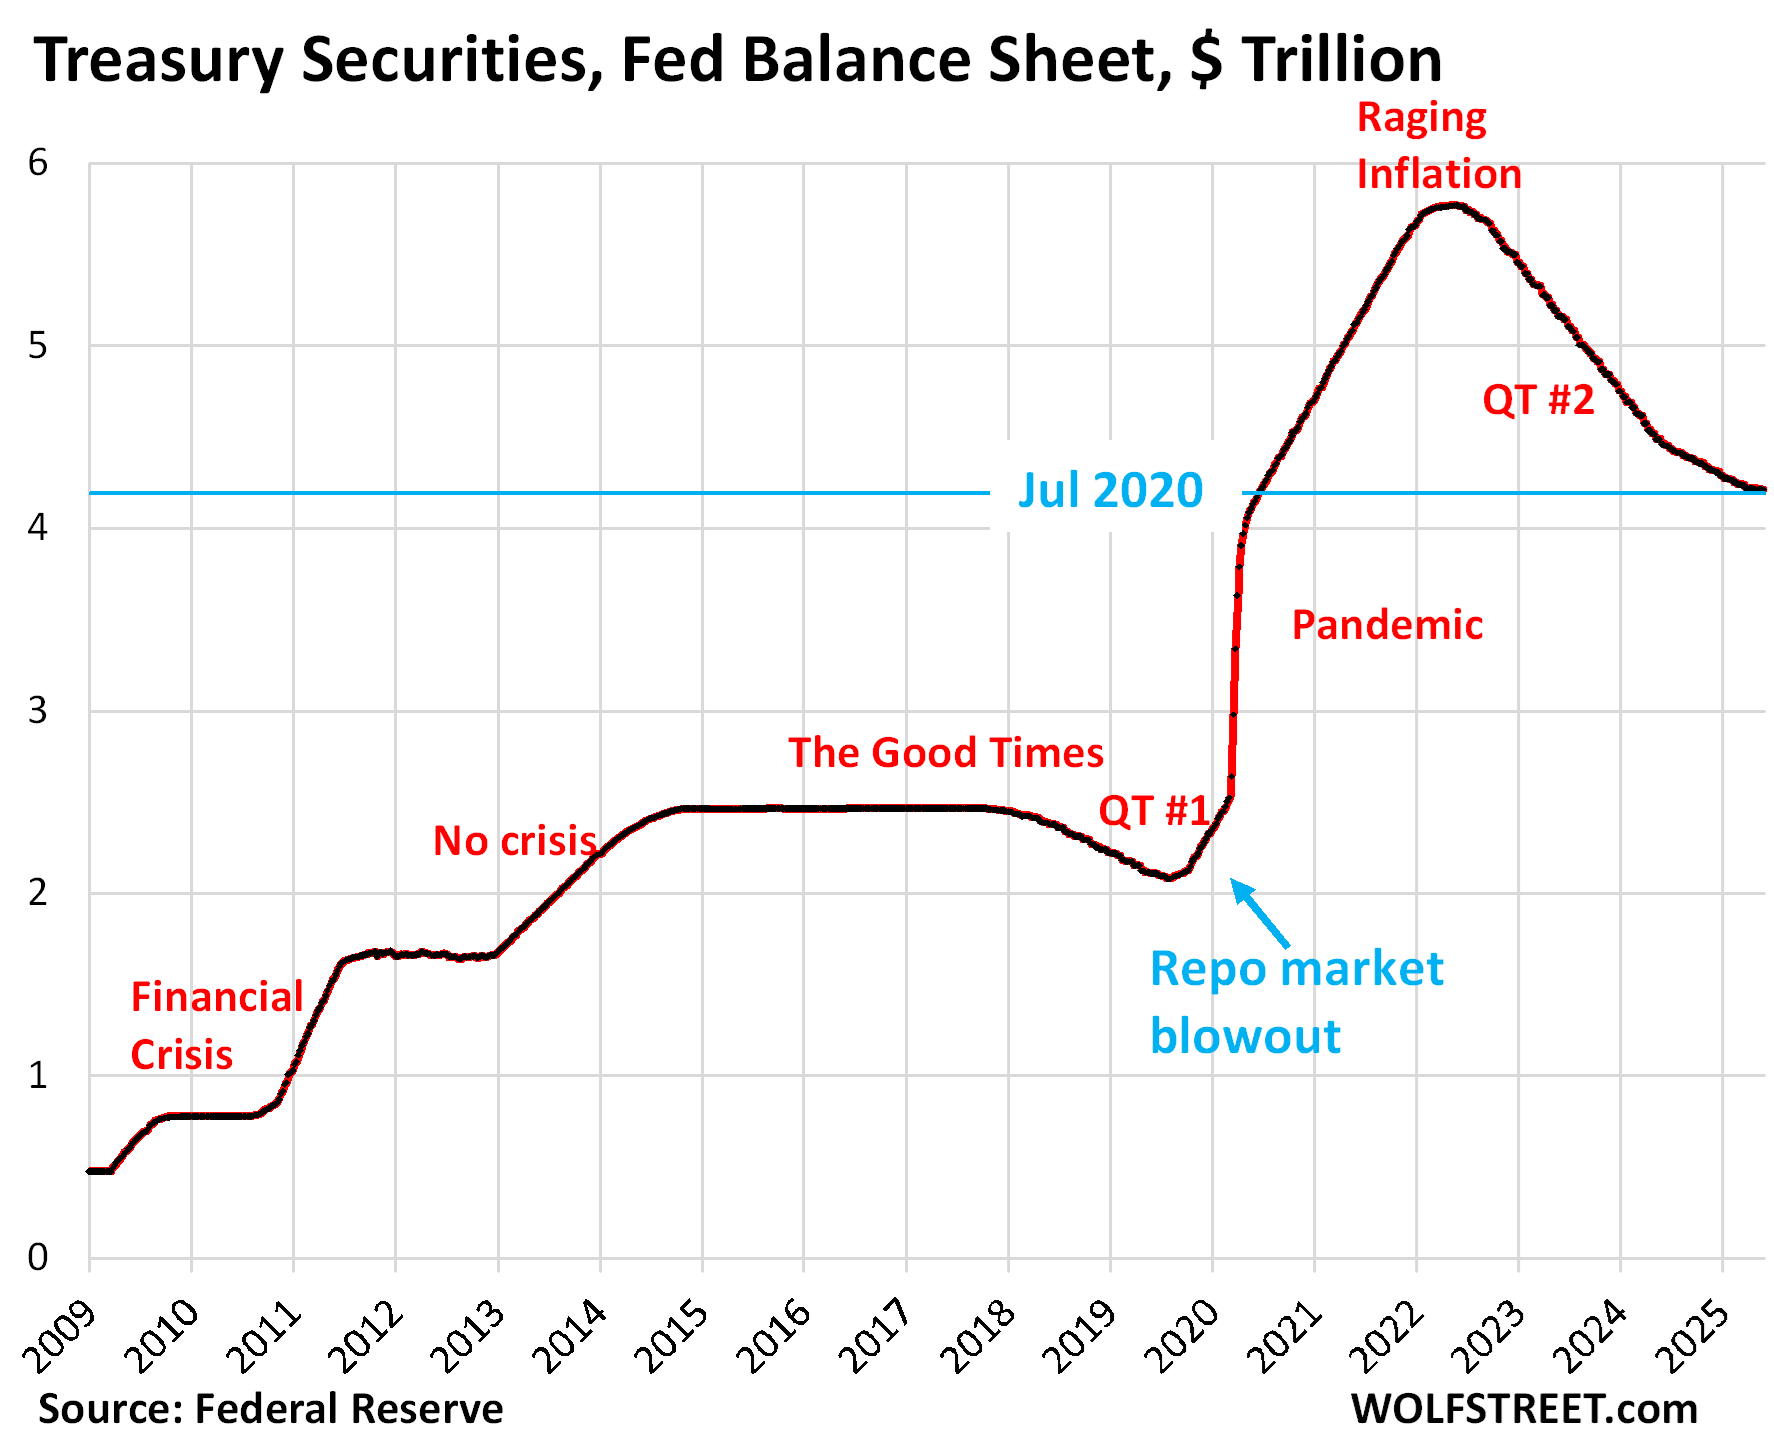
Treasury securities: -$3.7 billion in April, -$1.56 trillion from peak in June 2022 (-27.0%), to $4.21 trillion, the lowest since July 2020.
During pandemic QE, the Fed had piled on $3.27 trillion in Treasury securities. It has now shed 47.7% of that.
Treasury notes (2- to 10-year) and Treasury bonds (20- & 30-year) “roll off” the balance sheet mid-month and at the end of the month when they mature and the Fed gets paid face value.
Given the Fed’s huge Treasury holdings ($4.21 trillion), large amounts of securities mature every month. The Fed gets paid for them, and they come off the balance sheet. If the Fed didn’t do anything, its holdings would shrink rapidly. To limit the monthly shrinkage of its holdings and thereby the liquidity drain on the financial markets, it reinvests a portion of the proceeds from maturing securities into new securities that it buys at auction. The remainder “rolls off” the balance sheet and reduces the balance sheet. As of April, the roll-off has been lowered to $5 billion a month. The overage is re-invested.
Included in the Fed’s Treasury holdings are $424 billion of Treasury Inflation Protected Securities (TIPS). The amount of inflation protection that TIPS holders receive is not paid in cash but is added to the TIPS balance to be paid when the TIPS mature. So the Fed’s TIPS balance grows with the inflation protection. In May, the Fed received $1.13 billion in inflation protection, which was added to the TIPS balance, which had the effect of reducing the roughly $5 billion in Treasury roll-off to $3.7 billion.
The chart shows the effects of slowing Treasury QT from $60 billion a month initially, to $25 billion a month starting in June 2024, and to $5 billion starting in April 2025.
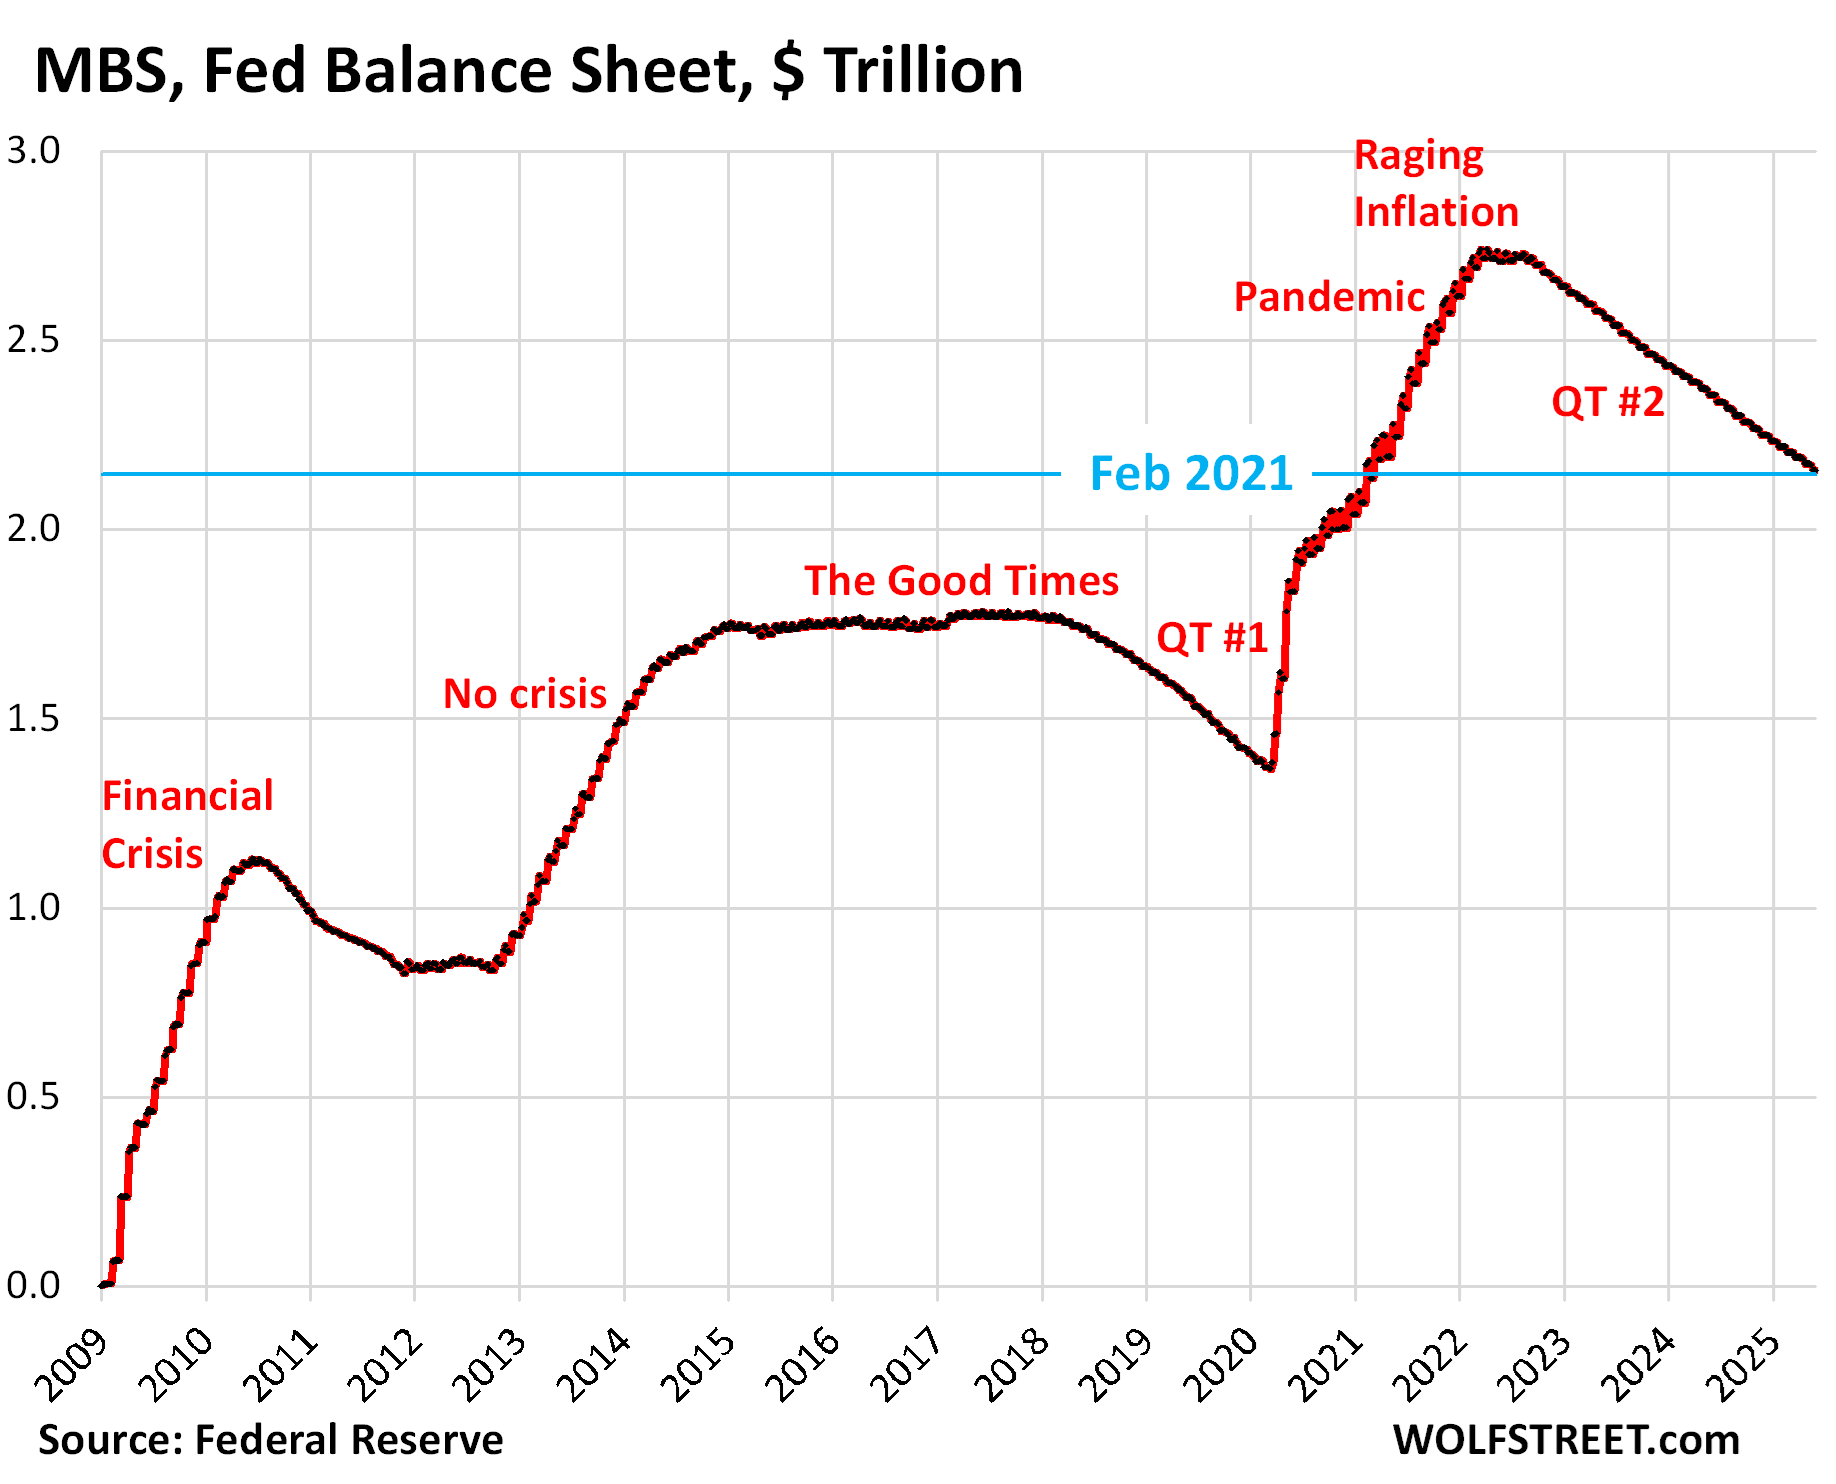
Mortgage-Backed Securities (MBS): -$16.8 billion in May, -$584 billion from the peak, to $2.16 trillion, where they’d first been in February 2021.
The Fed has shed 21.3% of its MBS since the peak in April 2022, and 42.5% of the $1.37 trillion in MBS that it had added during pandemic QE.
The Fed holds only “agency” MBS that are guaranteed by the government, where the taxpayer would eat the losses when borrowers default on mortgages, not the Fed.
MBS come off the balance sheet primarily via pass-through principal payments that holders receive when mortgages are paid off (mortgaged homes are sold, mortgages are refinanced) and as mortgage payments are made. But sales of existing homes have plunged and mortgage refinancing has collapsed, and far fewer mortgages got paid off, and passthrough principal payments to MBS holders, such as the Fed, have slowed to a trickle. As a result, MBS have come off the Fed’s balance sheet at a pace that has been mostly in the range of $14-17 billion a month.
The pace of the MBS reduction is not limited by the Fed, and if pass-through principal payments were to become a torrent again, as they had during the refi boom in 2020-2022, the Fed would re-invest any pass-through principal payments above $35 billion a month in Treasury securities. In that event, total QT would reach $40 billion a month, the theoretical maximum under the current setup.
Bank liquidity facilities: inactive.
The Fed has three bank liquidity facilities. They were essentially inactive in May. The Fed has been exhorting banks to start practicing using these facilities with “small value exercises,” or at least get set up to use them, and pre-position collateral so that they could use them quickly.
- Central Bank Liquidity Swaps ($16 million)
- Standing Repo Facility ($1 million)
- Discount Window: $2.9 billion, down by $0.6 billion from a month ago. During the SVB panic, it had spiked to $153 billion.
What else contributed to the $36 billion decline in assets?
The balance sheet declined in total by $36.4 billion in May. But Treasury securities declined by only $3.7 billion and MBS by $16.8 billion, for a combined decline of $20.5 billion.
Another $13.6 billion of the $36.4 billion decline came from changes in these three accounts:
Discount Window borrowing fell $0.6 billion, as noted above.
“Other assets” fell by $10.6 billion.
This $10.6 billion decline consisted mostly of accrued interest from its bond holdings that the Fed had set up as a receivable (an asset) previously, and that it was paid in May. When the Fed receives interest payments, it destroys that money and it comes off the balance sheet, and the account declines by that amount (the Fed doesn’t have a “cash” account, like companies do; it creates money when it pays for something and destroys money when it gets paid).
This account also includes “bank premises” and other accounts receivables and will always have some balance.
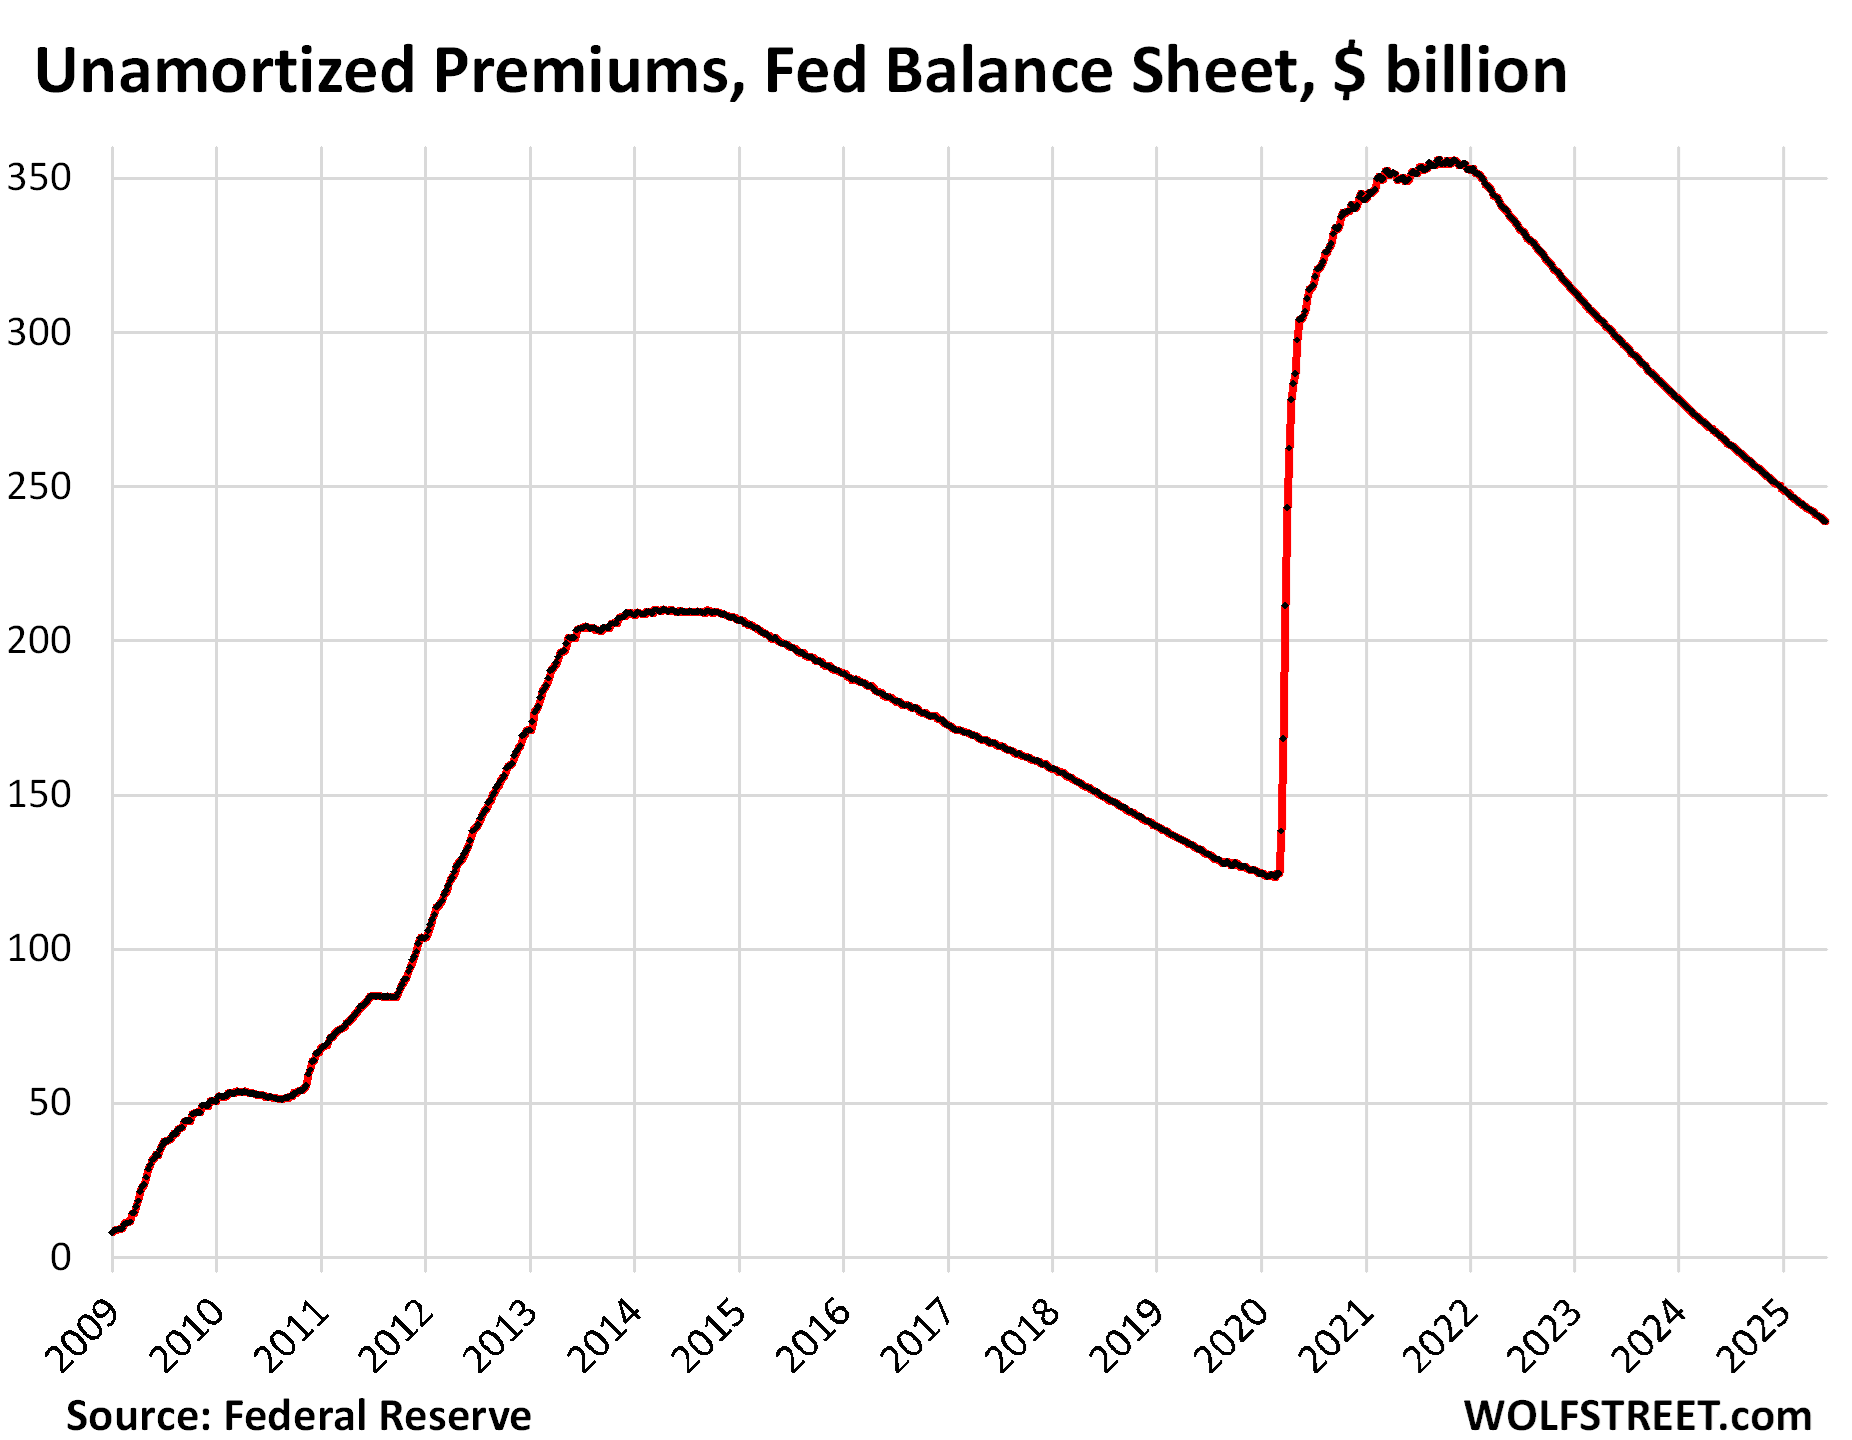
“Unamortized premiums” fell by $2.4 billion.
Unamortized premiums are a regular accounting entry with which the Fed writes off the premium over face value it had to pay for bonds during QE that had been issued months or years earlier with higher coupon interest rates and that had gained value as yields dropped before the Fed bought them. Like all institutional bondholders, the Fed amortizes that premium over the life of the bond. The remaining balance of unamortized premiums is now down to $239 billion, from $356 billion at the peak in November 2021:
Not another repo-market blowout, please.
The assets-to-GDP ratio. Before the QE era began in 2009, the Fed’s balance sheet grew over the years roughly in line with the economy as measured by “current dollar” GDP (neither balance sheet nor GDP adjusted for inflation). This assets-to-GDP ratio was 6.0% in 2008.
QE drove the ratio to 25% by December 2014. As QE stopped and the balance sheet remained flat while GDP kept growing, the ratio fell. QT-1 in 2018 and 2019 accelerated the decline of the ratio, until it hit 18% in Q2 2019 and fell below 18% in Q3 2019…
And then the repo market blew out. Oh goodness, what a mess that was. The Fed stepped back in, and by December 2019, the ratio had risen to 19%.
During pandemic QE, the assets-to-GDP ratio spiked to 35.5% in Q2 2020 as GDP collapsed while the Fed’s balance sheet exploded. As GDP bounced back, the ratio dropped for one quarter, but then the GDP bounce-back slowed while QE continued faster than GDP rose, and the ratio returned to 35.4% in Q1 2022, when QE stopped.
After three years of economic growth since Q1 2022 and $2.29 trillion in QT, the ratio has now dropped to 22.3%, just above where it had first been in Q3 2013.
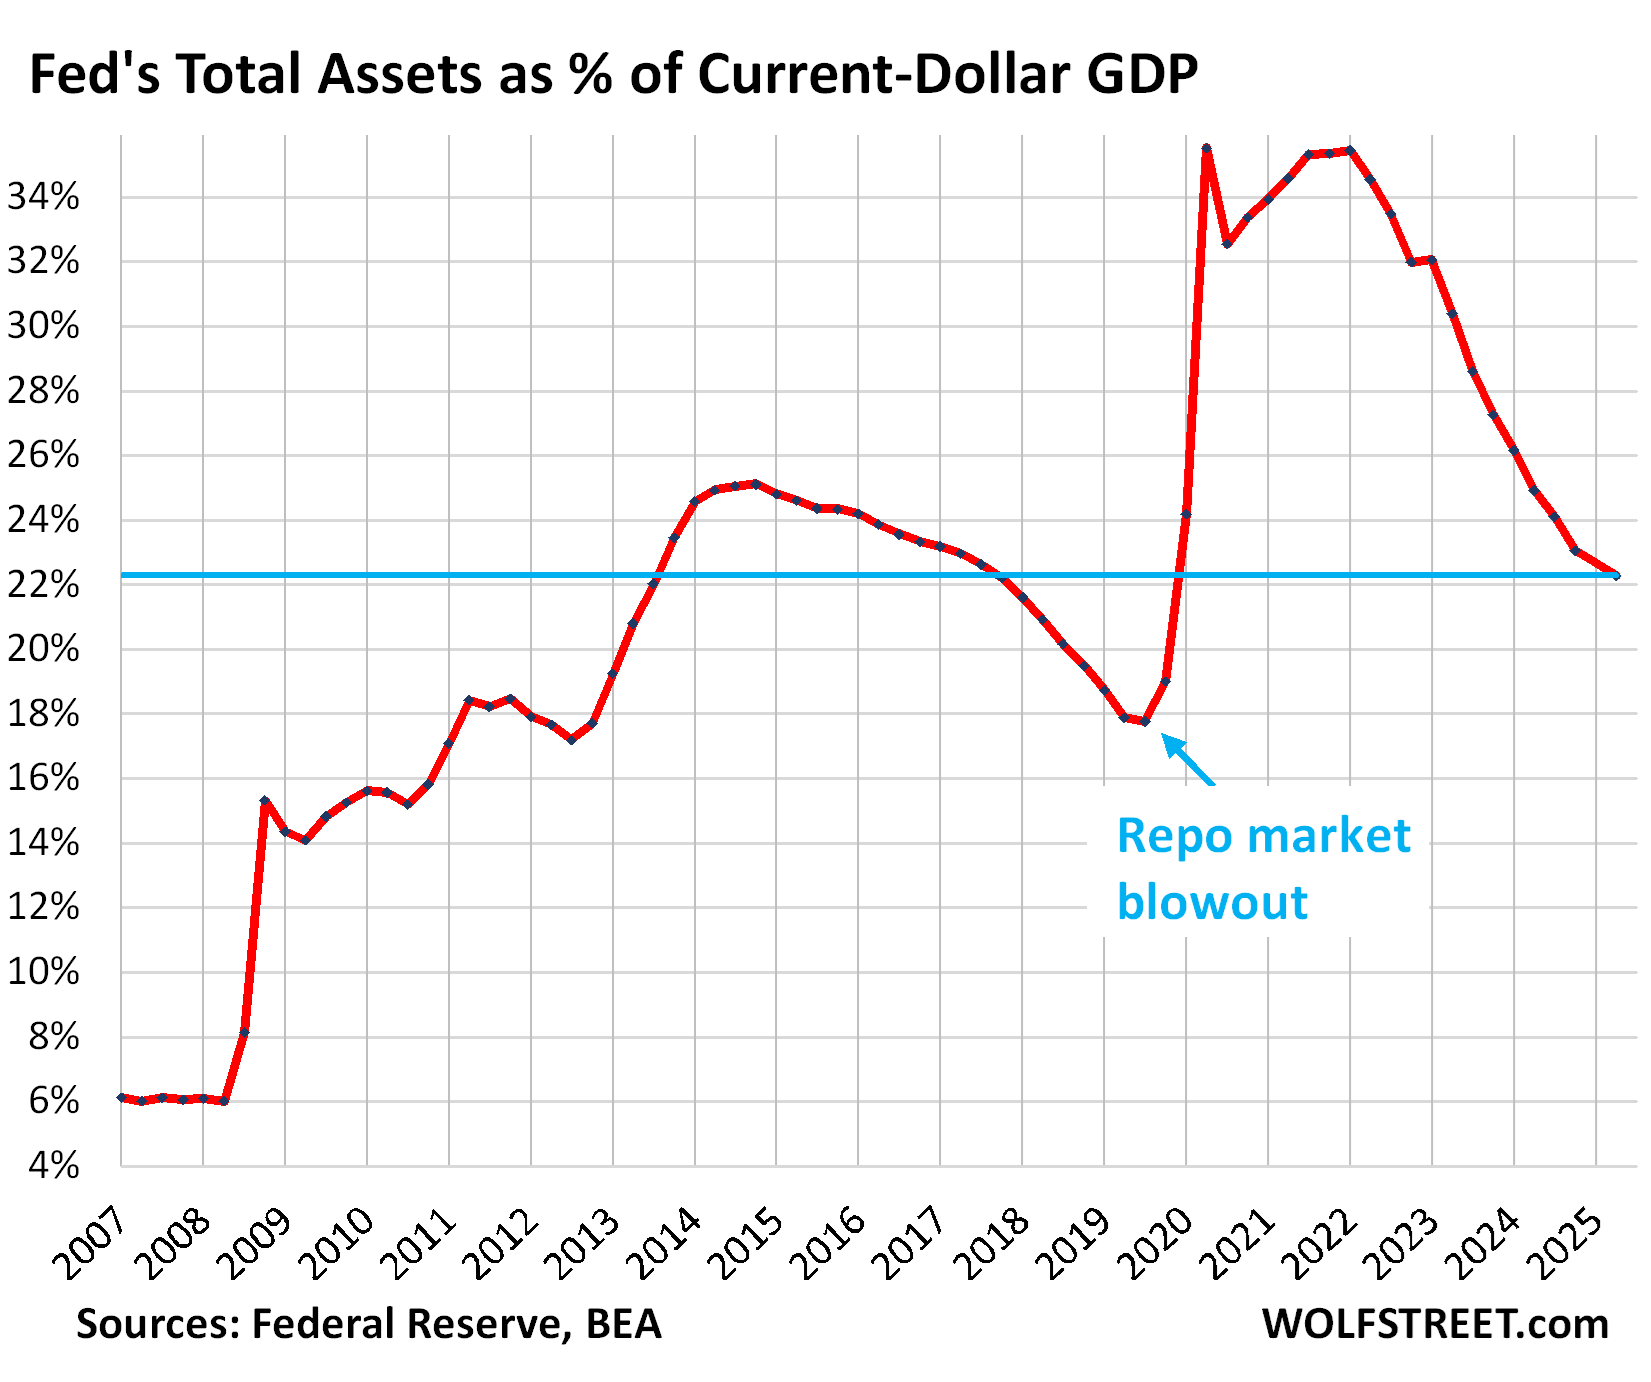
We note with a lopsided smile: When the ratio dropped below 18% in September 2019, the repo market blew out, and the Fed stepped back into it by loading up its balance sheet again, this time with repos. Which taught the Fed a lesson. And it has talked a lot about it.
So in July 2021, it revived the Standing Repo Facility (SRF), which it had scuttled in 2009. It then worked to improve the SRF, including by adding an auction in the morning, in addition to the afternoon auction, so that banks could use it more easily to deal with any ripples in liquidity flows.
The daily morning auctions will start on June 26 with an aggregate operation limit of $500 billion.
The afternoon auction currently has an aggregate operation limit of $500 billion, but when the morning auction becomes operational, the limit of the afternoon auction will be reduced by the accepted amount of the morning auction. In other words, the combined total from both auctions remains at $500 billion.
Banks are not using the facility at the moment because the Fed’s minimum bid rate (currently 4.5%) is generally higher than the repo market rate. But they can use it, and it would make sense for them to use it, and they could profit from using it, if rates in the repo market rise above the Fed’s minimum bid rate, as the banks could borrow from the SRF and lend the proceeds to the repo market to profit from the spread, which would likely prevent another repo market blowout before it even got started.
But this issue is also why the Fed has slowed QT so much — to give liquidity plenty of time to move to where it’s needed without blowing something up.
Enjoy reading WOLF STREET and want to support it? You can donate. I appreciate it immensely. Click on the mug to find out how:

![]()
The post Fed Balance Sheet QT: -$36 Billion in May, -$2.29 Trillion from Peak, to $6.67 Trillion, Lowest since April 2020. appeared first on Energy News Beat.
“}]]
