
 [[{“value”:”
Active Listings versus 2019: Tampa +40%, Orlando +42%, Jacksonville +25%, Cape Coral-Fort Myers +36%, North Port-Sarasota +36%, Lakeland +80%. Miami a little behind: +5%.
By Wolf Richter for WOLF STREET.
Active listings of existing homes for sale in Florida soared by 32% year-over-year in May to 181,822 listings, up by 26% from May 2019, and up by 34% from May 2018, after a surge that started in late 2022 from very low levels. Since then, inventory for sale has quadrupled.
The inventory levels in April and May were by far the highest in the data from realtor.com going back to 2016. There was a housing shortage in 2021 and 2022. And now there’s a flood of housing on the market.
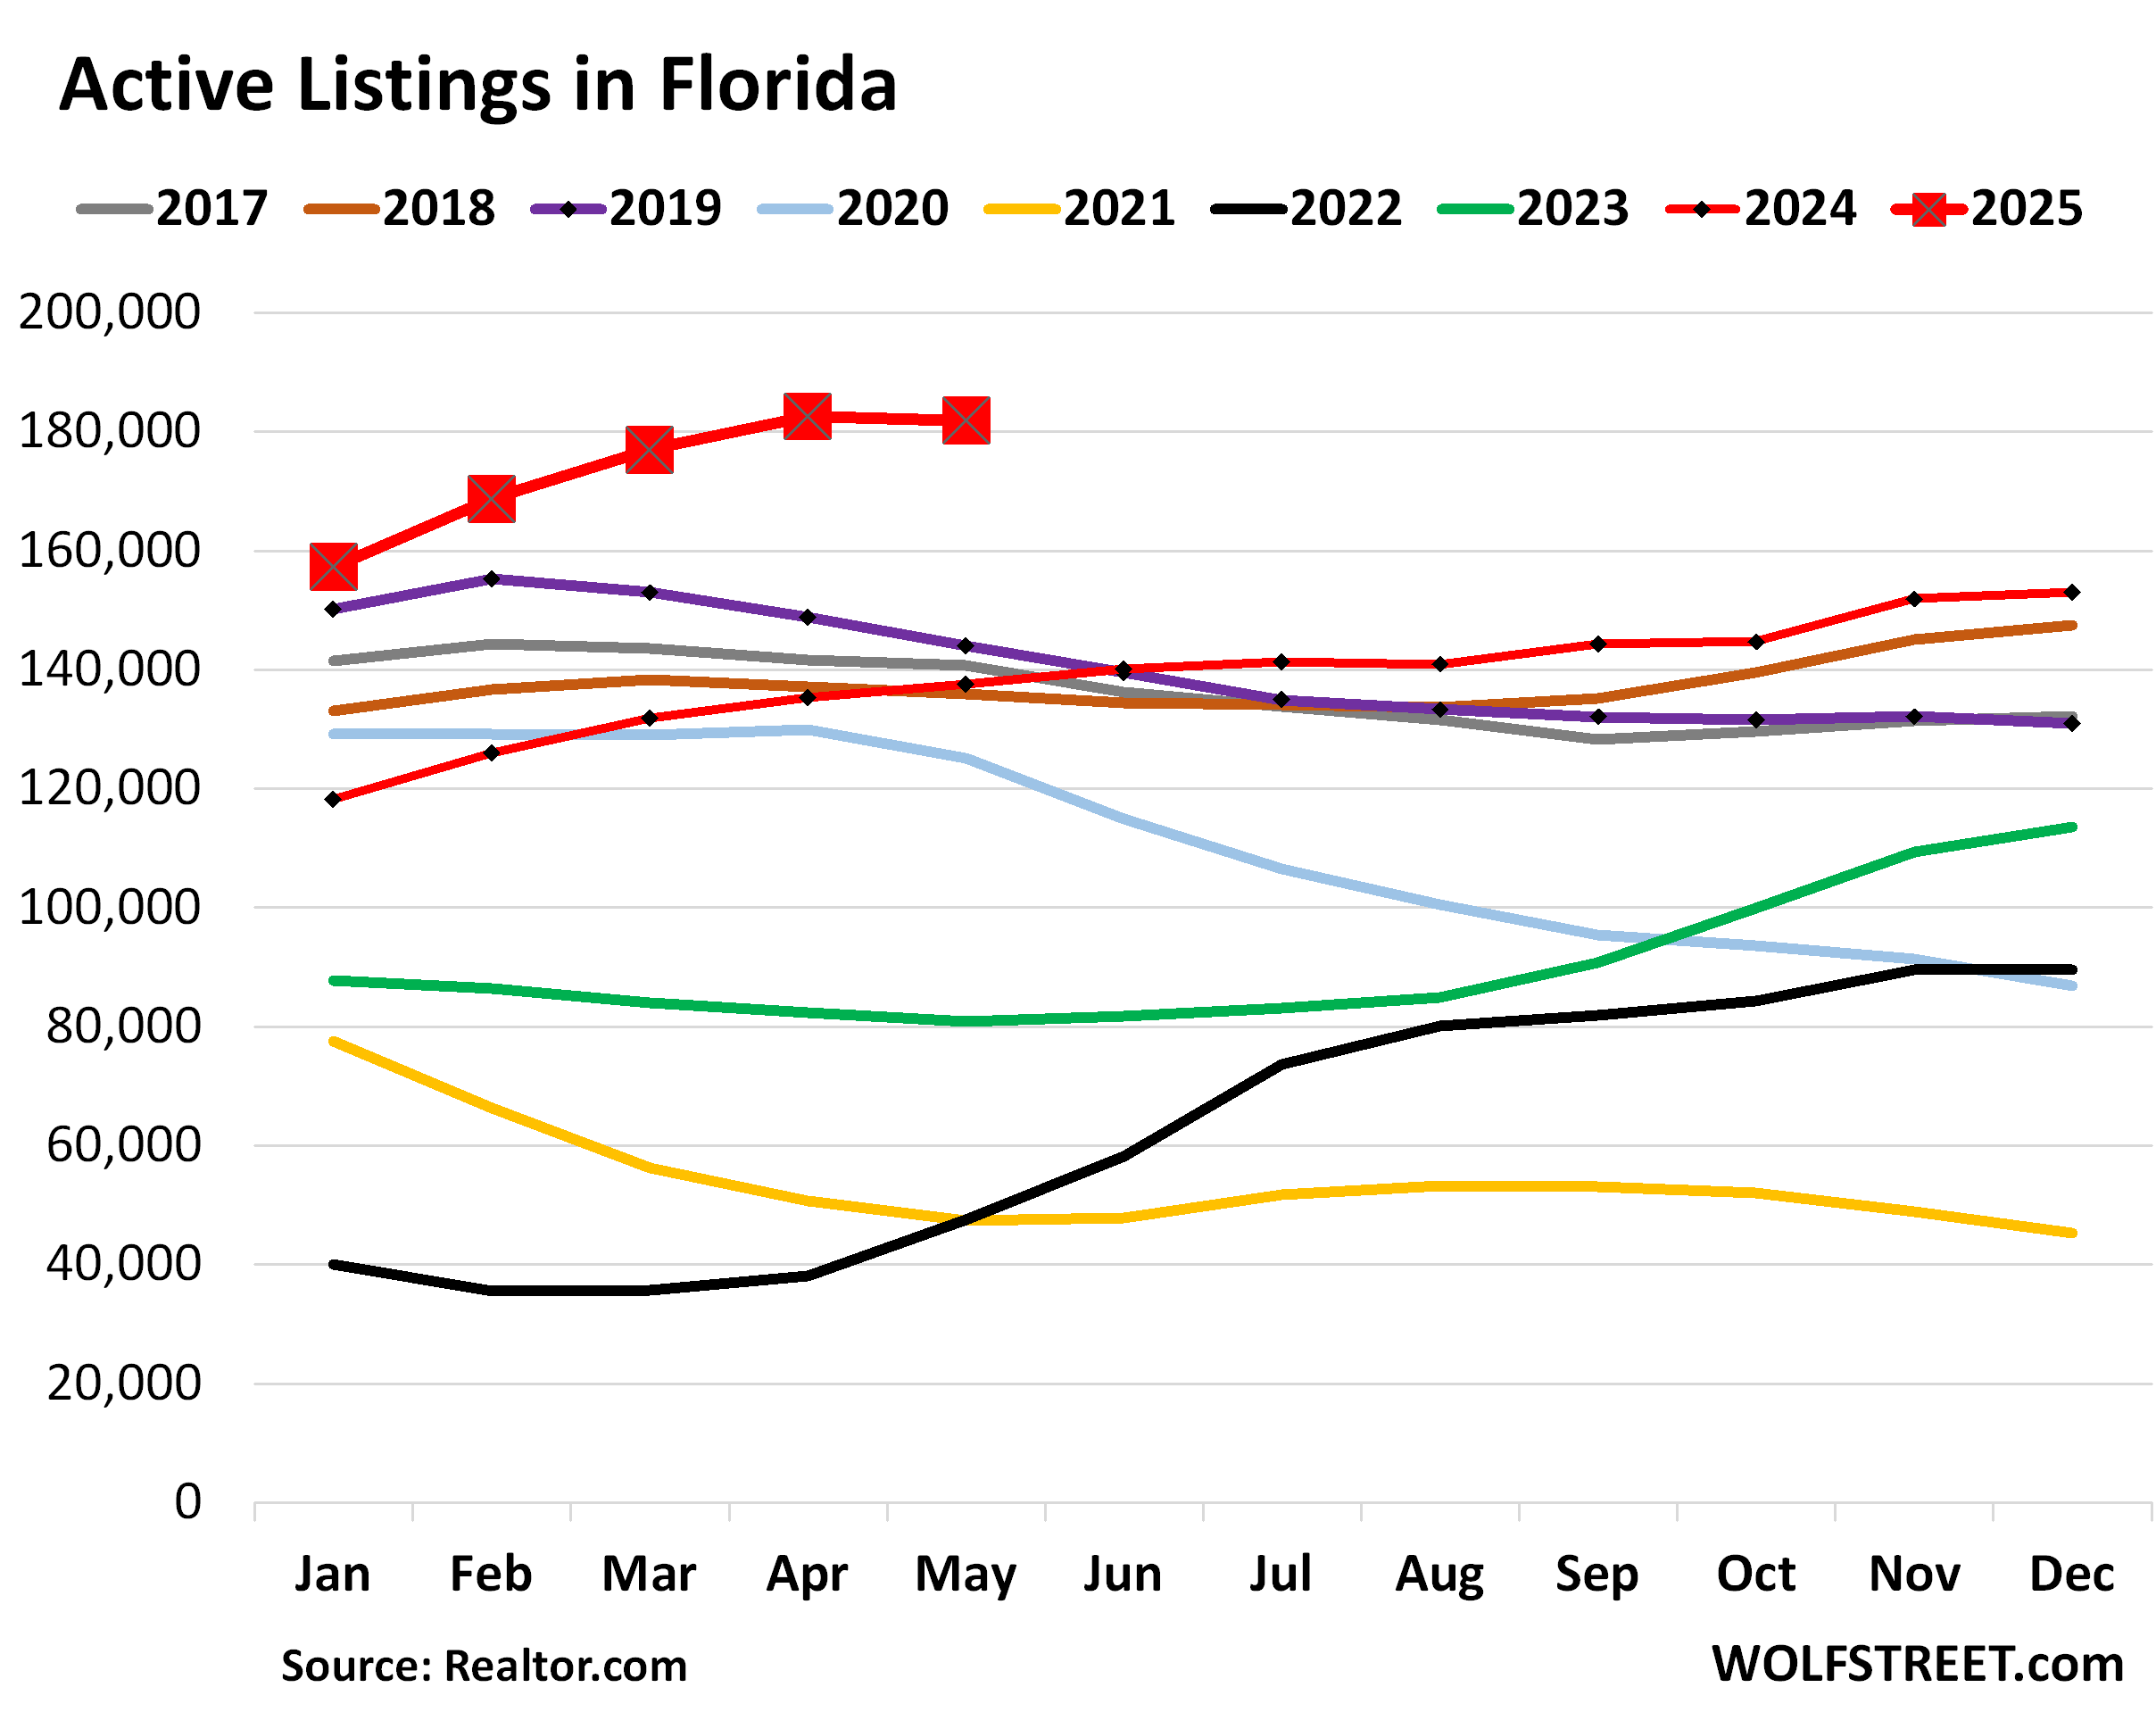
The pile-up of unsold inventory isn’t due to suddenly surging new listings – they’re not doing that – but due to demand: sales have plunged, and what comes on the market sits longer and then gets pulled off the market to get relisted again later.
Why have sales plunged? Prices spiked so far so fast in a historic price explosion during the free-money pandemic that those too-high prices have triggered demand destruction, one of the most fundamental economic dynamics.
Active listings are homes for sale that do not have a pending sale. They’re the “unsold” inventory. Total inventory, on the other hand, includes active listings (unsold inventory) plus inventory with a pending sale (sold inventory).
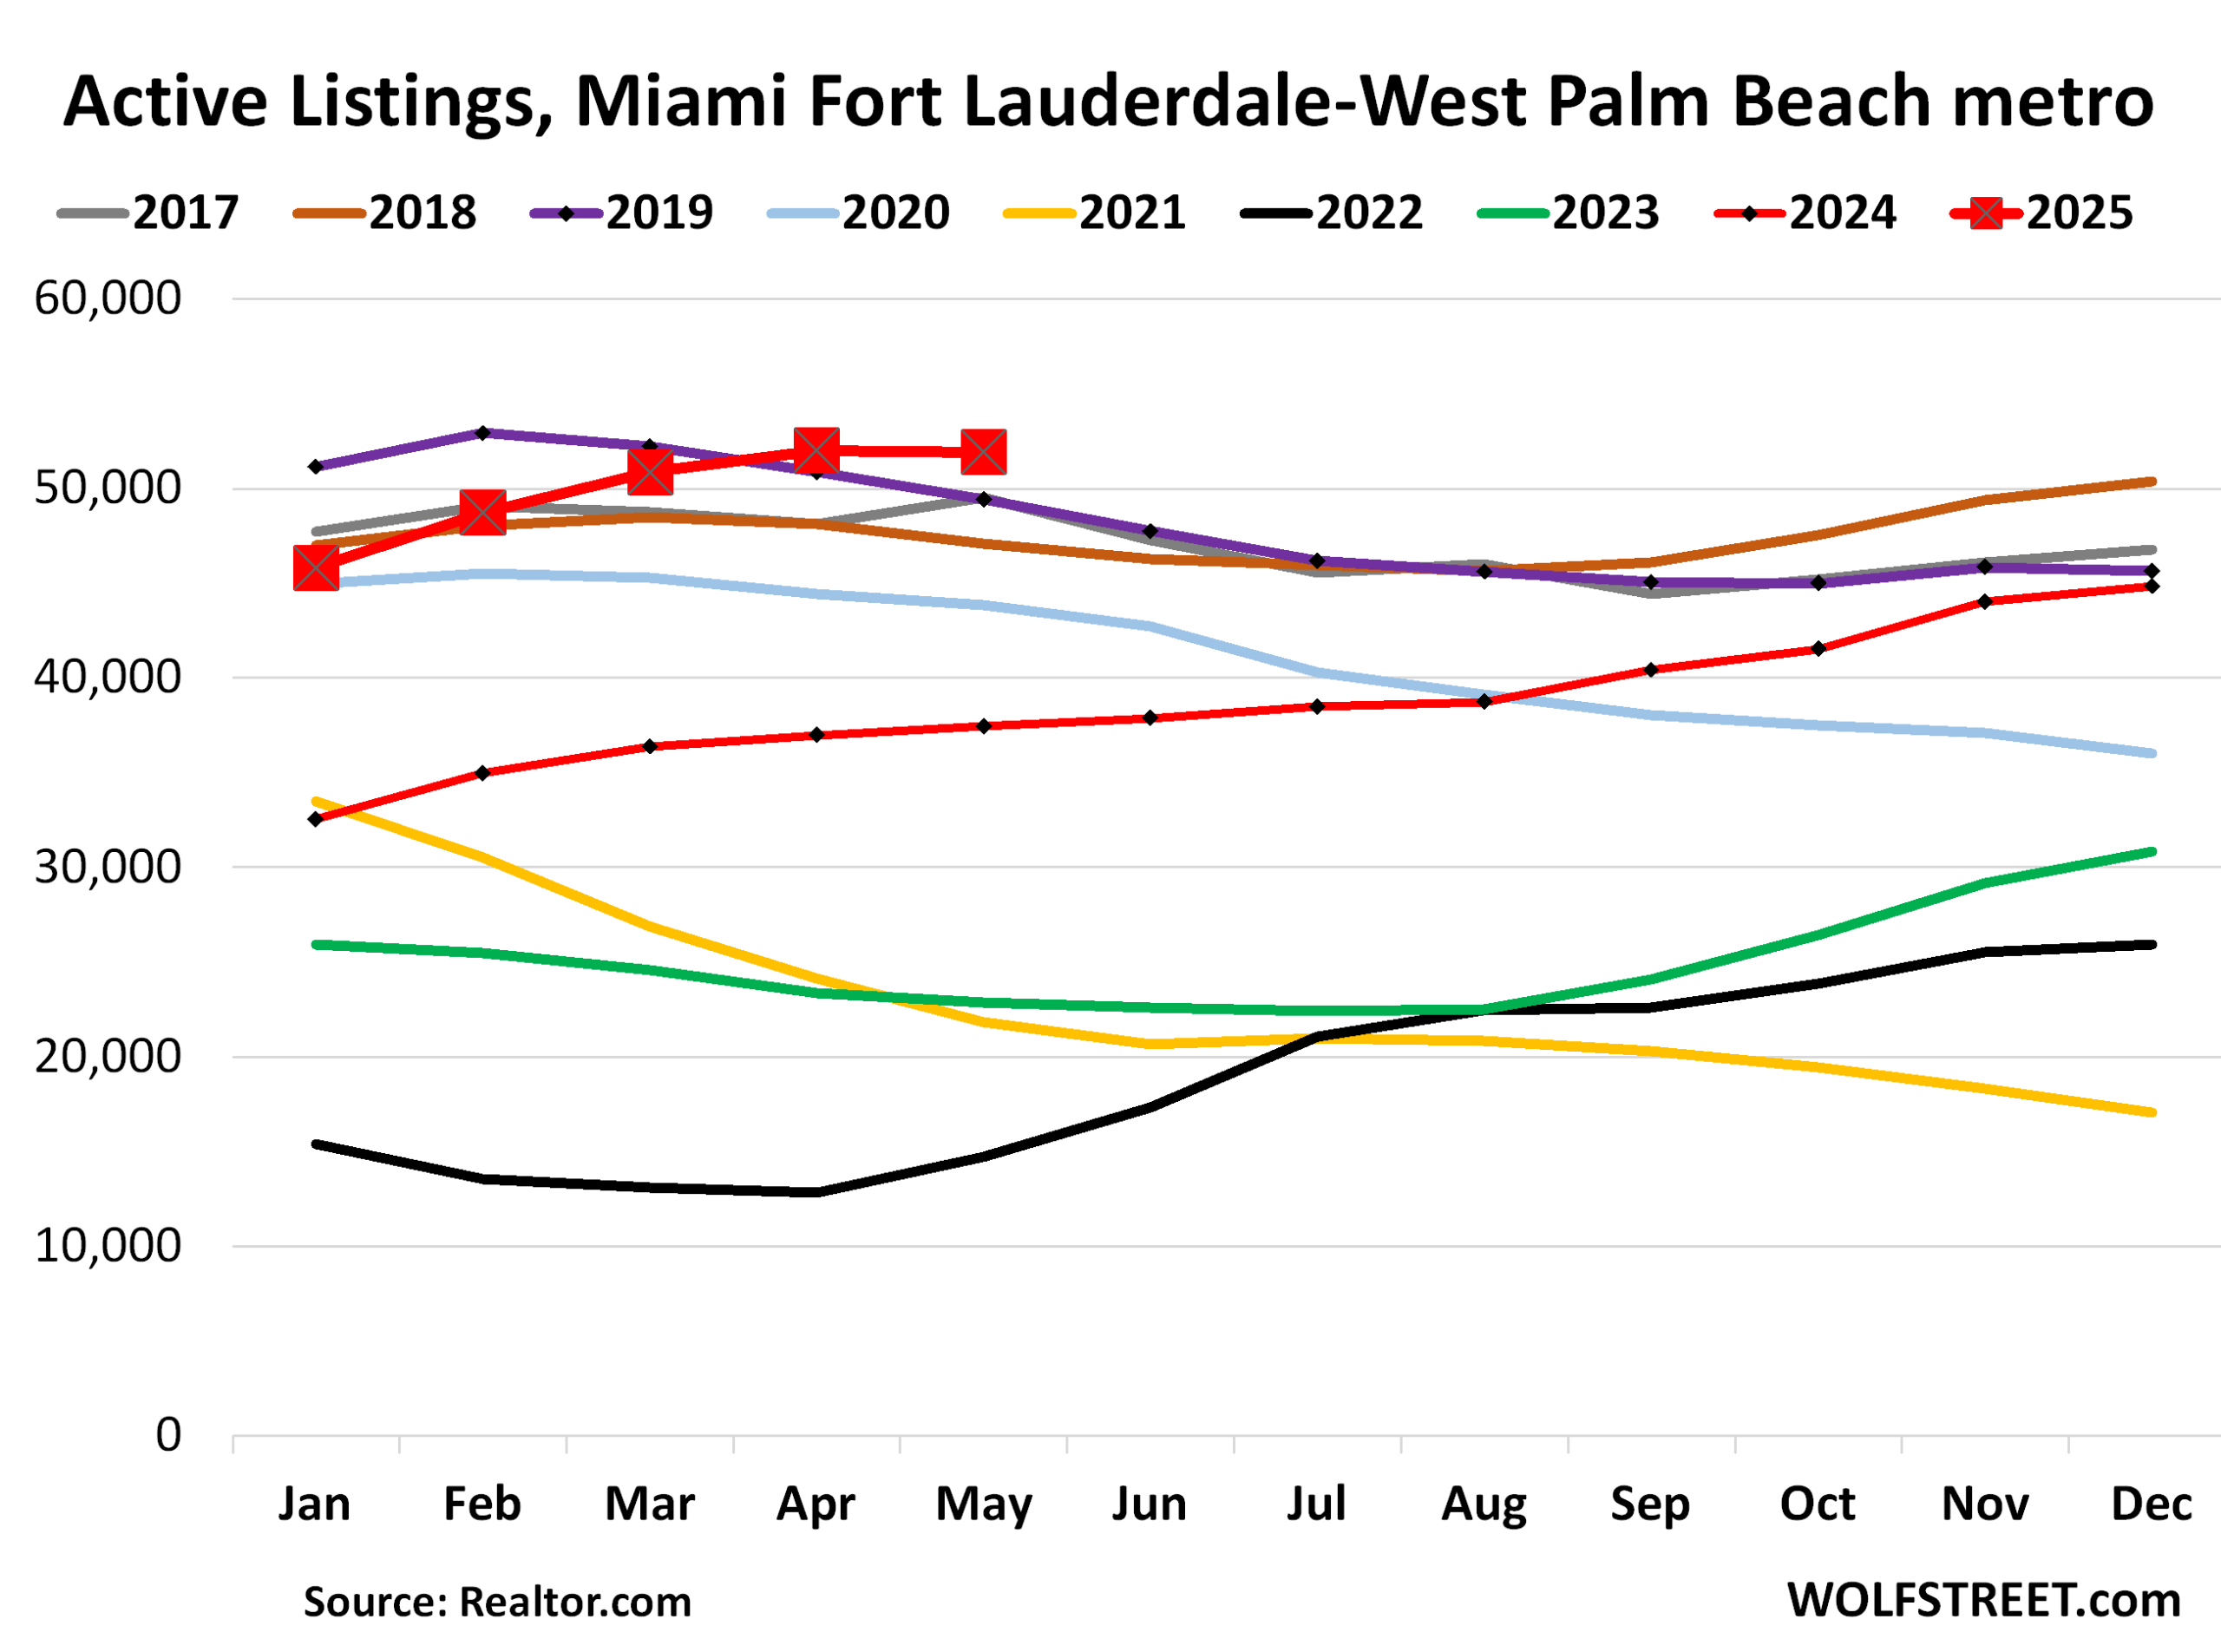
Miami-Fort Lauderdale-West Palm Beach metro: Active listings jumped by 39% year-over-year in May, to 51,901 homes, the highest May in the data by realtor.com going back to 2016.
Compared to May 2019, inventory was 5% higher. Compared to May 2018, it was 10% higher.
In that respect – compared to 2019 or 2018 – the inventory in the Miami metro has not ballooned as far as in other Florida metros, where inventories compared to those years are up by 30%, 40%, 50% or even by 80%, such as in the Lakeland-Winter Haven metro. More on those in a moment.
In markets with some distinct seasonality during the pre-covid years, we’re using these stacked charts that allow us to look beyond the seasonality. In markets with no distinct seasonality during the pre-covid year, we’ll use a classic line chart.
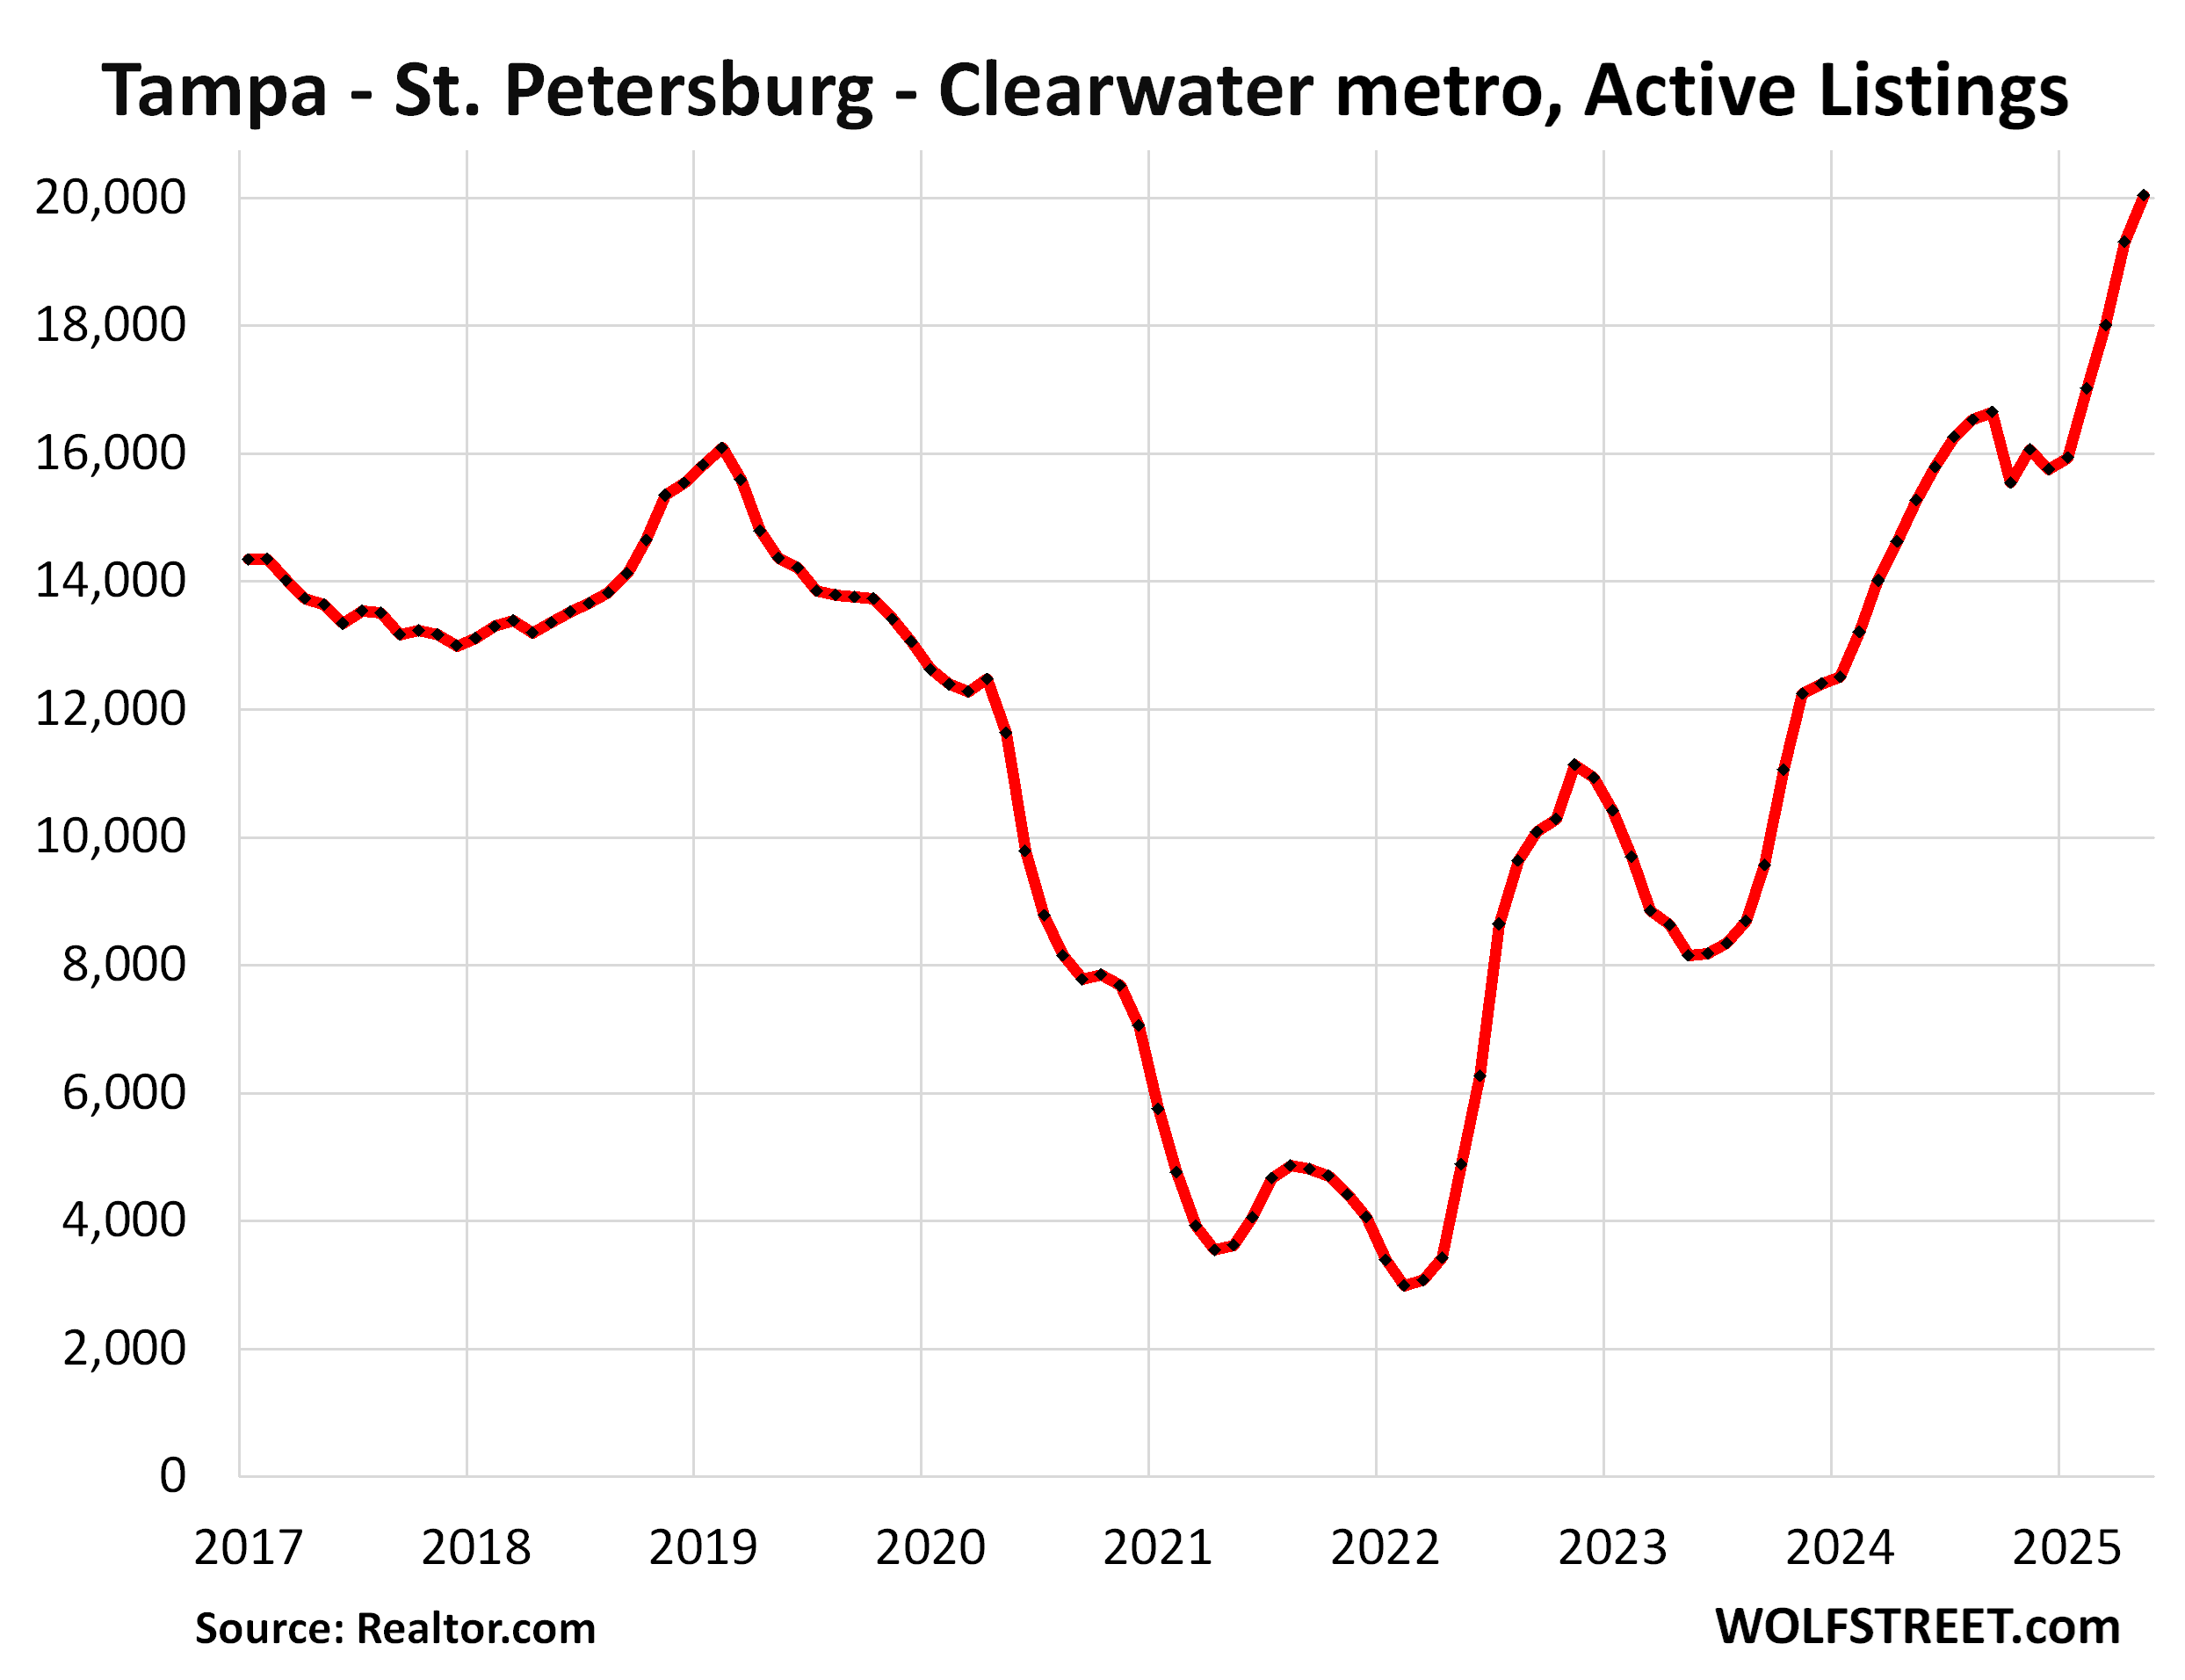
Tampa-St. Petersburg-Clearwater metro: Active listings jumped by 31% year-over-year in May, to 20,033 homes, the highest in the data from realtor.com going back to 2016.
Compared to May 2019, inventory was 40% higher. Compared to May 2018, inventory was 50% higher.
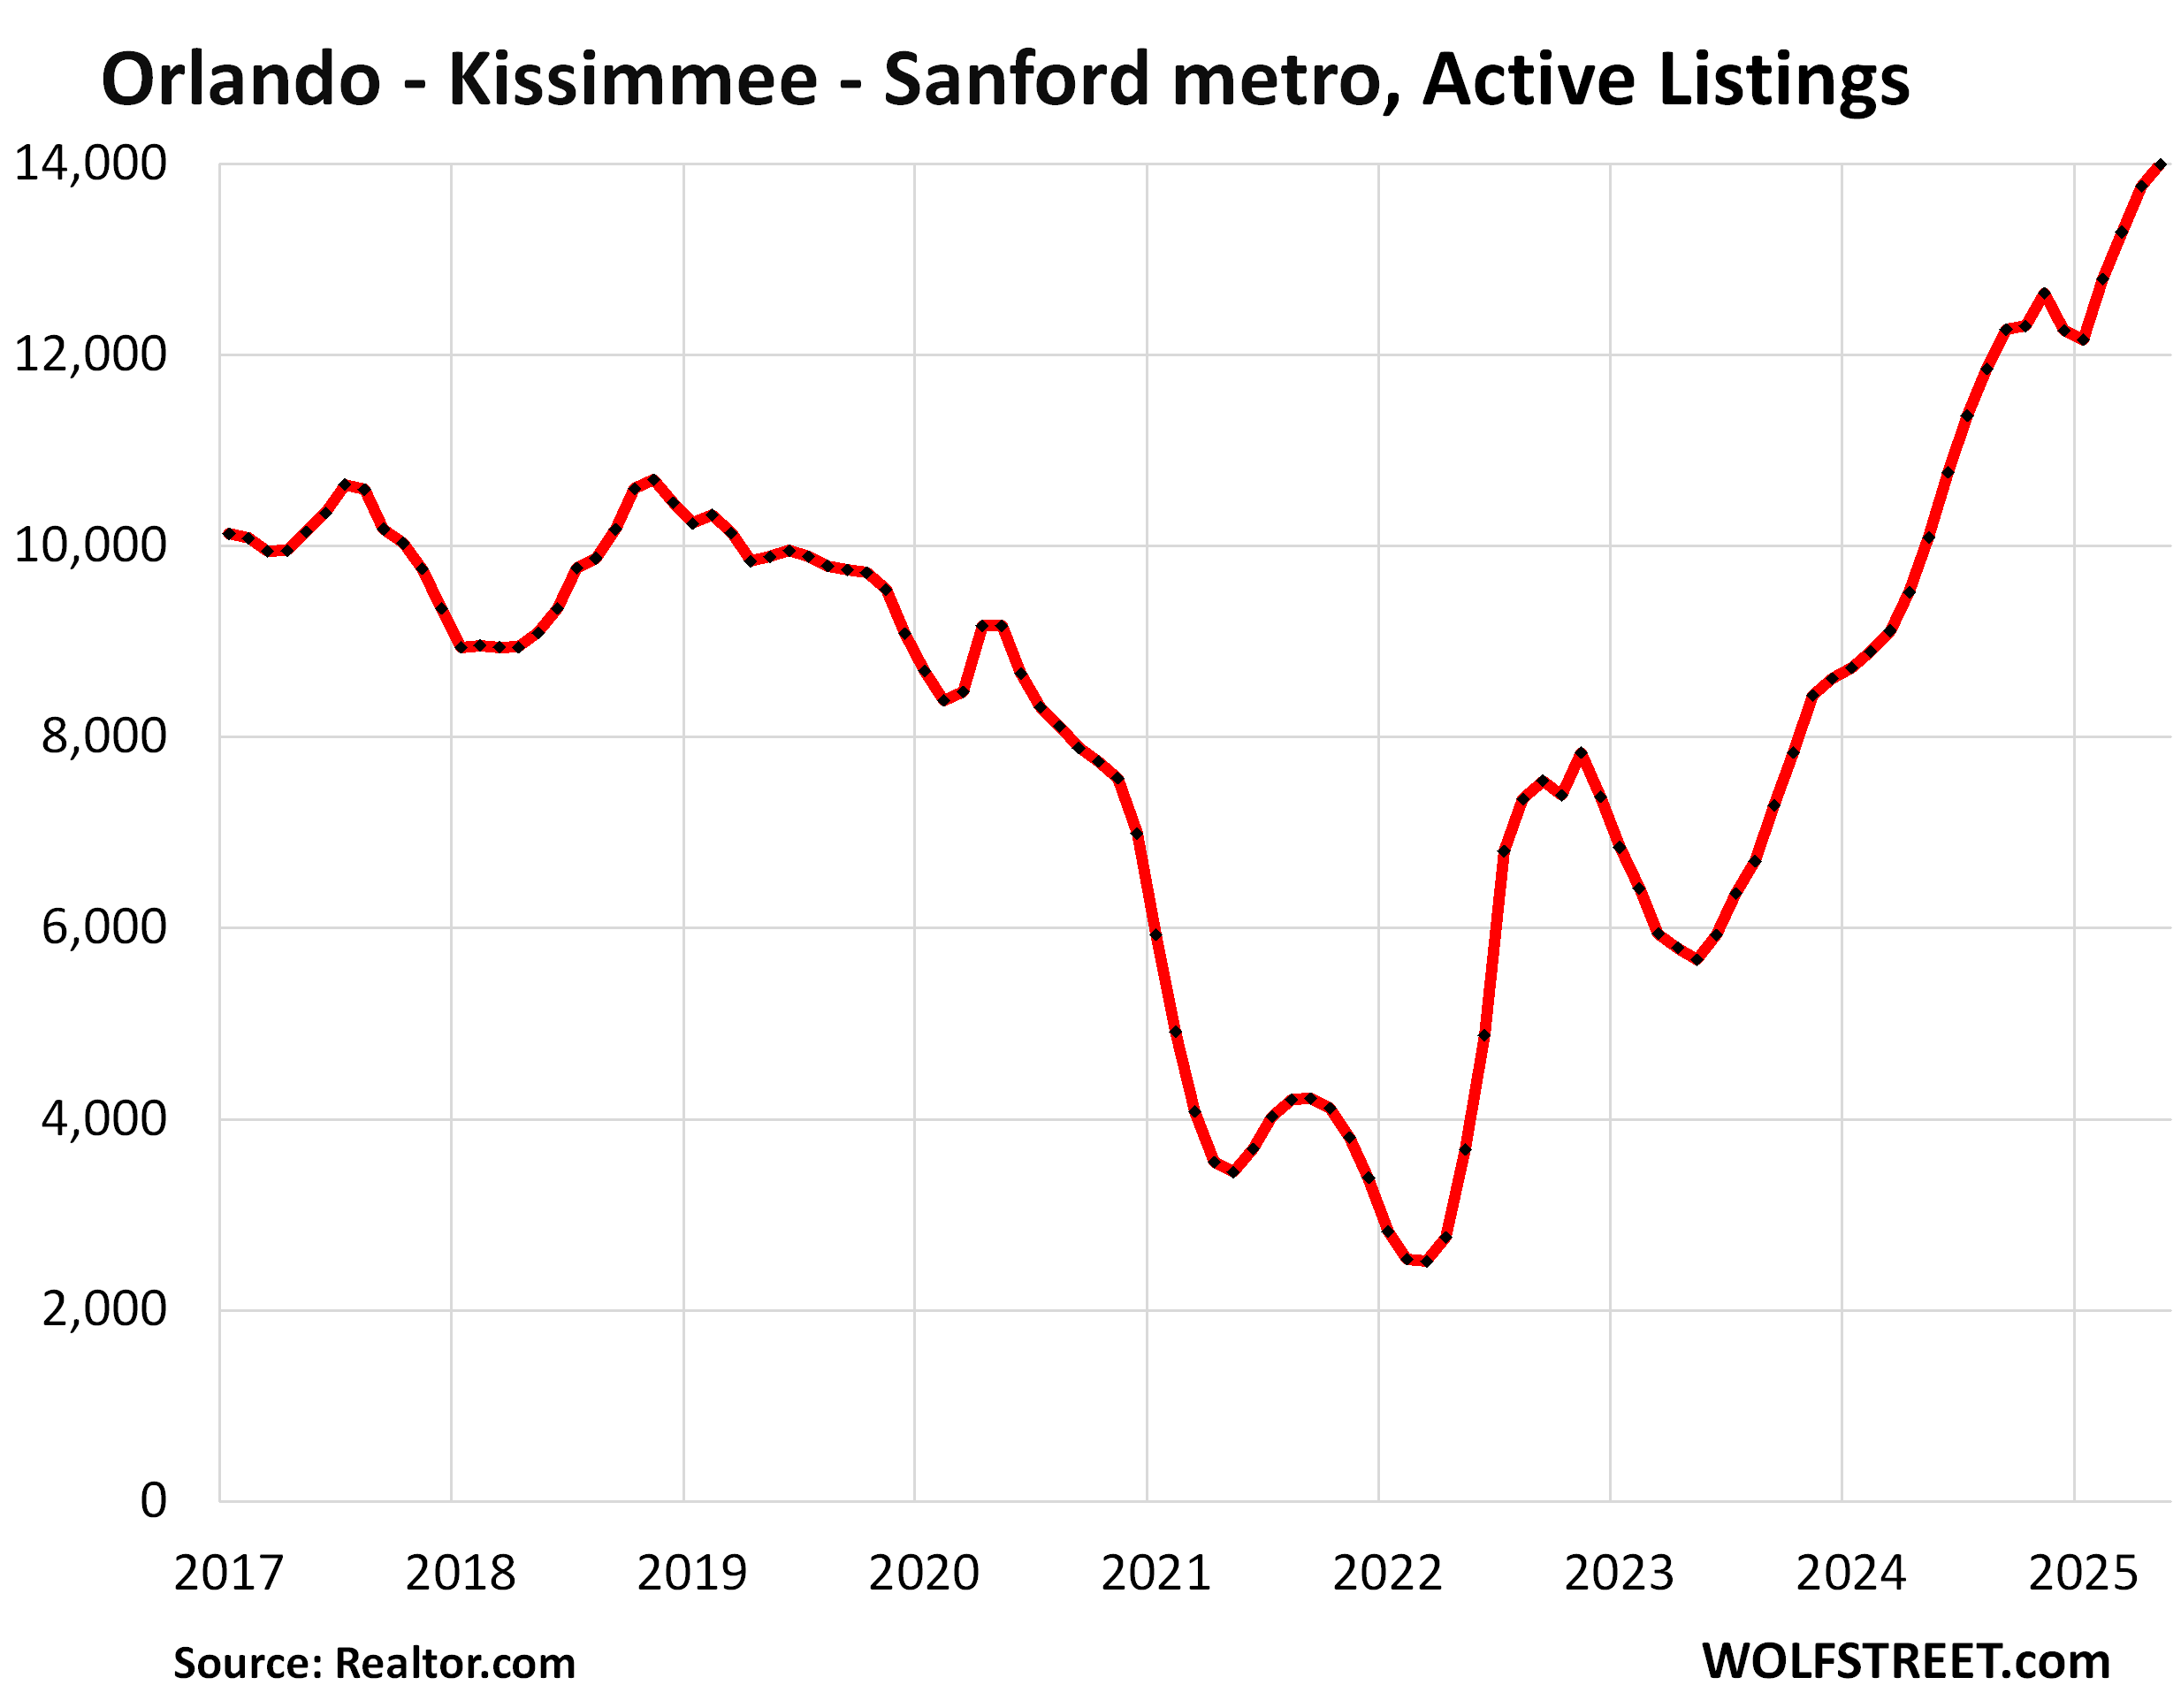
Orlando-Kissimmee-Sanford metro: Active listings spiked by 39% year-over-year in May, to 13,994 homes, by far the highest in the data from realtor.com going back to 2016.
Compared to May 2019, inventory was up by 42%. Compared to May 2018, it was up by 54%.
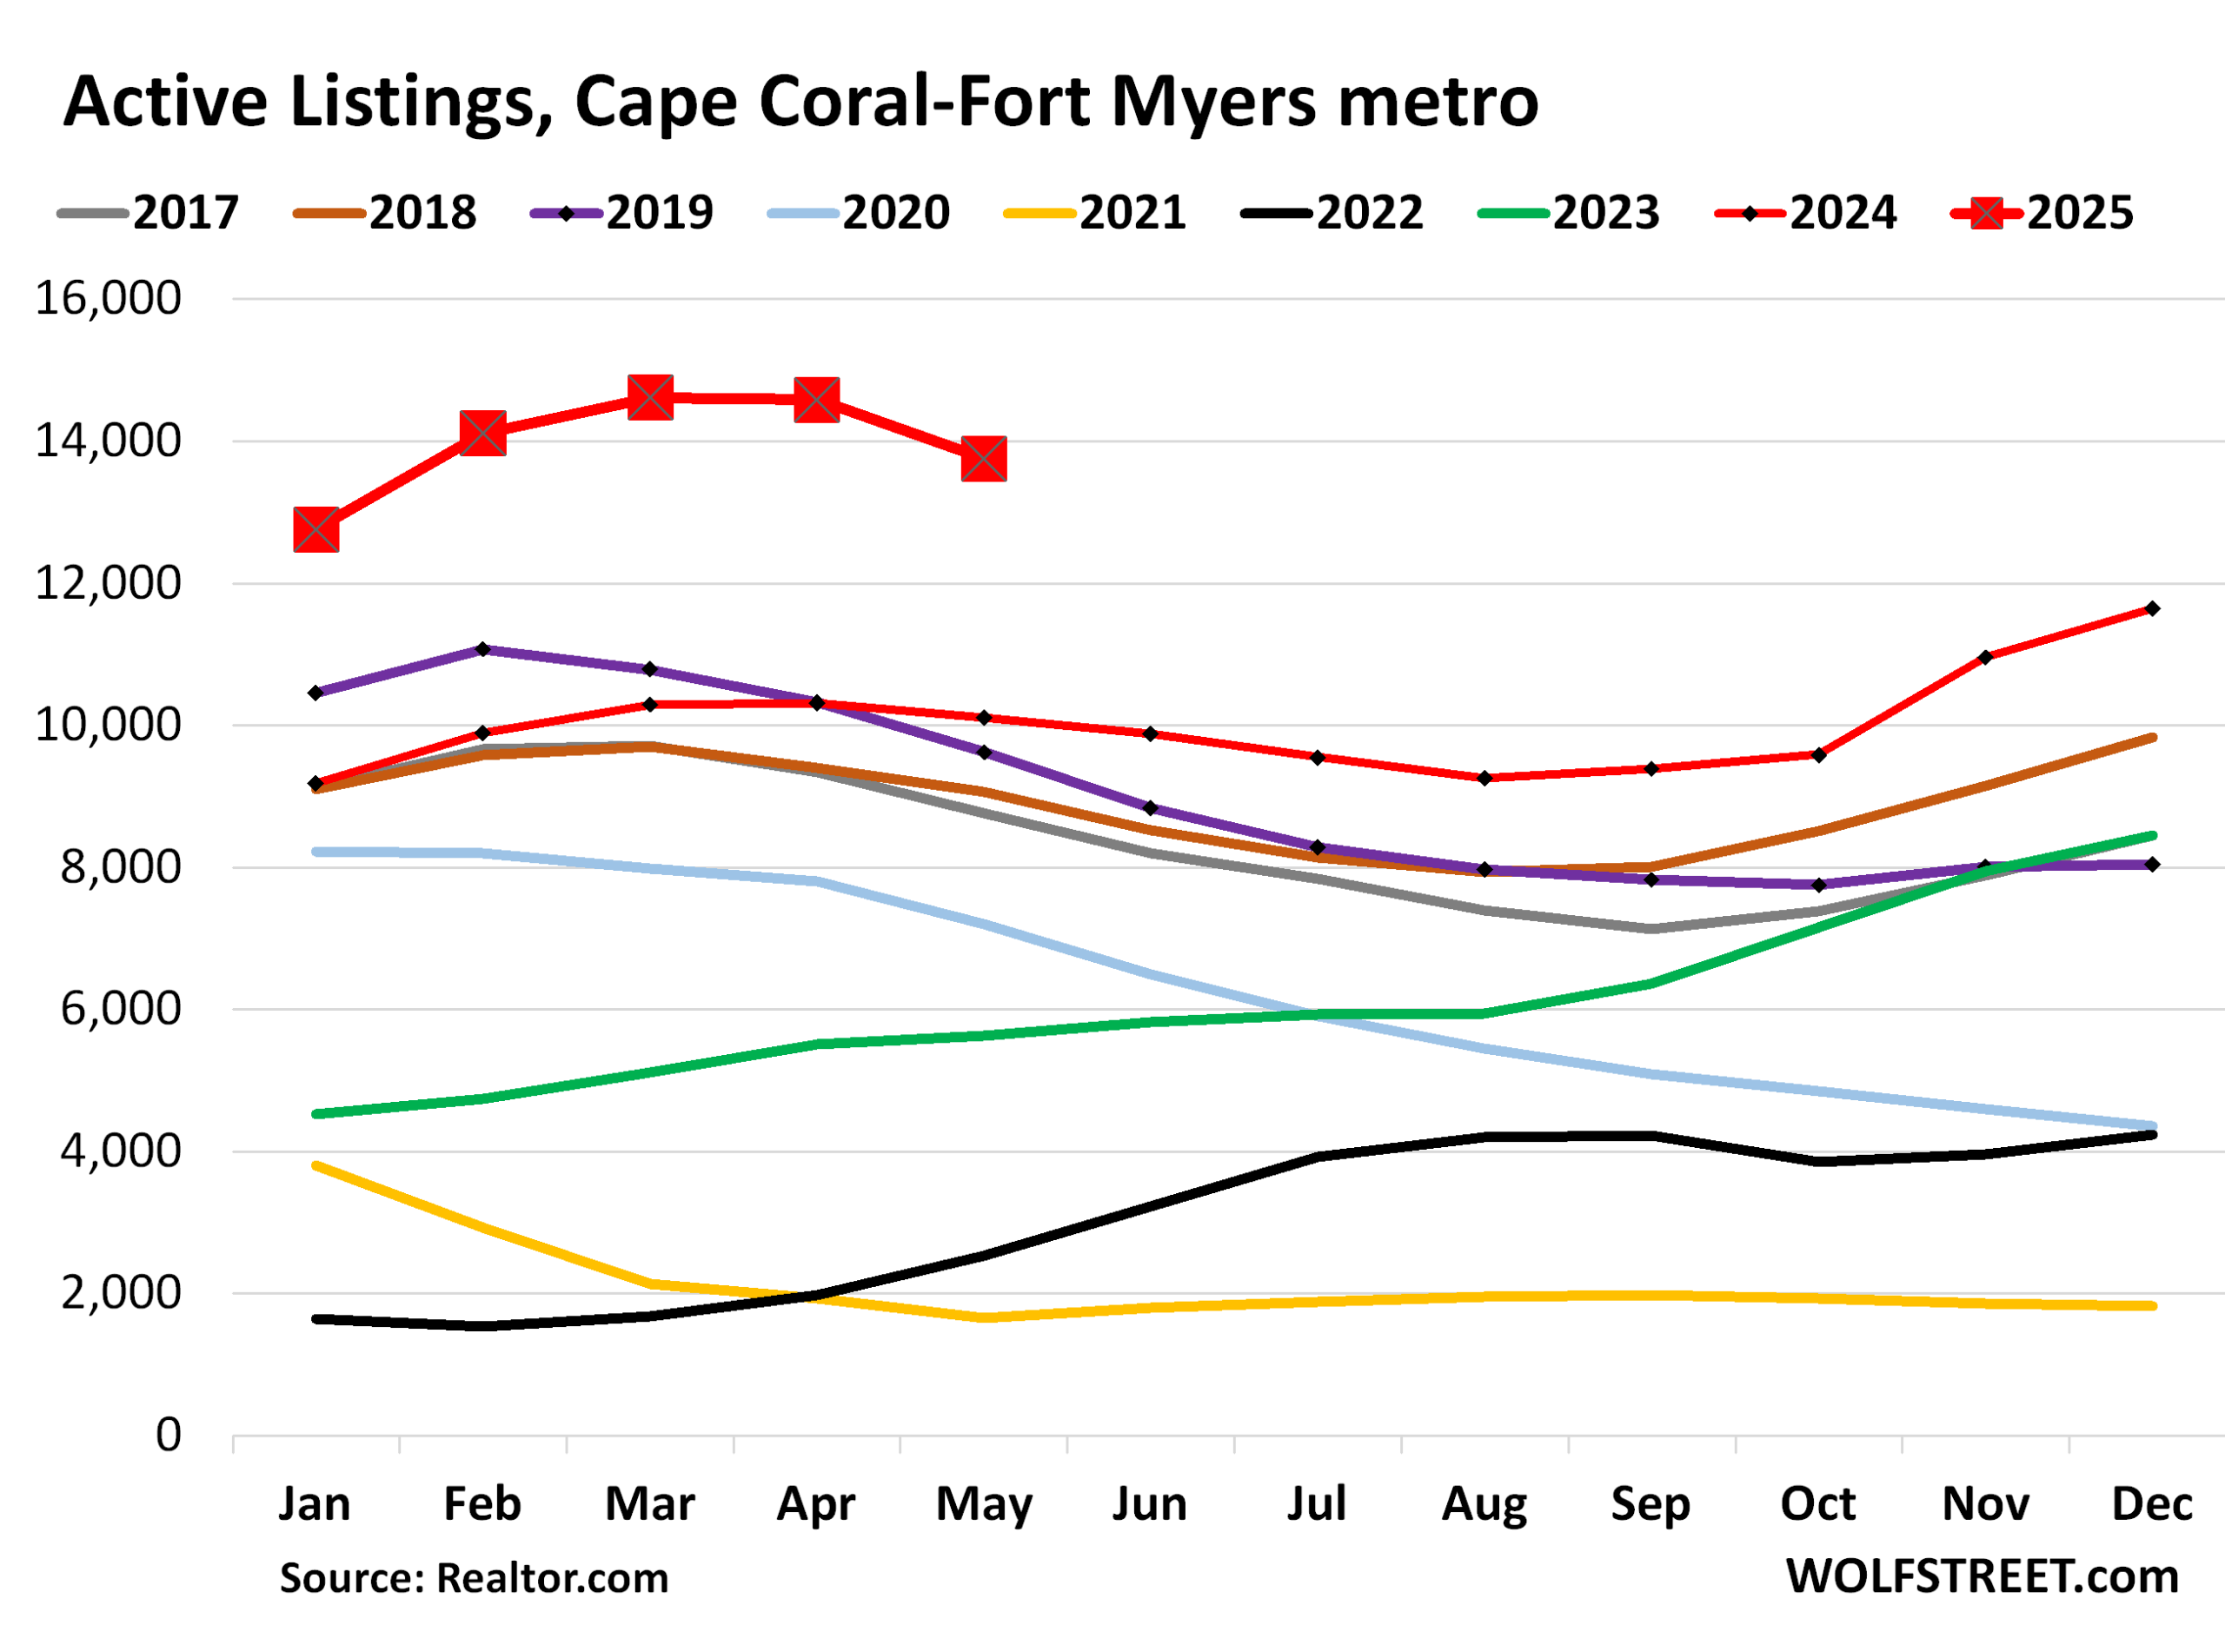
Cape Coral-Fort Myers metro: Active listings spiked by 36% year-over-year in May, to 13,757 homes, the highest May in the data from realtor.com going back to 2016.
Compared to May 2019, inventory was 36% higher. Compared to May 2018, it was 52% higher.
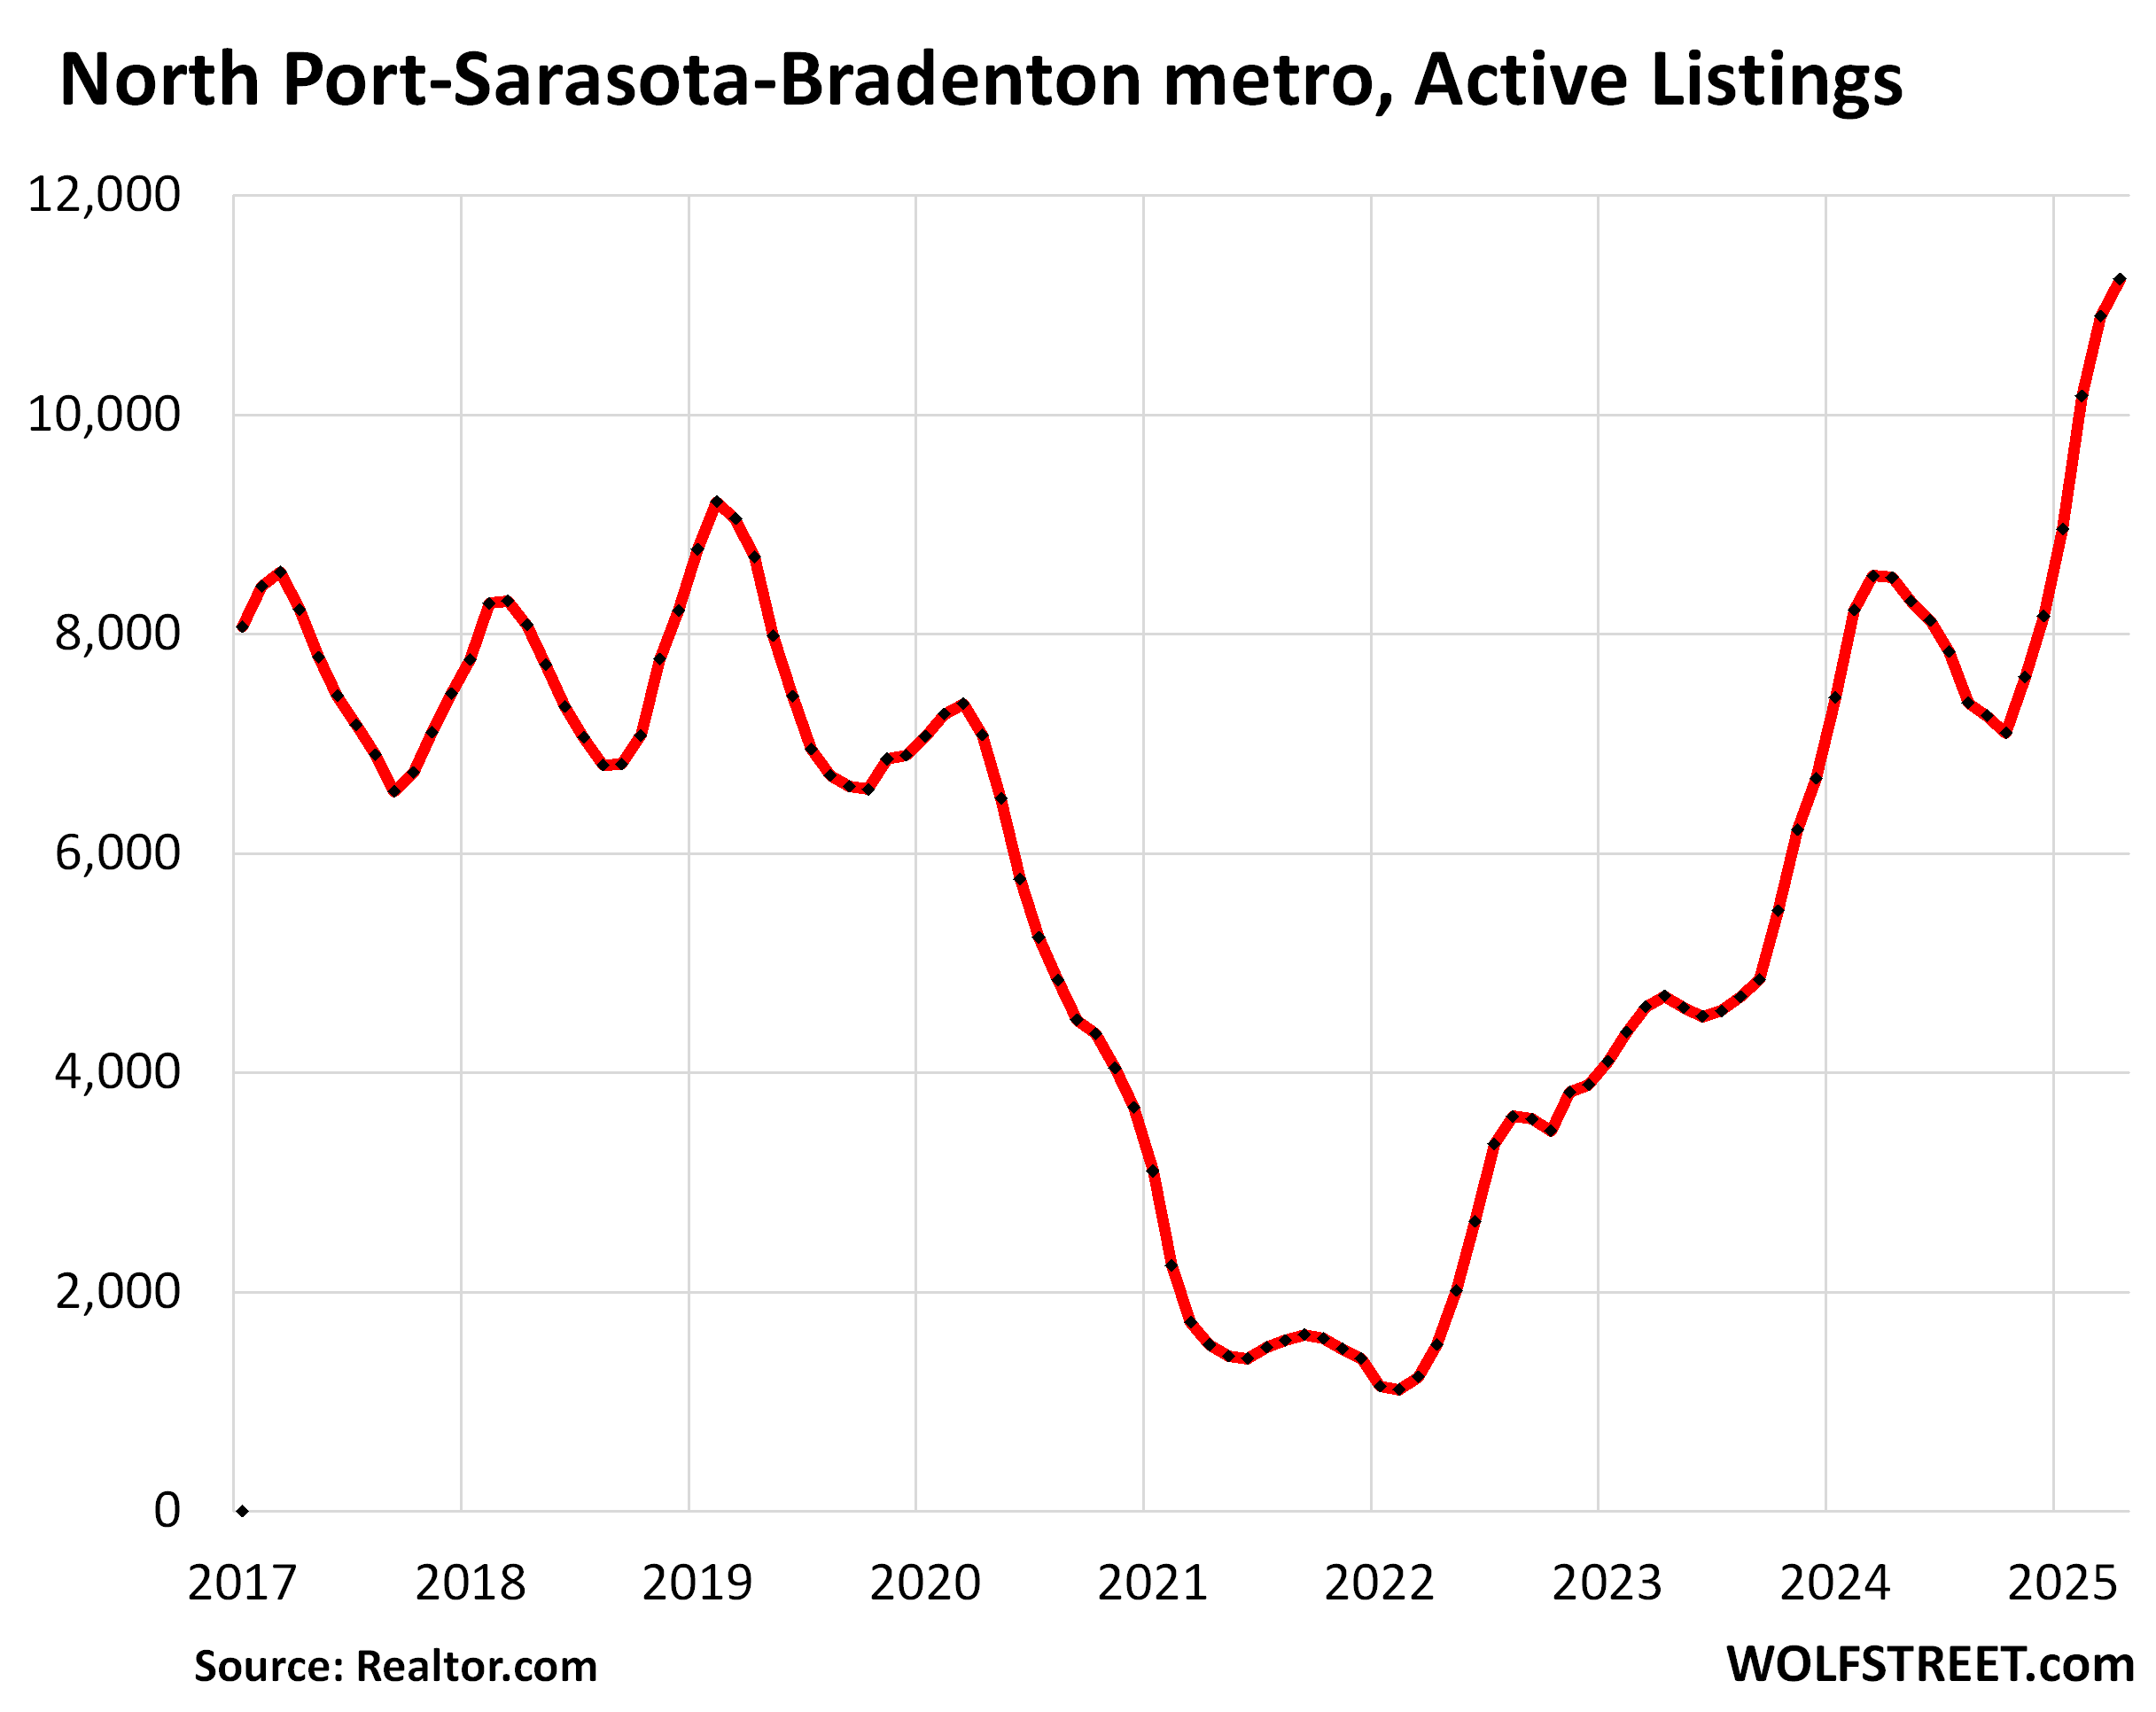
North Port-Sarasota-Bradenton metro: Active listings spiked by 31% year-over-year in May, to 10,870 homes, the highest May in the data from realtor.com.
Compared to May 2019, inventory was 36% higher, compared to May 2018, it was 41% higher.
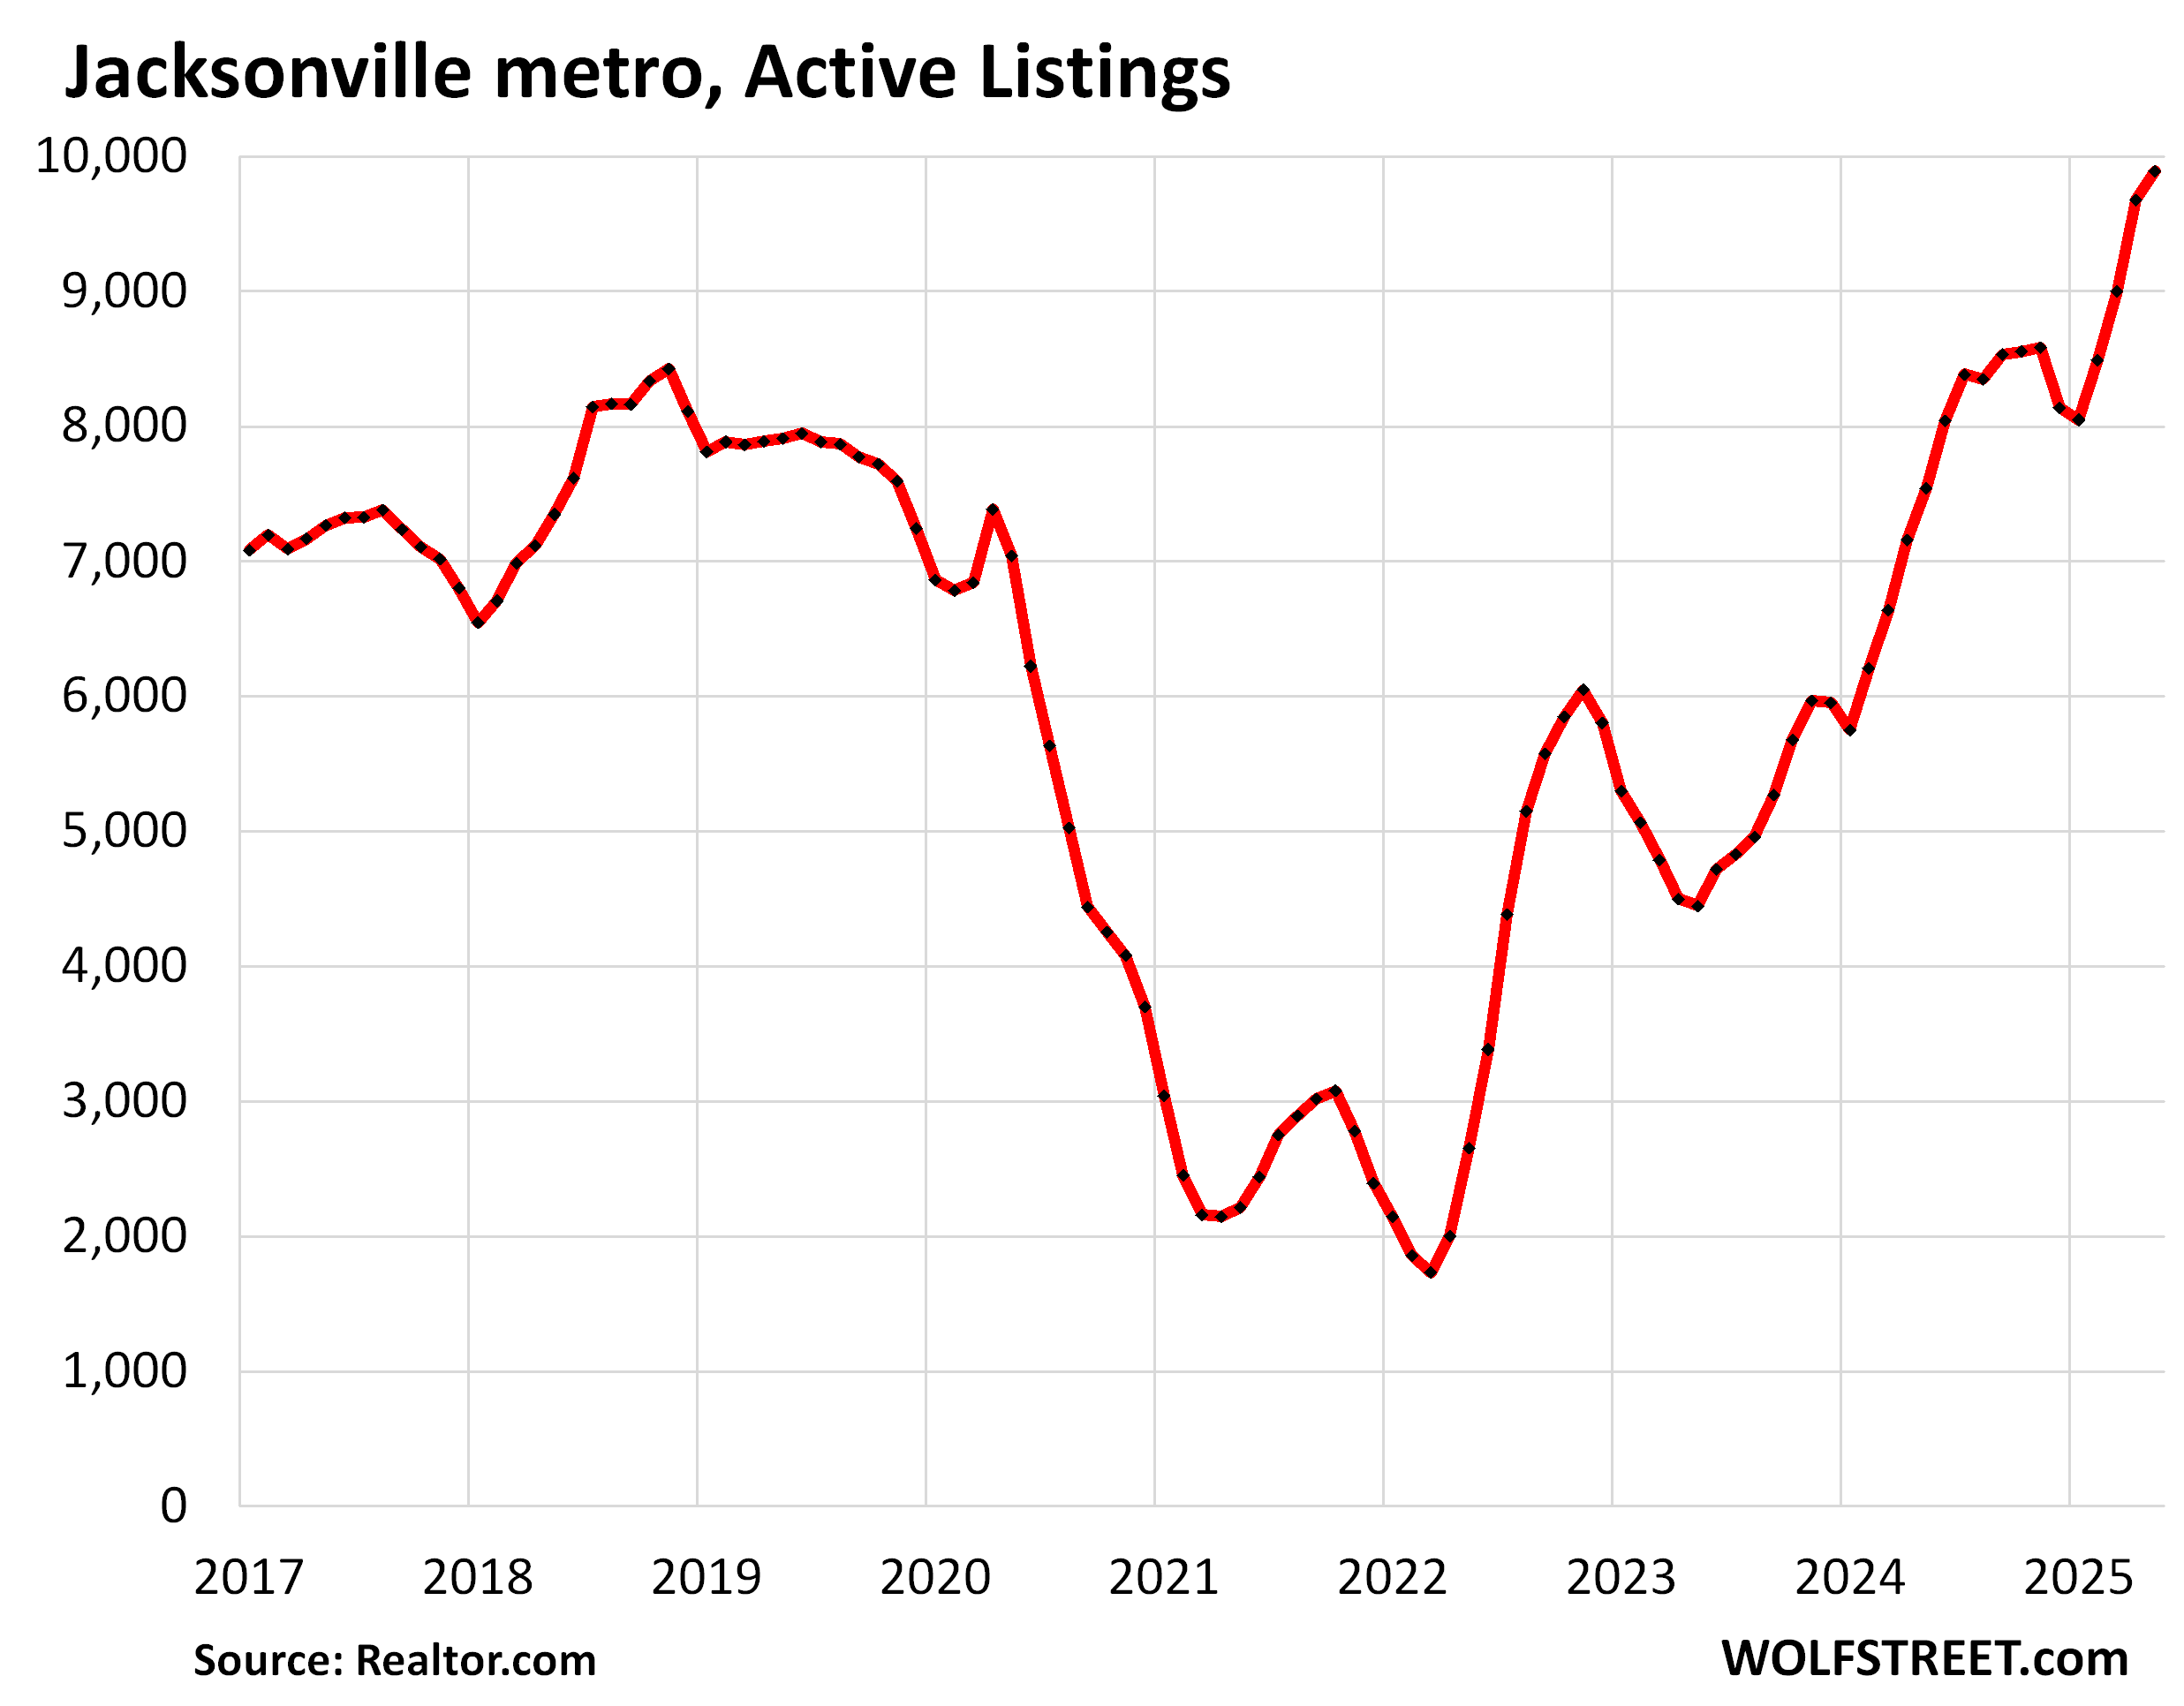
Jacksonville metro: Active listings spiked by 31% year-over-year in May, to 9,893 homes, the highest in the data from realtor.com.
Compared to May 2019, inventory was up by 25%. Compared to May 2018, it was up by 35%.
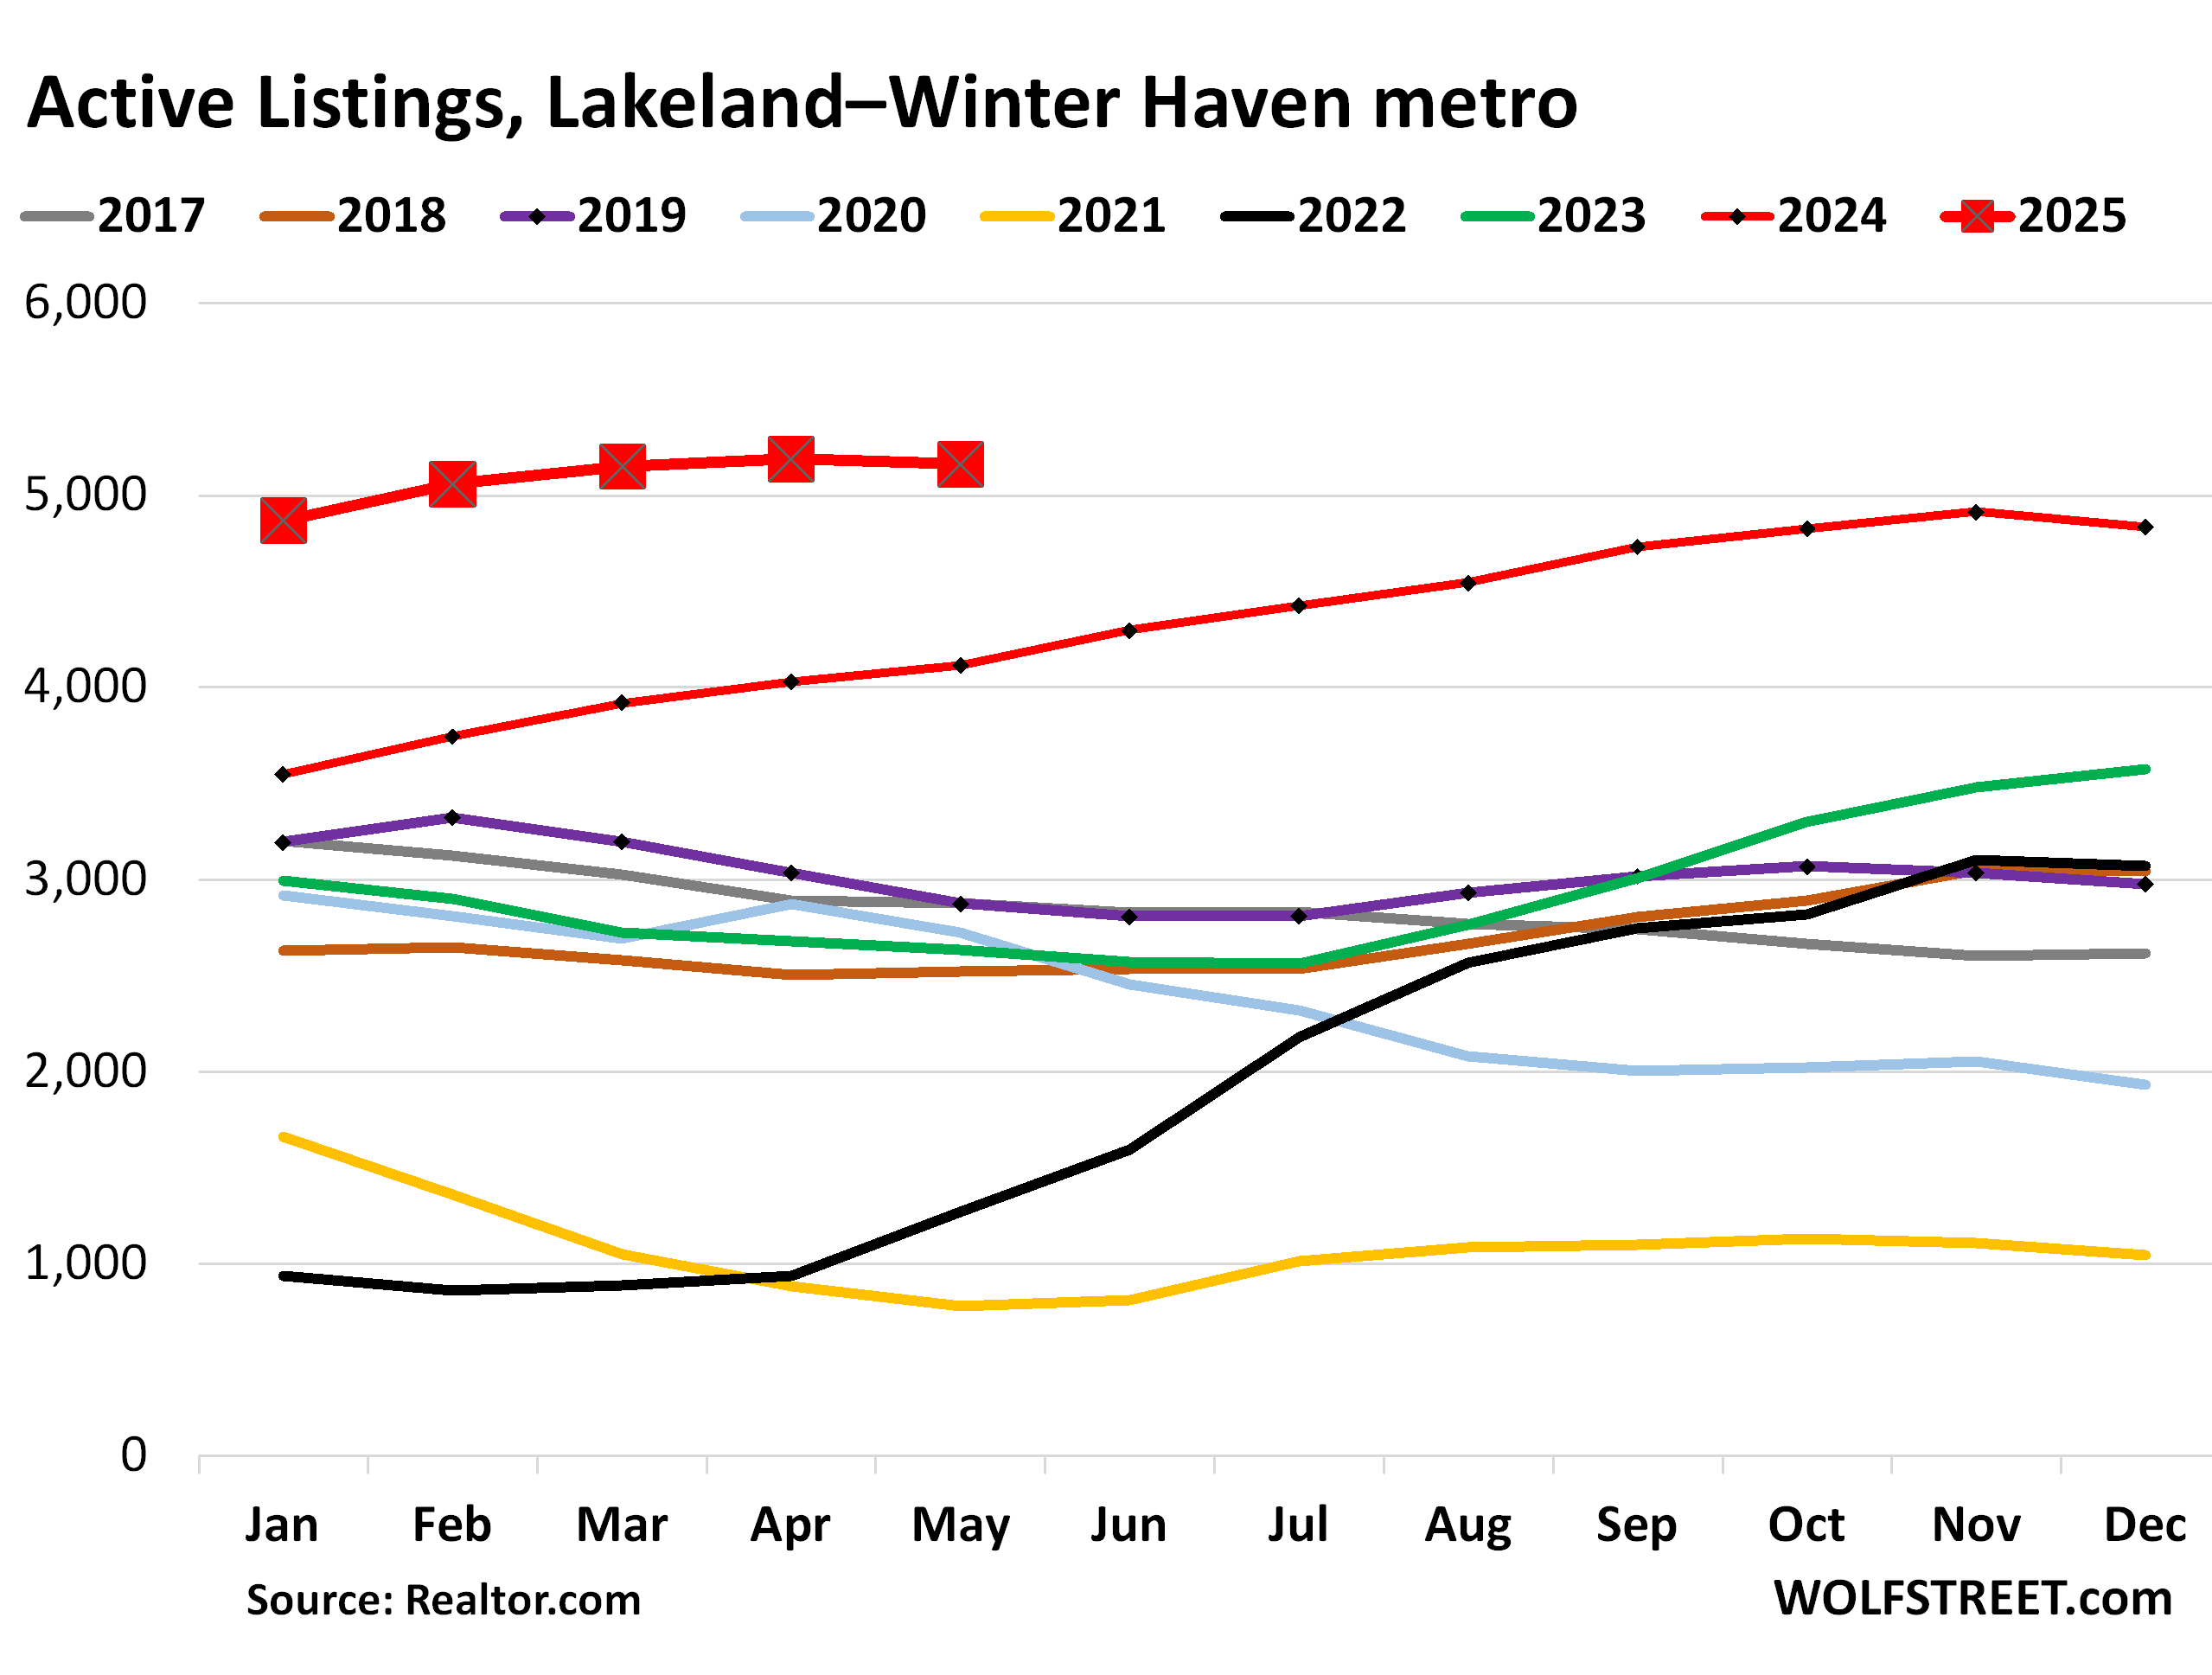
Lakeland-Winter Haven metro: Unsold inventory jumped by 25% year-over-year in May, to 5,161 homes, the highest May in the data from realtor.com going back to 2016.
Compared to May 2019, inventory was 80% higher, compared to May 2018, it was 63% higher.
There’s no problem here that prices cannot solve.
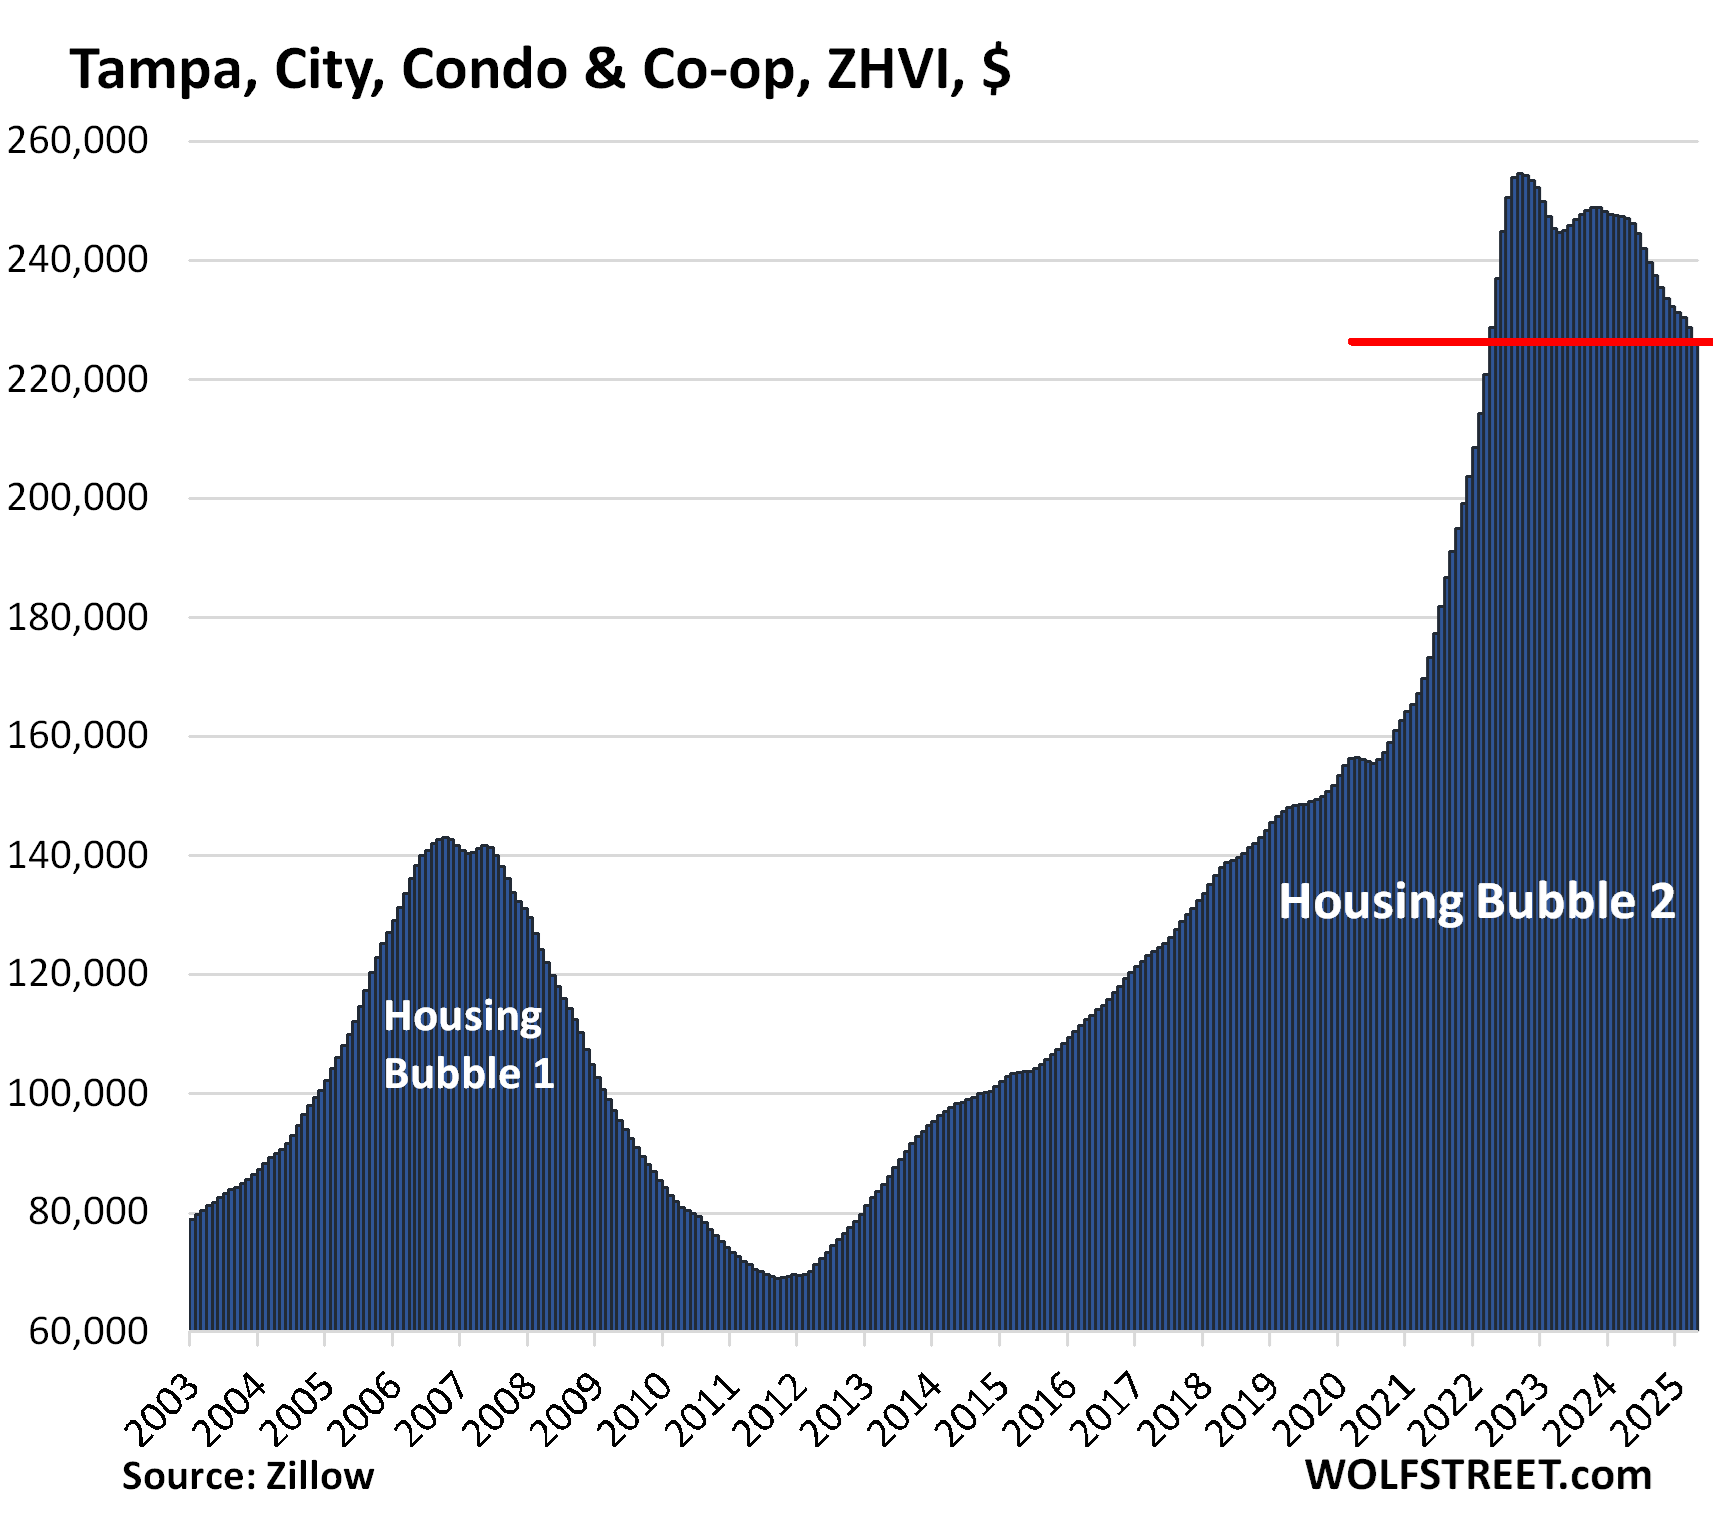
Prices exploded, and now they’re way too high. For example, the price of mid-tier condos in the Tampa metro spiked by 65% in two years from mid-2020 to the peak in mid-2022, which was totally nuts. Over the 10 years between 2012 and 2022, prices soared by 240%. At some point, demand destruction sets in, one of the most fundamental economic dynamics. And what solves that problem and creates sales activity are lower prices.
Some of that has started to happen. In Tampa, the price of mid-tier condos has dropped by 11% through April from the peak in mid-2022, according to data from the Zillow Home Value Index:
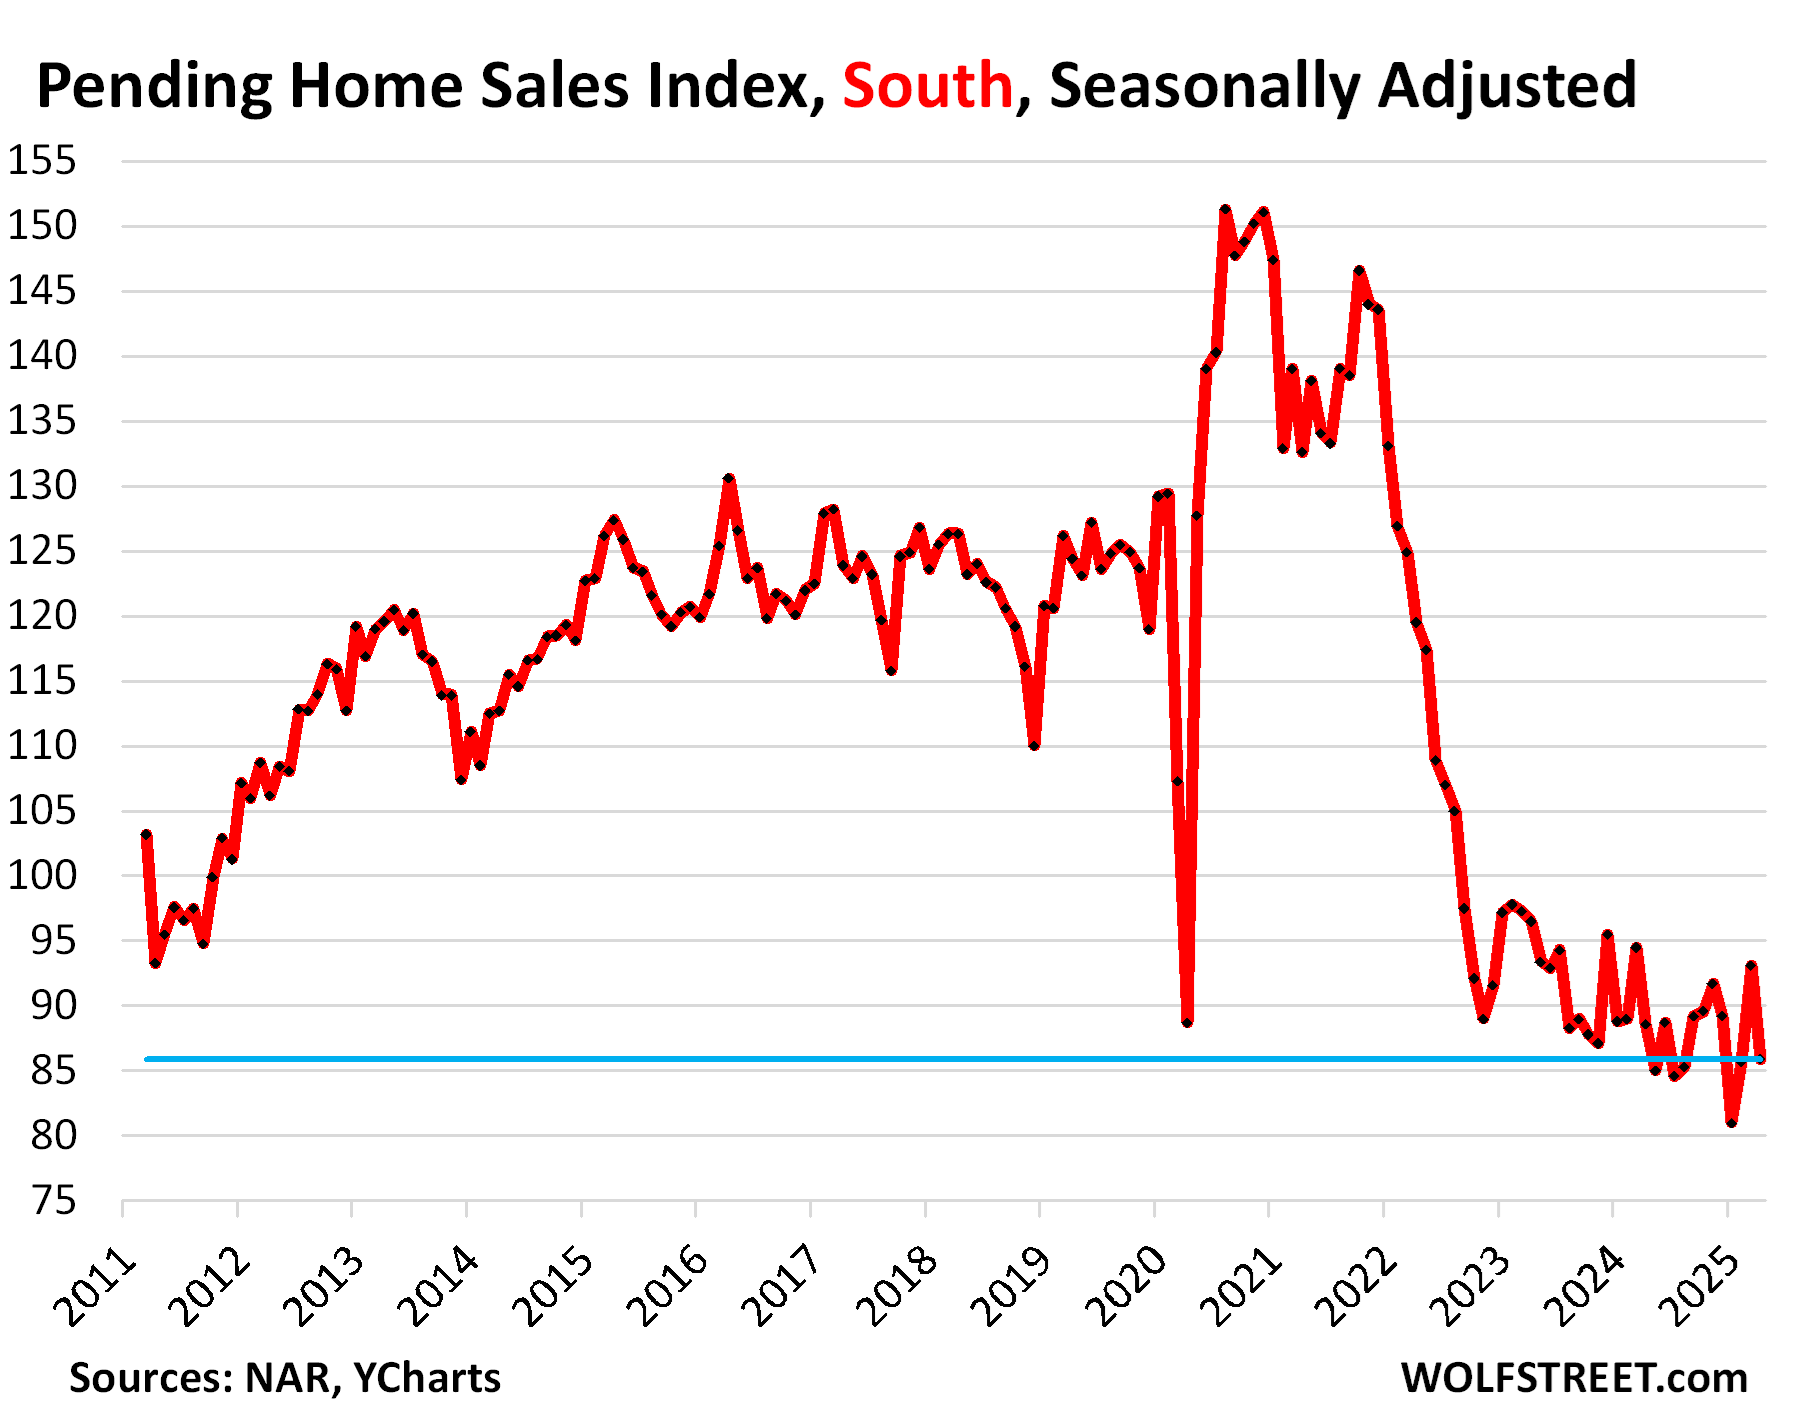
The depts of this demand destruction is quite something. In the South, pending sales of existing homes have plunged, and in April were down by 31% from April 2019, according to data from the National Association of Realtors. But there is no demand issue that a market cannot fix with pricing, that’s what markets are for:
And in case you missed it: Inventory of Homes for Sale in Biggest California Markets Suddenly Piles Up to Highest in Years: Demand Has Collapsed. Active listings YoY: San Diego +66%, Los Angeles +47%, Orange County +79%, Riverside-San Bernadino +51%, San Jose & Silicon Valley +56%; San Francisco metro +40%, Sacramento +55%, Fresno +42%.
Enjoy reading WOLF STREET and want to support it? You can donate. I appreciate it immensely. Click on the mug to find out how:

![]()
The post Inventory of Homes for Sale in the Biggest Florida Metros Piles Up to Highest in Years as Demand Has Withered appeared first on Energy News Beat.
“}]]
