
 [[{“value”:”
No signs yet of tariffs getting passed through to consumers, neither in durable goods nor in clothing and footwear.
By Wolf Richter for WOLF STREET.
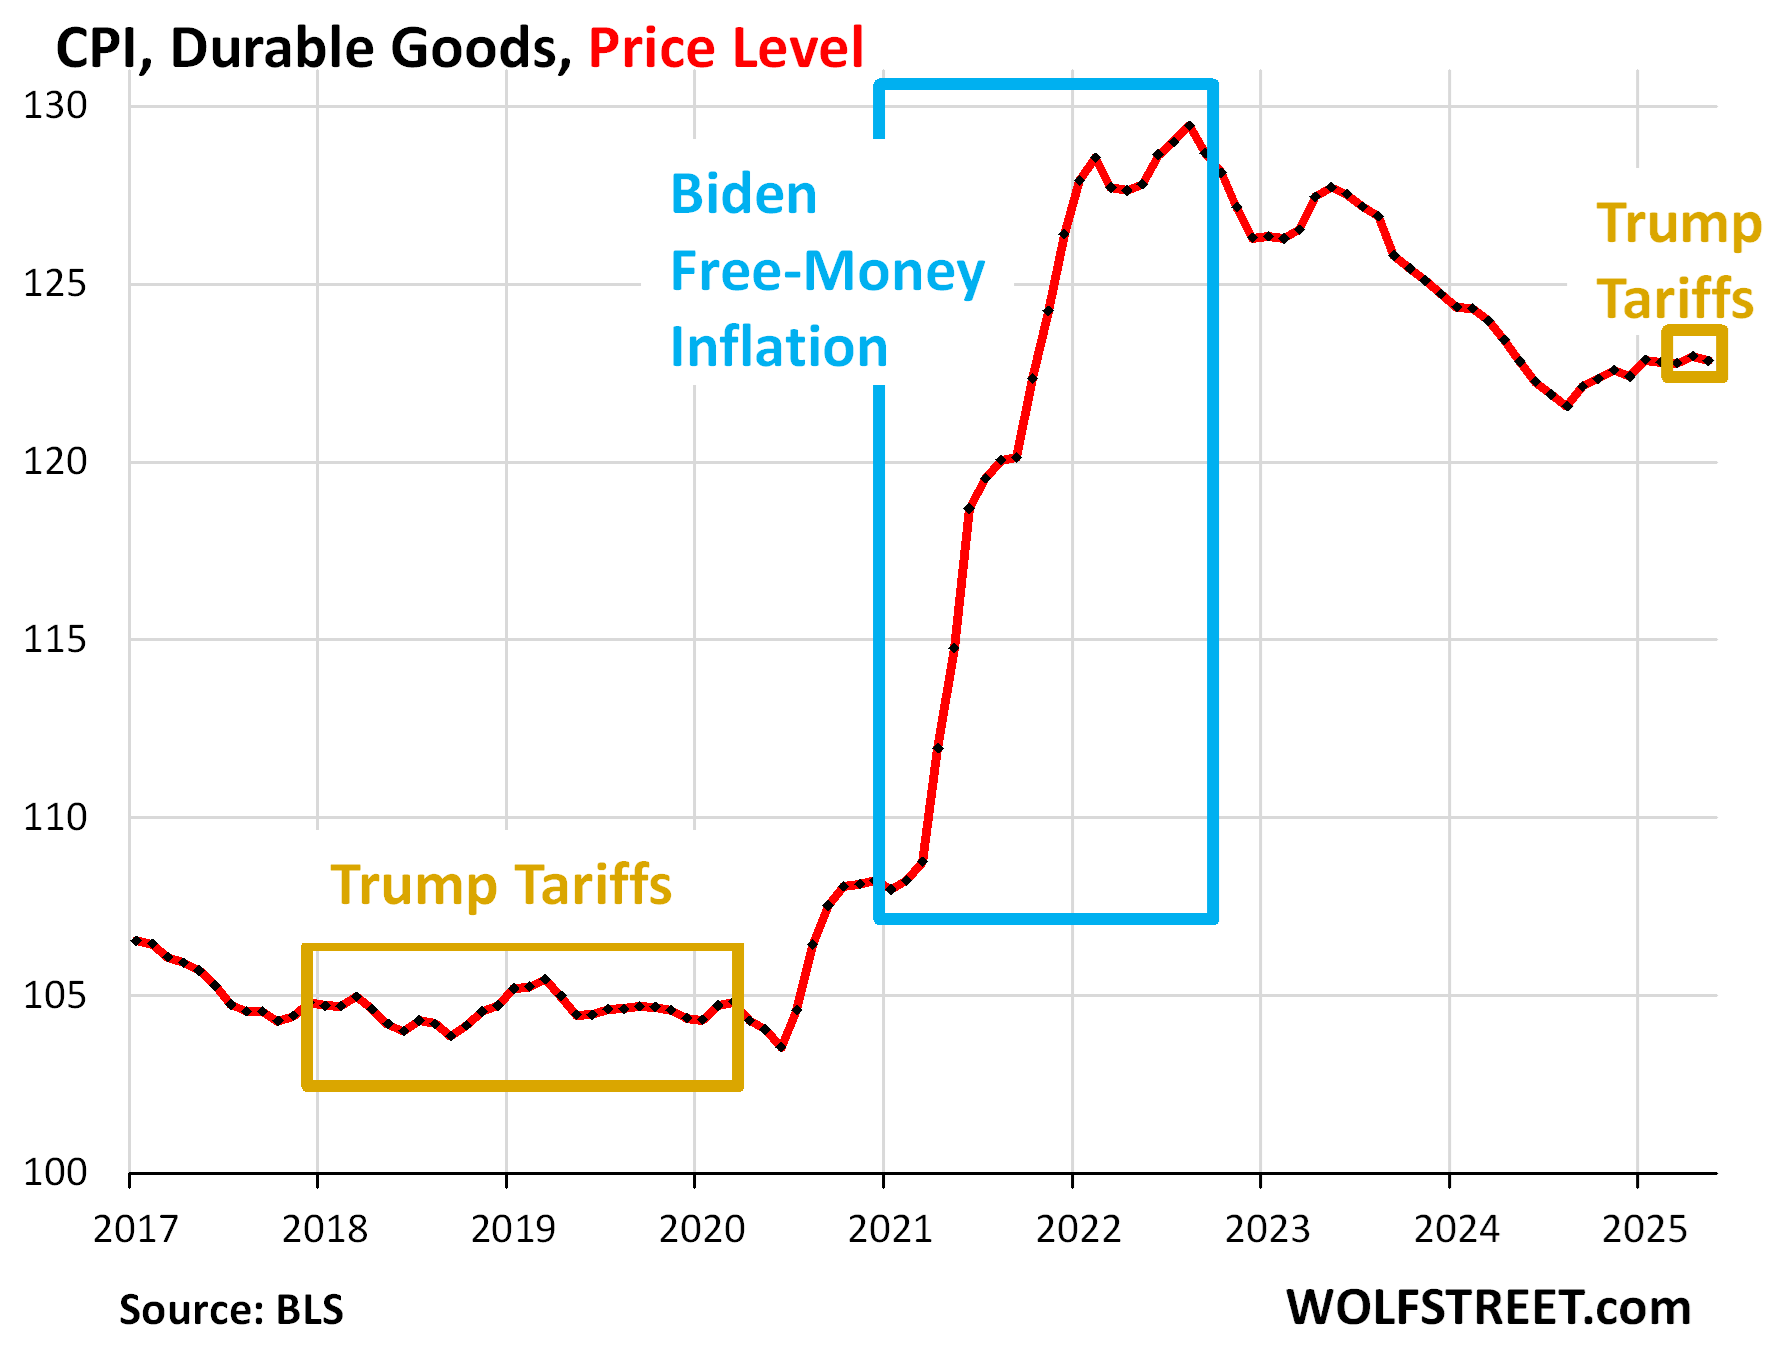
A lot of durable goods sold to consumers are imported or contain imported components or materials subject to the new tariffs. Durable goods are where tariffs being passed on to consumers would show up first. They include new and used vehicles, furniture, appliances, floor coverings, tools, sporting goods, computers, smartphones, audio and video equipment, etc. So we look at the Consumer Price Index for durable goods to see if tariffs – companies paid an additional $23 billion of them in April and May – are getting passed on to consumers, or if companies along the way eat the tariffs with their profits that ballooned during the high inflation era.
The CPI for durable goods dipped by 0.1% month-to-month (-1.3% annualized), seasonally adjusted, according to the Bureau of Labor Statistics today. Year over year, the CPI for durable goods was unchanged, with 0% year-over-year inflation.
As this chart of the price level for durable goods shows, durable goods experienced a huge spike of inflation during the free-money pandemic from mid-2020 through mid-2022 when consumers, powered with free money, were willing to pay whatever, and companies socked it to them. Then, as the free money faded, consumers tired of paying whatever, and companies, faced with slowing sales, had to roll back some of the price increases, and the CPI for durable goods declined through August 2024. But starting in September 2024, prices began to edge higher again through January. And then for the past four months, the CPI for durable goods has remained essentially unchanged.
In terms of the year-over-year percentage change, the CPI for durable goods was unchanged, after a long series of ever smaller negative readings back toward the 0% line.
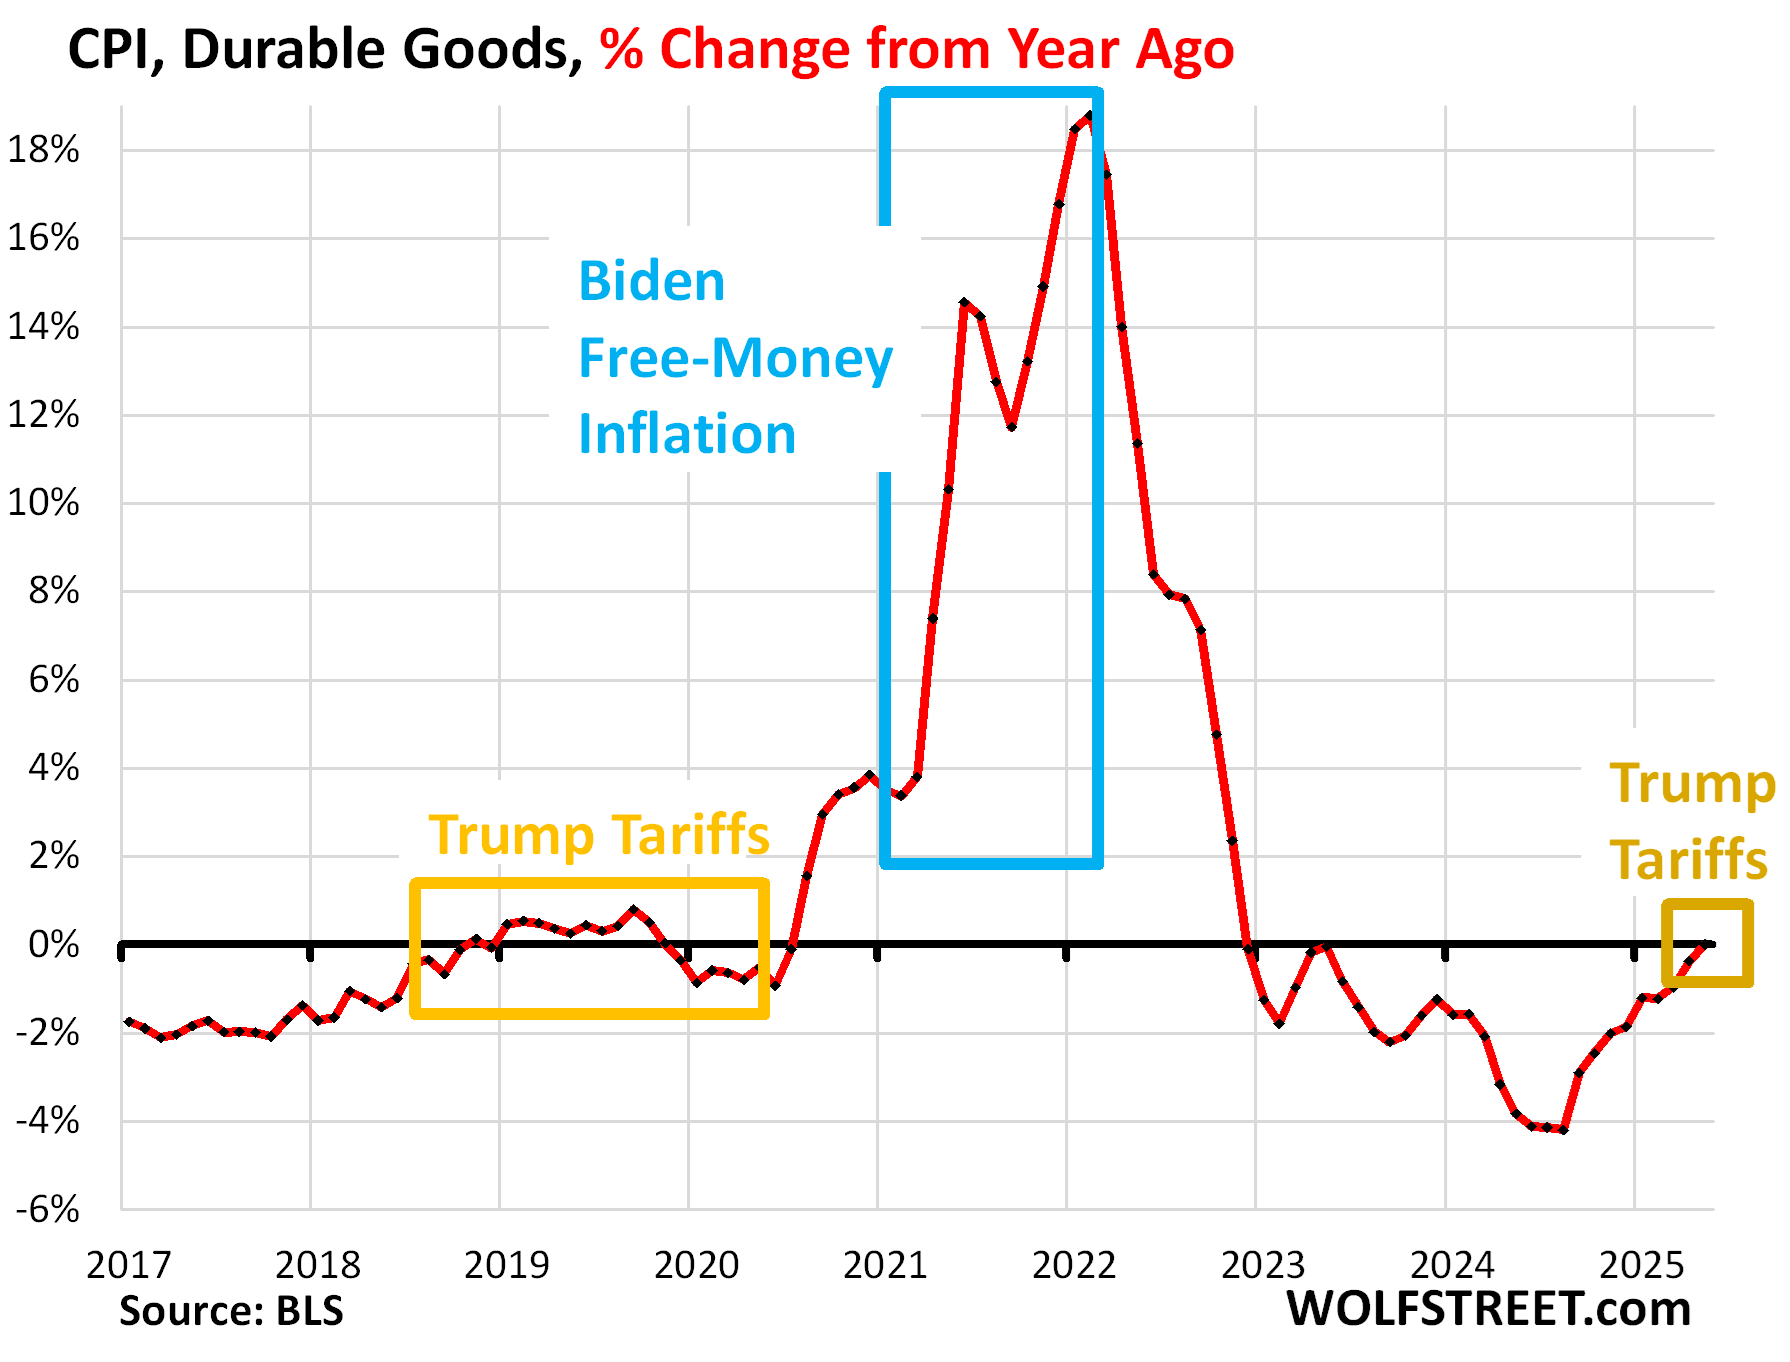
So this is our main monitor of the impact of tariffs on inflation in the consumer prices of goods that are subjected to tariffs.
Obviously, this will take time to play out, it doesn’t happen overnight, and we’ll watch it develop as it moves forward, but so far, there is no sign in the inflation data of tariffs getting passed through to consumers. But the explosion of prices in 2021 and 2022 was historic.
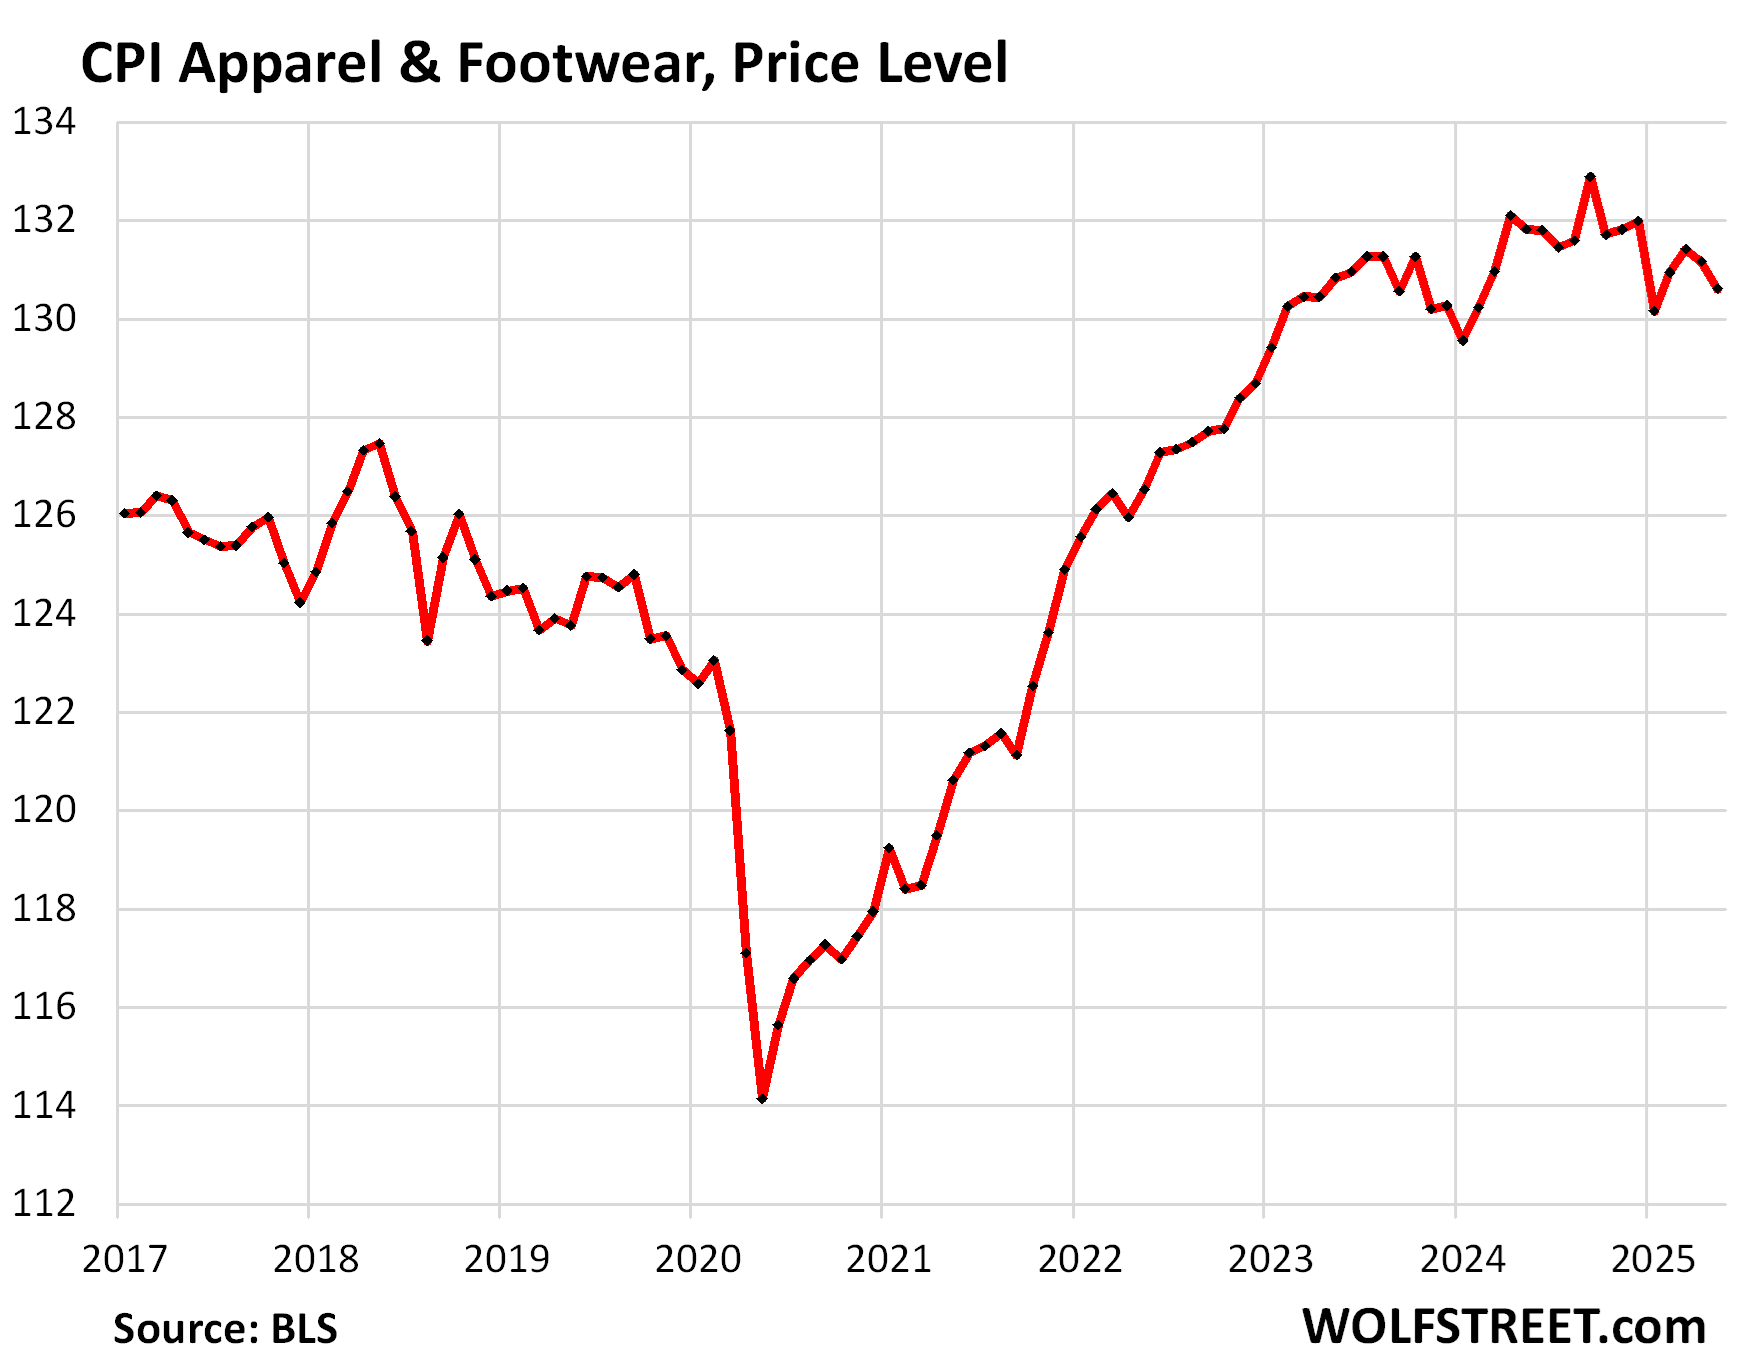
Apparel and footwear are also tariffed if imported. The CPI for apparel and footwear fell by 0.4% month-to-month (-4.9% annualized) and was down by 0.9% year-over-year. The chart shows the price level (not the percentage change). So far, no sign that companies are able to pass on tariffs on clothing and footwear to consumers as consumers are not yet re-willing to pay whatever.
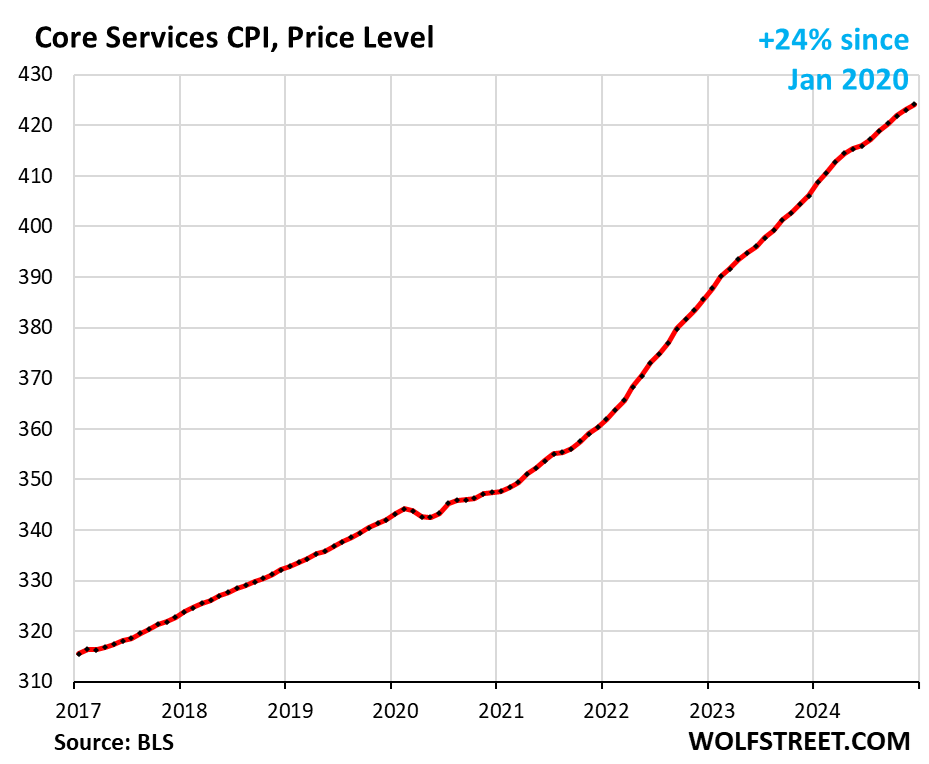
“Core services” CPI rose by 0.17% month-to-month (+2.1% annualized) in May, from April, a deceleration from the prior month (blue line in the chart below). Services are not tariffed.
The 6-month core services CPI rose by 3.2% annualized, a deceleration from April (red).
Core services include all services except energy services and account for about two-thirds of the overall CPI: housing costs, medical care services & insurance, food services, motor vehicle insurance, education, movies, concerts, sports events, club memberships, public transportation, telephone & wireless services, lodging away from home, water, sewer, trash collection, motor vehicle maintenance & repair, etc.
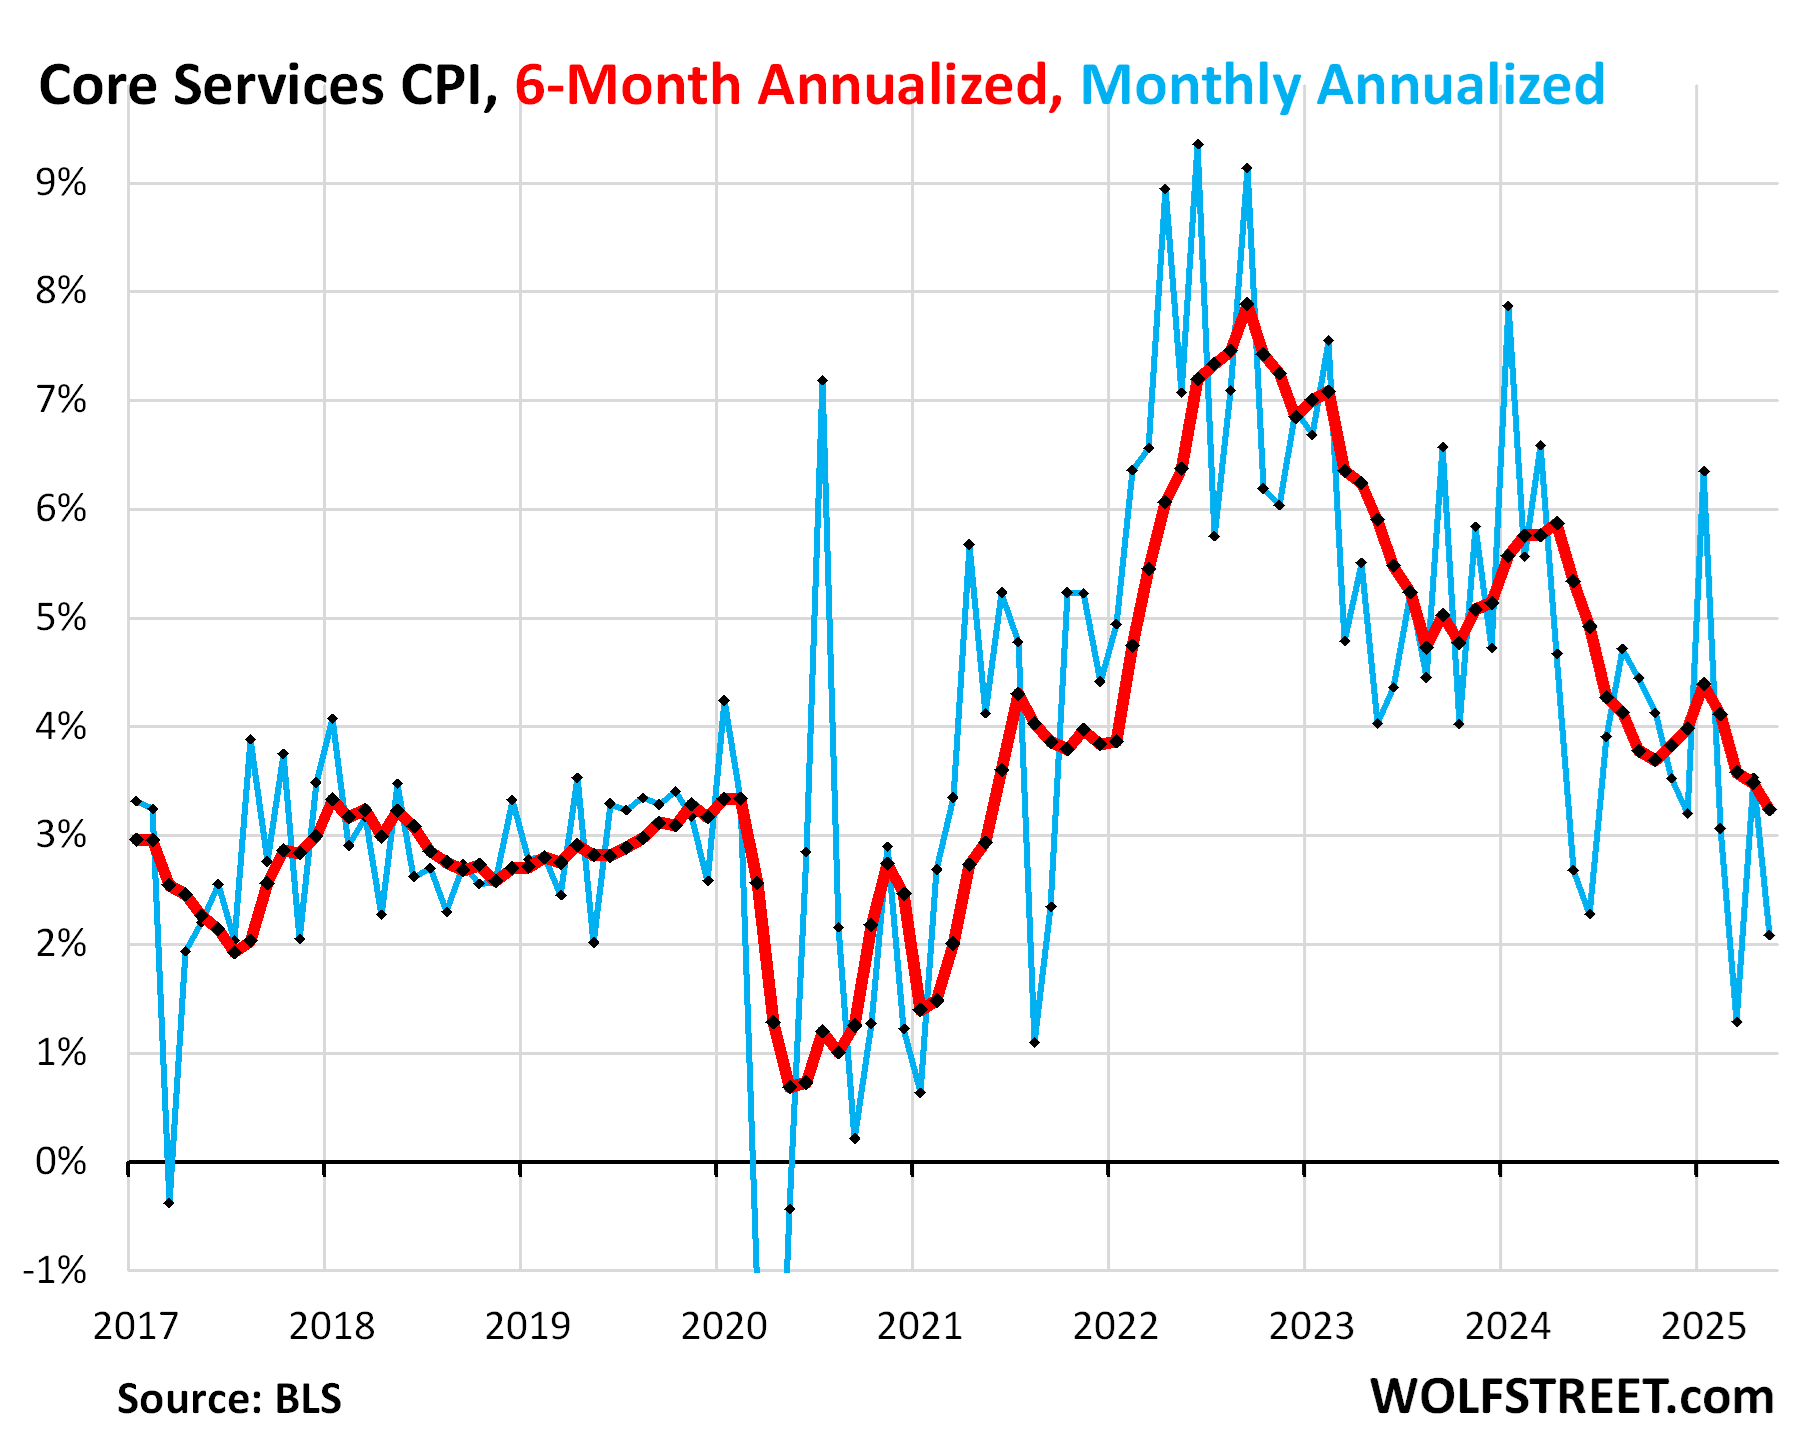
This chart shows the price level of the core services CPI. Unlike durable goods, the CPI for core services has continued to increase as consumers have much less power resisting price increases and shopping for alternatives of essential services.
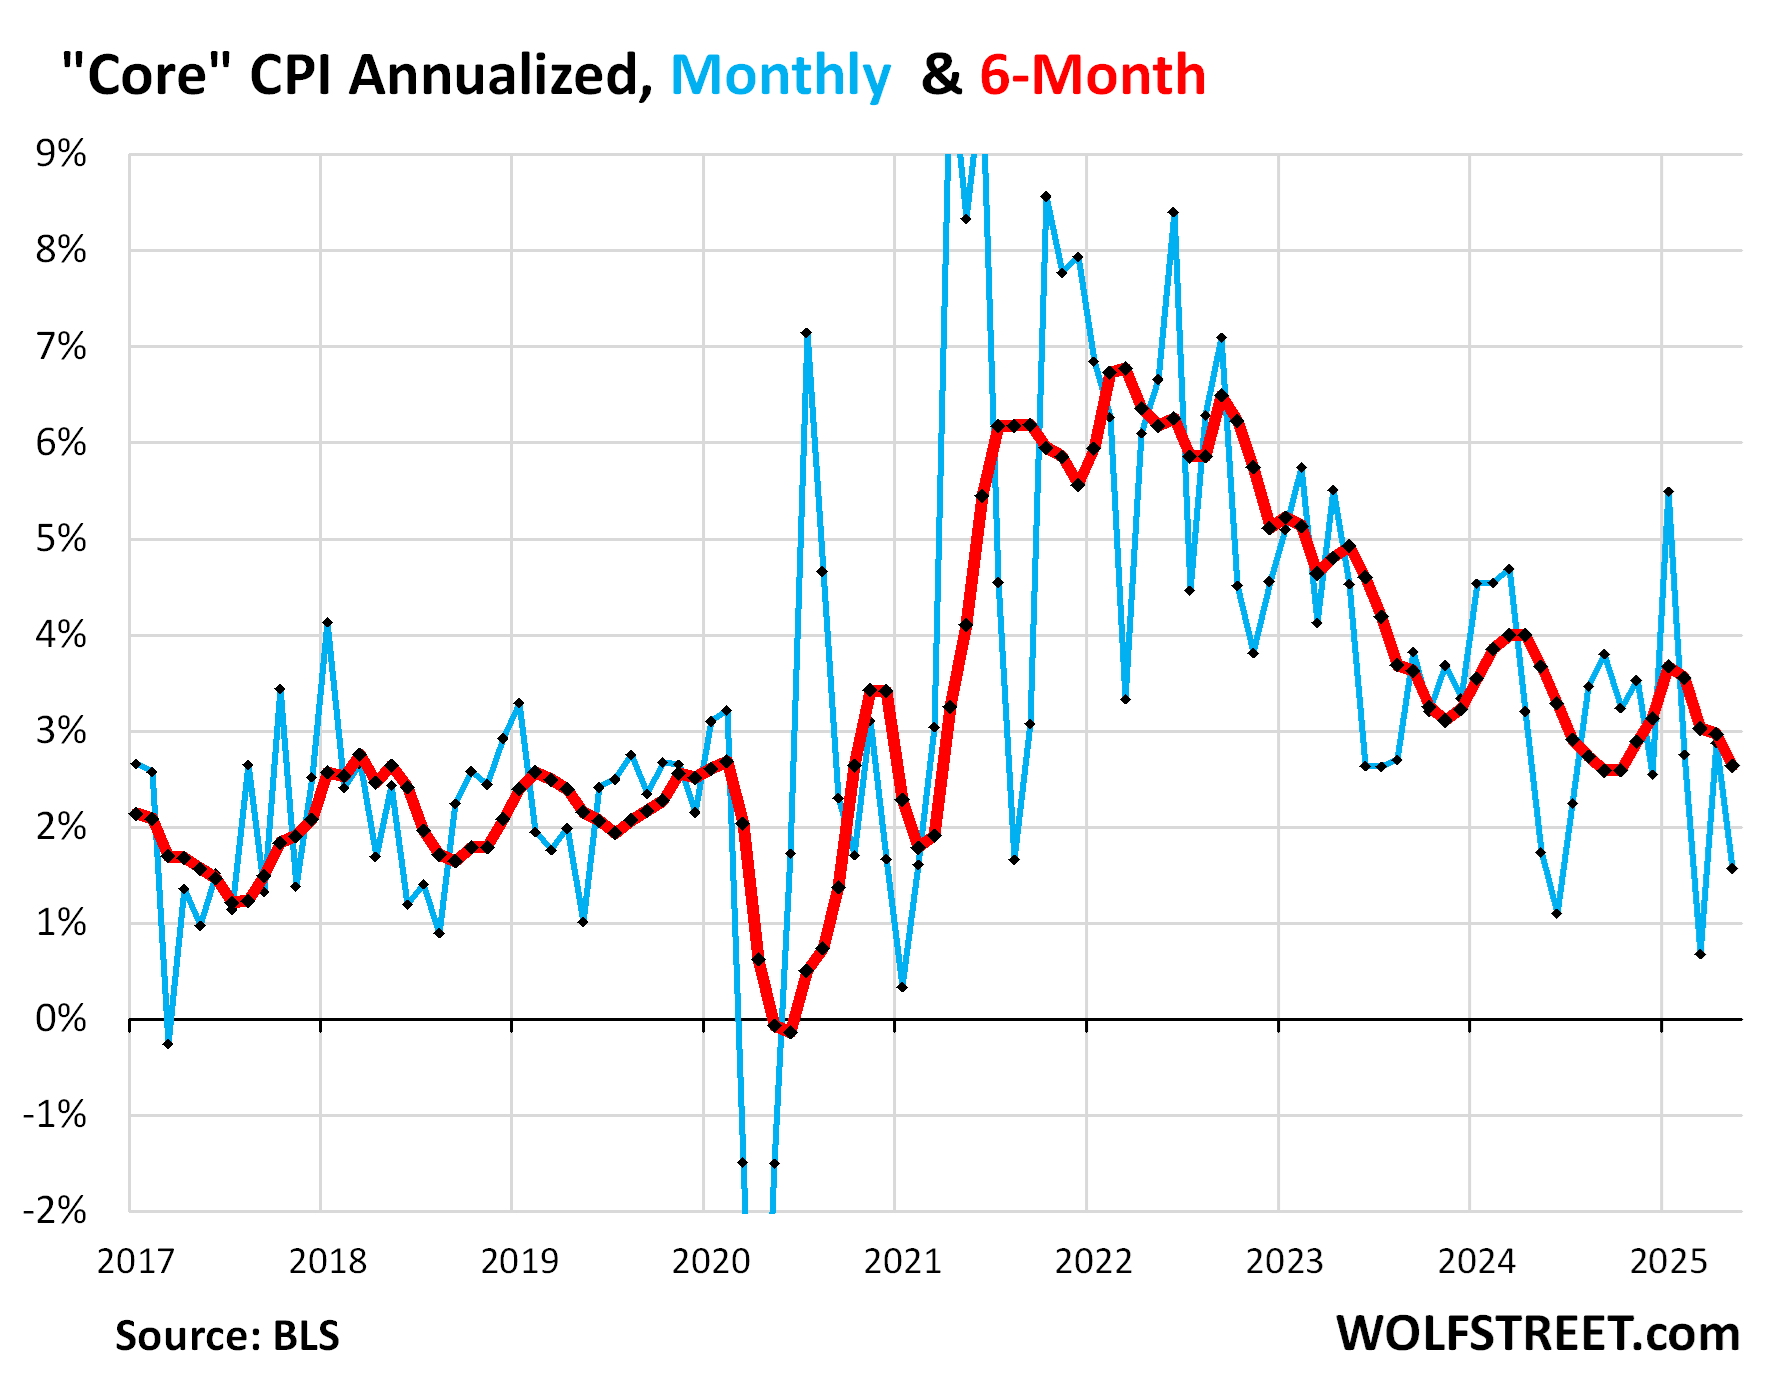
“Core” CPI, which excludes food and energy components to track underlying inflation, but includes all the goods and services mentioned above, rose by 0.13% in May from April (+1.6% annualized), a deceleration from the prior month (blue in the chart below).
The 6-month “core” CPI rose by 2.6% annualized, also a deceleration from the prior month (red).
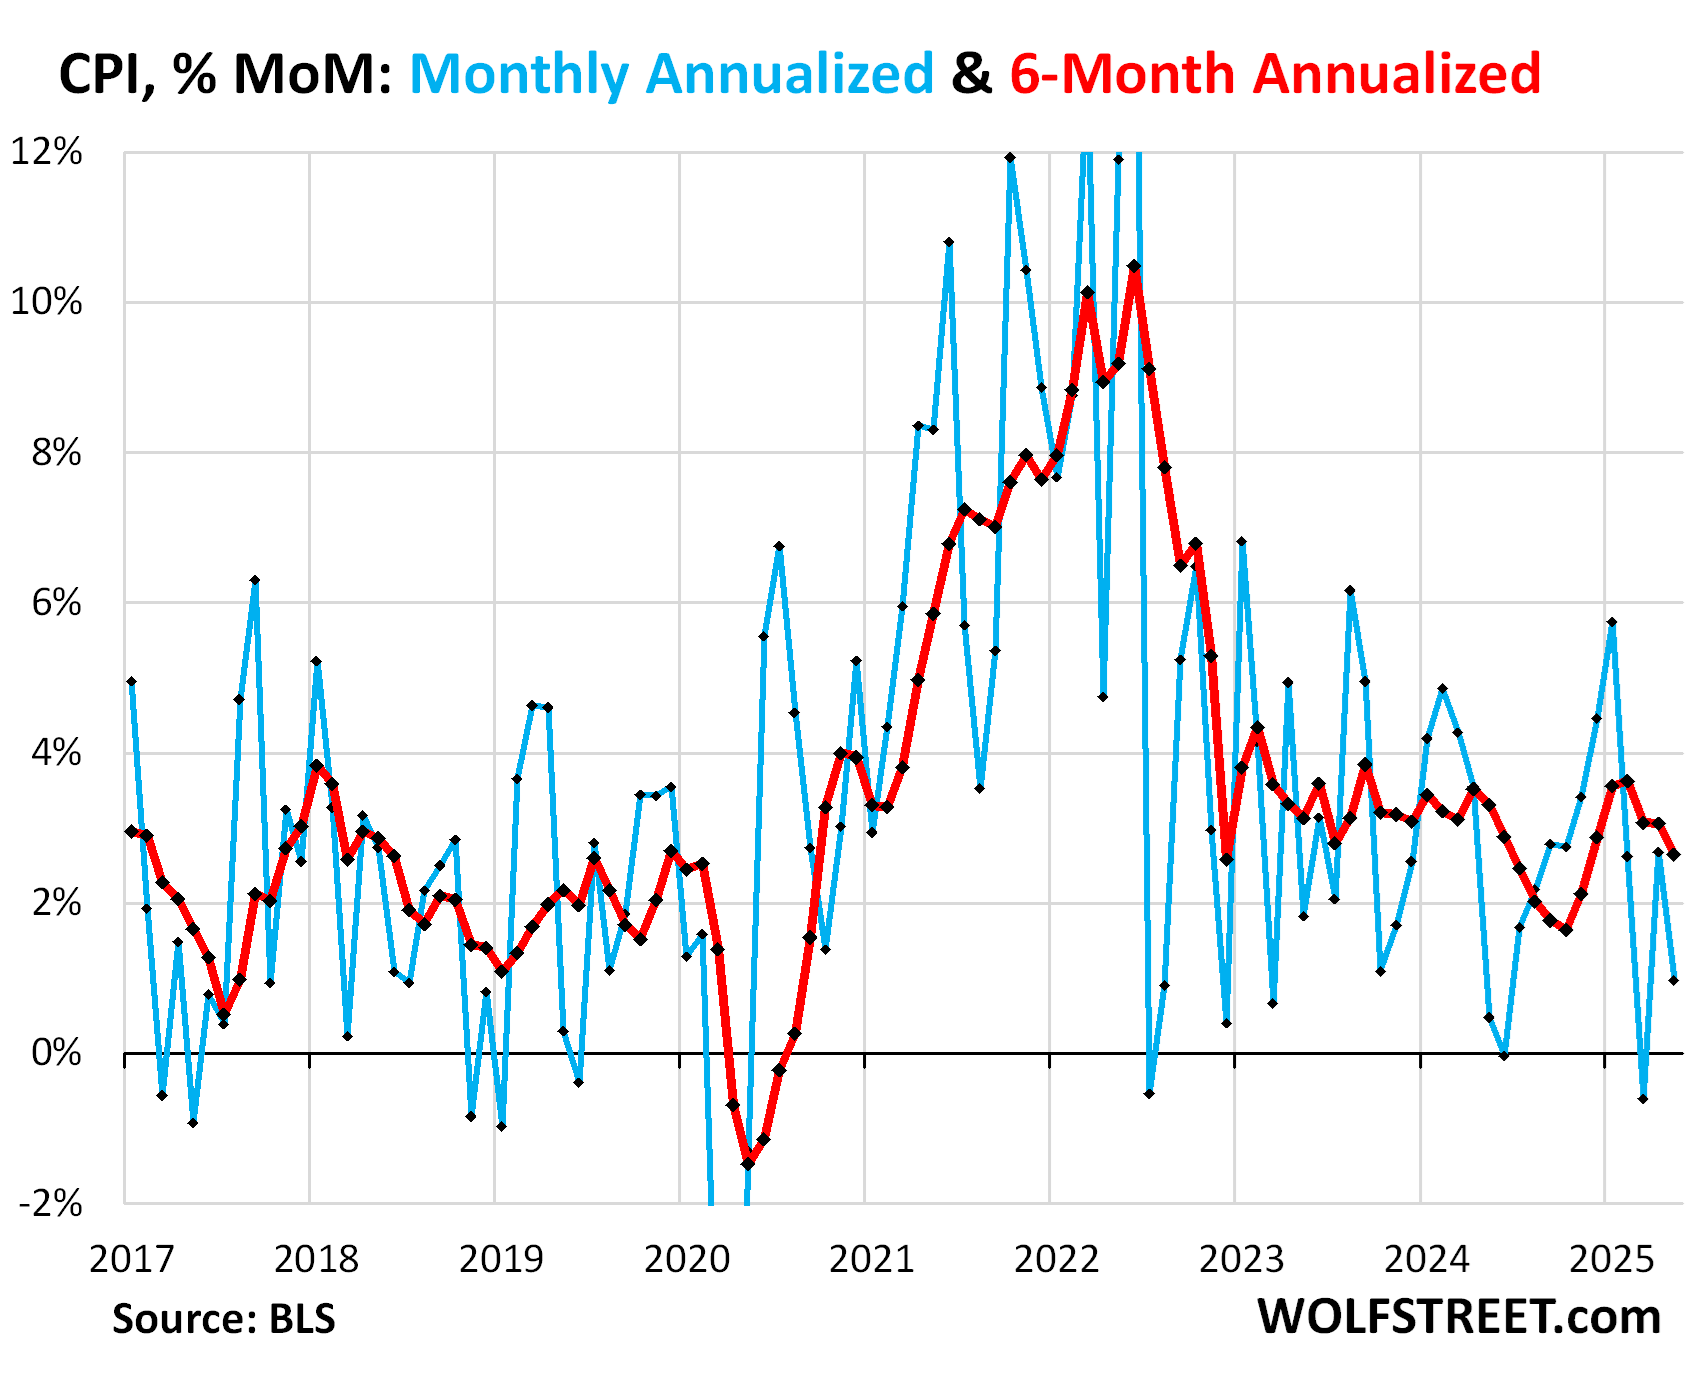
The overall CPI rose by 0.08% (+1.0% annualized) in May from April.
The overall CPI includes food and energy. Food prices rose by 0.27% (+3.2% annualized), while prices of energy that consumers pay for directly, dominated by gasoline, dropped by 0.98% (-11.1% annualized).
The 6-month CPI rose by 2.7% annualized, a deceleration of the prior months (red in the chart):
Overall, there was no evidence yet either of tariffs getting passed through to consumers.
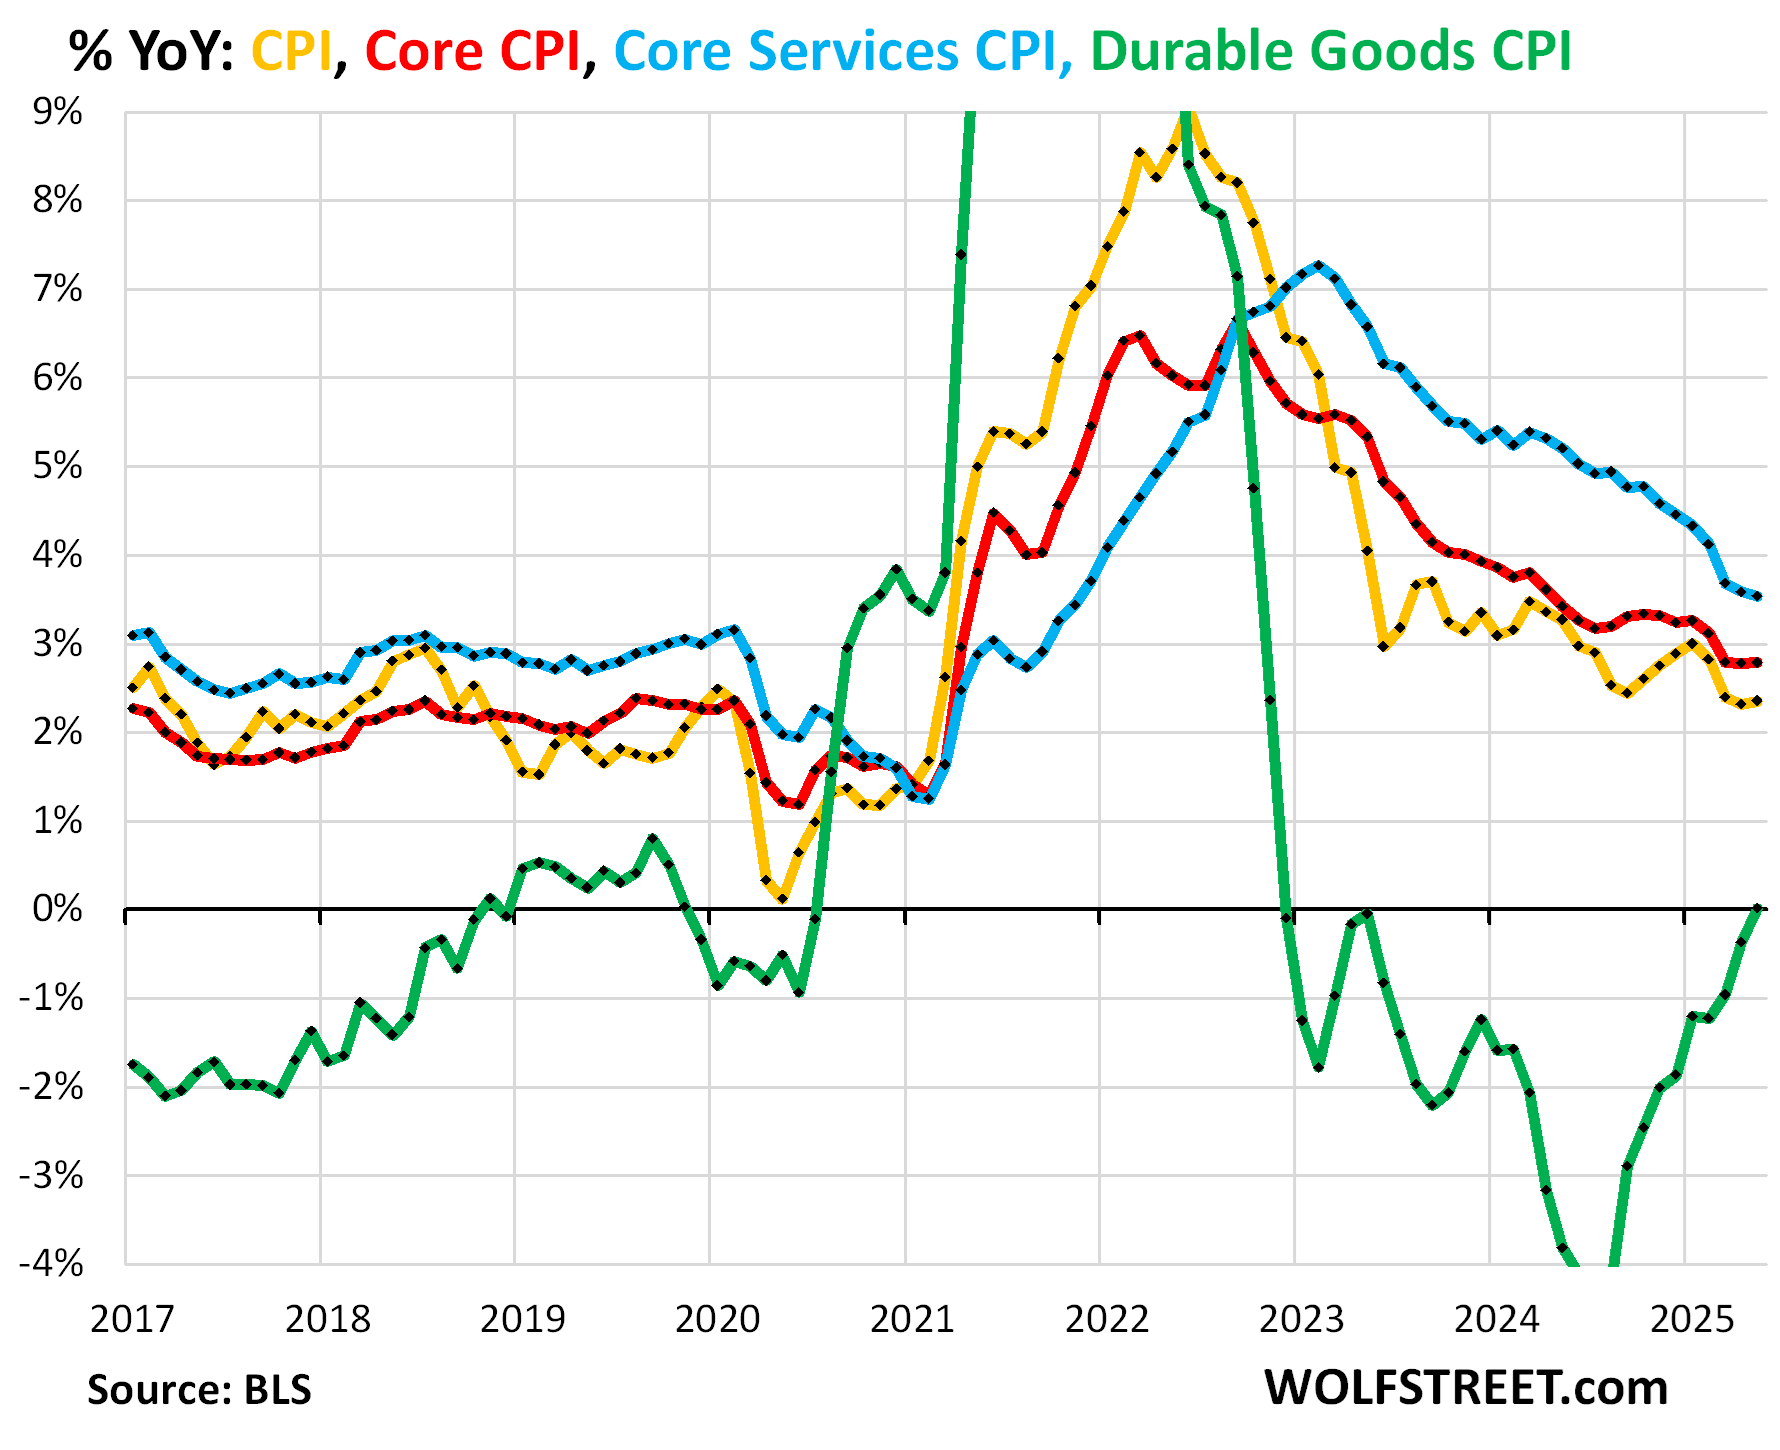
The major components of CPI inflation, YoY price changes:
- Overall CPI: +2.4% (yellow), a slight acceleration from April.
- Core CPI +2.8% (red), unchanged for the past three months.
- Core Services CPI: +3.5% (blue), a slight deceleration from April.
- Durable goods CPI: unchanged or 0% (green), after a year-long trend of ever smaller year-over-year declines.
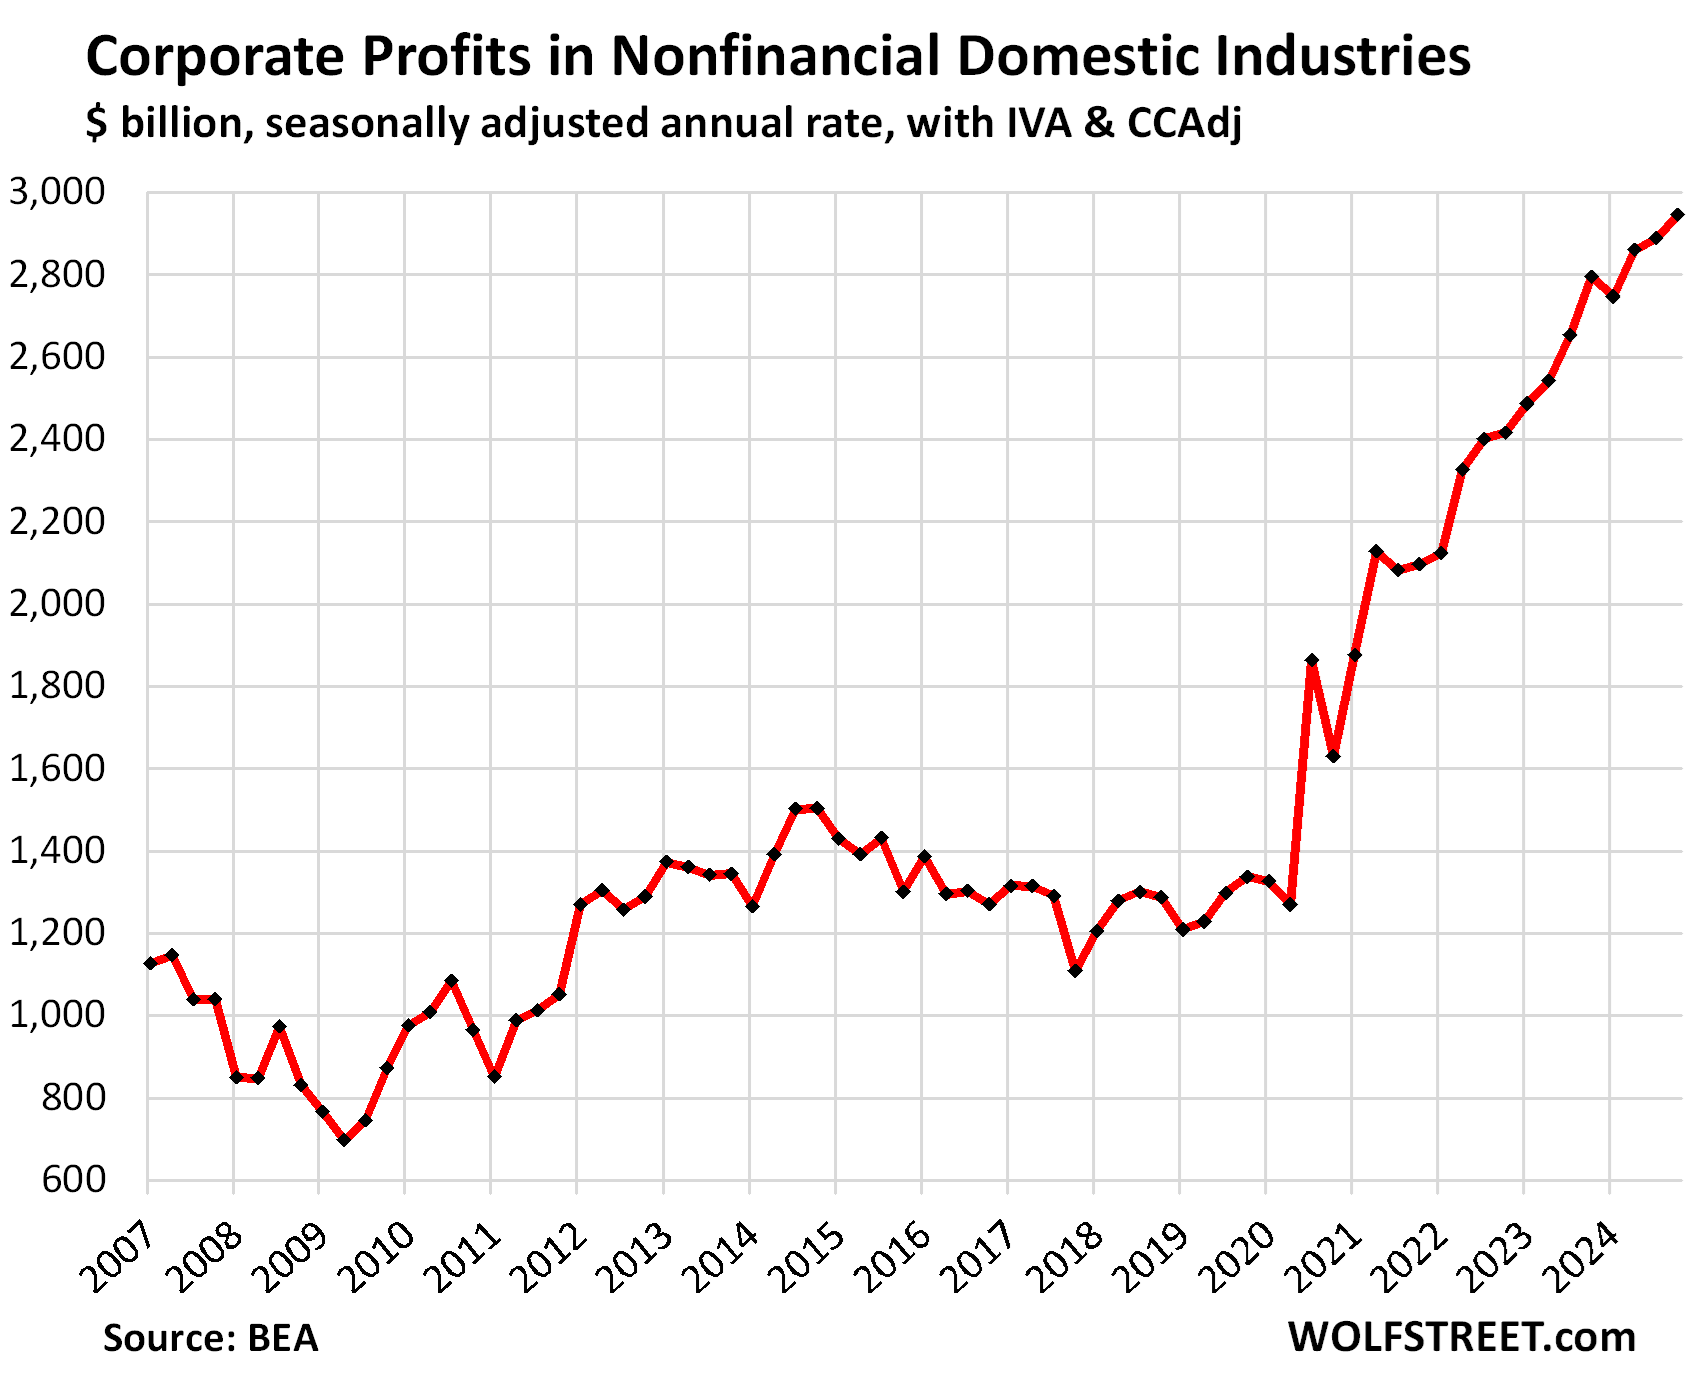
Corporate profits exploded and can absorb the tariffs: Here is where a substantial part of this massive burst of inflation went since the beginning of the free-money pandemic: corporate profits of nonfinancial companies exploded by 140%, or by $1.74 trillion annual rate. This explosion of corporate profits is an essential factor in the inflation-and-tariff machinery now, and it can easily eat the $300 billion or so in annual tariffs if consumers push back hard enough:
Enjoy reading WOLF STREET and want to support it? You can donate. I appreciate it immensely. Click on the mug to find out how:

![]()
The post Tariff-Inflation Watch: CPI Inflation in Light of the Tariffs appeared first on Energy News Beat.
“}]]
