
 [[{“value”:”
Metros with YoY price drops double to 14: Austin, Tampa, San Antonio, Phoenix, Dallas, Orlando, Atlanta, Miami, Denver, Raleigh, Houston, Birmingham, Charlotte. YoY gains narrow sharply in San Diego, Los Angles, Boston, Chicago, New York, Philadelphia, Columbus… 20 below 2022 peaks.
By Wolf Richter for WOLF STREET.
March is the time of the year – the spring selling season – when home prices in many markets rise sharply after declining during the winter, and they did so a year ago.
But this March, prices of single-family houses, condos, and co-ops across the US rose only 0.2% from February. A year ago, they’d jumped by 1.1% in March from February.
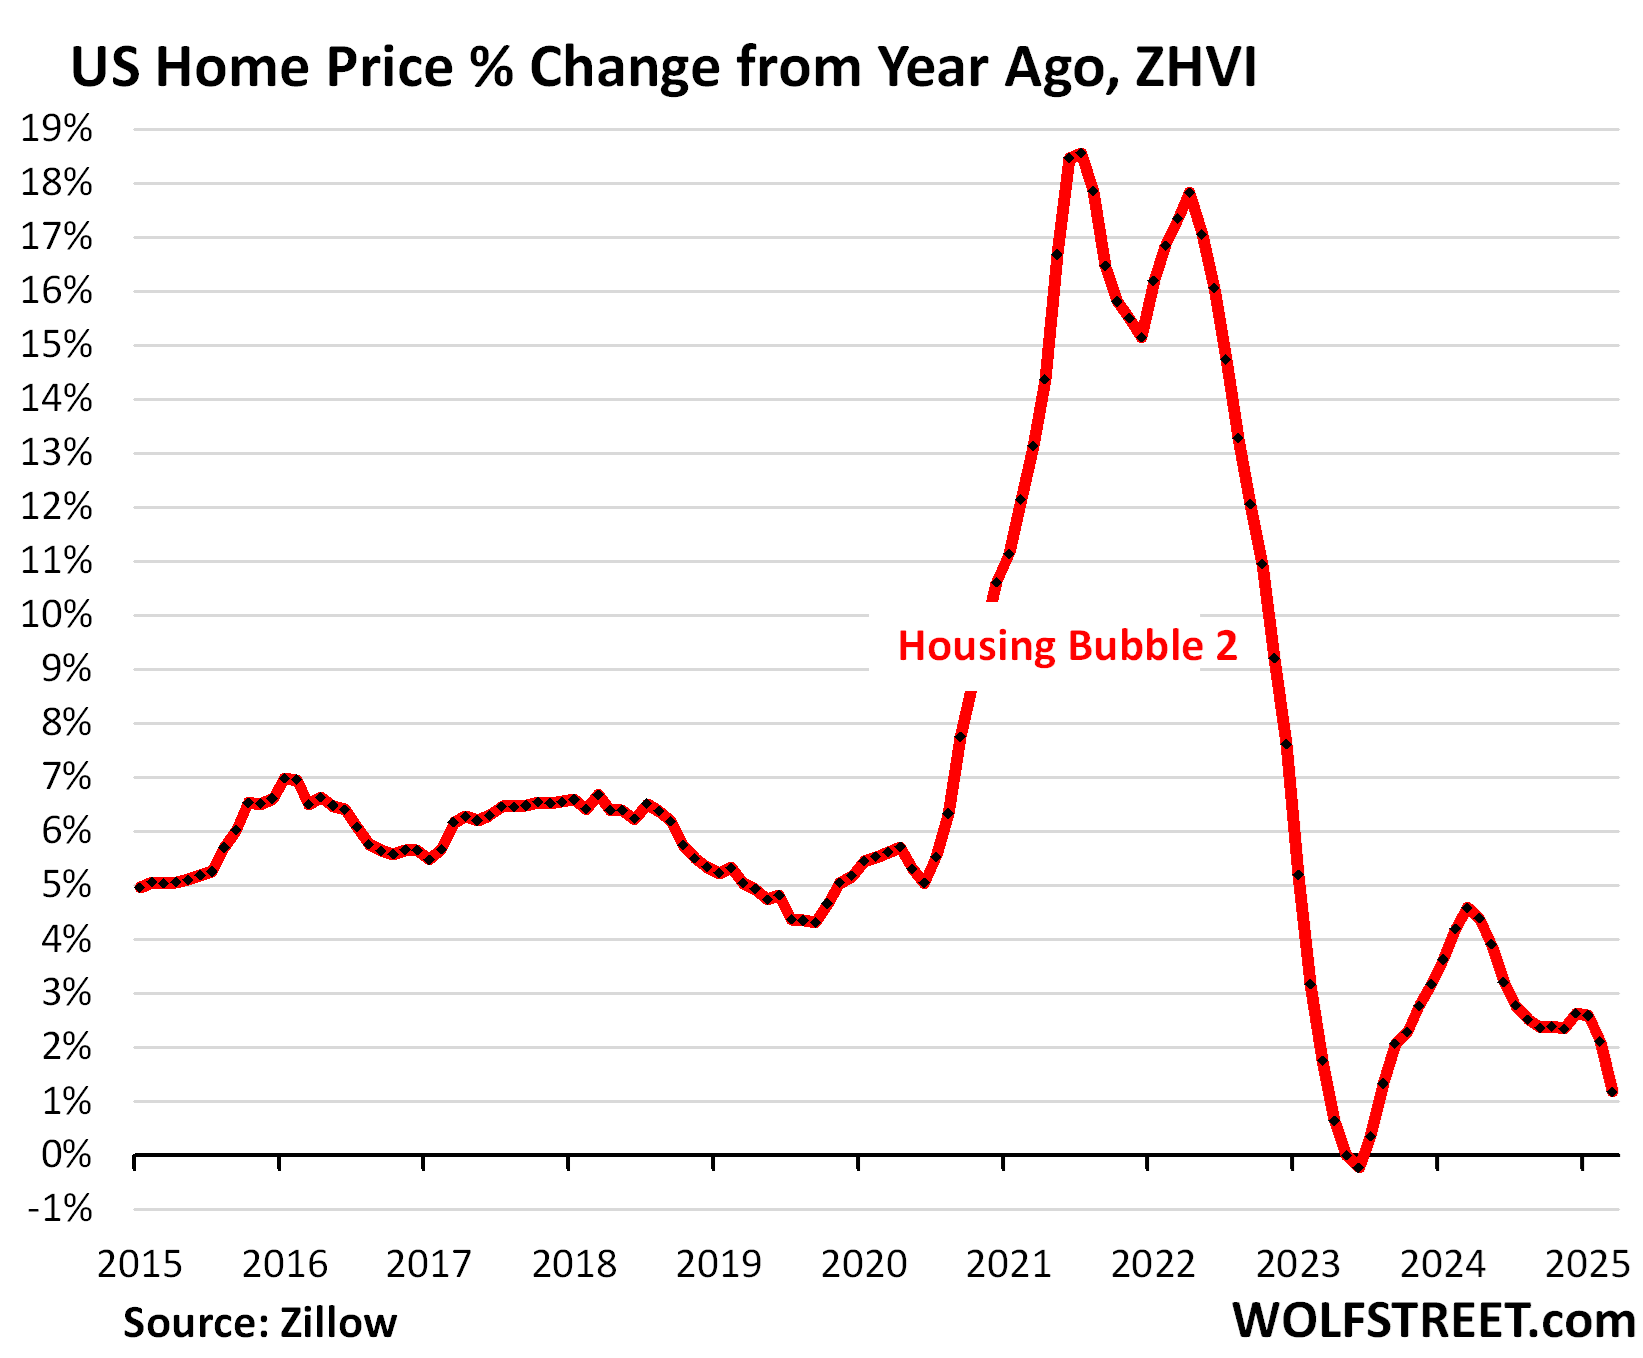
This small month-to-month price increase in March caused the year-over-year price gain for homes that sold in March to get whittled down to 1.1% overall, from 2.1% in February. A year ago, the YoY price gains were in 4.5% range. During the peak of Housing Bubble 2 in mid-2021, YoY gains exceeded 18%.
Similar scenarios played out in all of the 33 metros here: Month-to-month gains in March – if any… Miami and others had declines – were a lot smaller than a year earlier.
Those markets with YoY price declines in February saw these YoY declines widen in March. Seven of those that still had YoY gains in February flipped to YoY declines in March. And others saw their YoY gains narrow, in some cases to near-nothing, such as San Diego.
All data here is from the “raw” mid-tier Zillow Home Value Index (ZHVI). The ZHVI is based on millions of data points in Zillow’s “Database of All Homes,” including from public records (tax data), MLS, brokerages, local Realtor Associations, real-estate agents, and households across the US. It includes pricing data for off-market deals and for-sale-by-owner deals. Zillow’s Database of All Homes also has sales-pairs data. The index is not seasonally adjusted.
The 33 Most Splendid Housing Bubbles.
Here we track the prices of single-family houses, condos, and co-ops in 33 large Metropolitan Statistical Areas (MSAs). To qualify for this list, the MSA must be one of the largest by population, and must have had a ZHVI of at least $300,000 somewhere along the line.
The metros of New Orleans, Oklahoma City, Tulsa, Cincinnati, Pittsburgh, etc. don’t qualify for this list because their ZHVI has never reached $300,000, despite the massive surge of home prices in recent years, but from low levels.
Down year-over-year: The group of the 33 metros here whose prices declined year-over-year keeps growing. In March, 14 of these 33 metros had year-over-year declines, up from 7 metros in February.
The 14 metros with year-over-year price declines:
- Austin: -4.6%
- Tampa: -4.5%
- San Antonio: -2.7%
- Phoenix: -2.5%
- Dallas: -2.4%
- Orlando: -2.2%
- Atlanta: -1.8%
- Miami: -1.5%
- Denver: -1.1%
- Raleigh: -1.0%
- Houston: -0.9%
- Honolulu: -0.8%
- Birmingham: -0.3%
- Charlotte: -0.1%
Down from the 2022 peaks: Prices in 20 metros of our 33 metros are down from their 2022 peaks, led by the metros of:
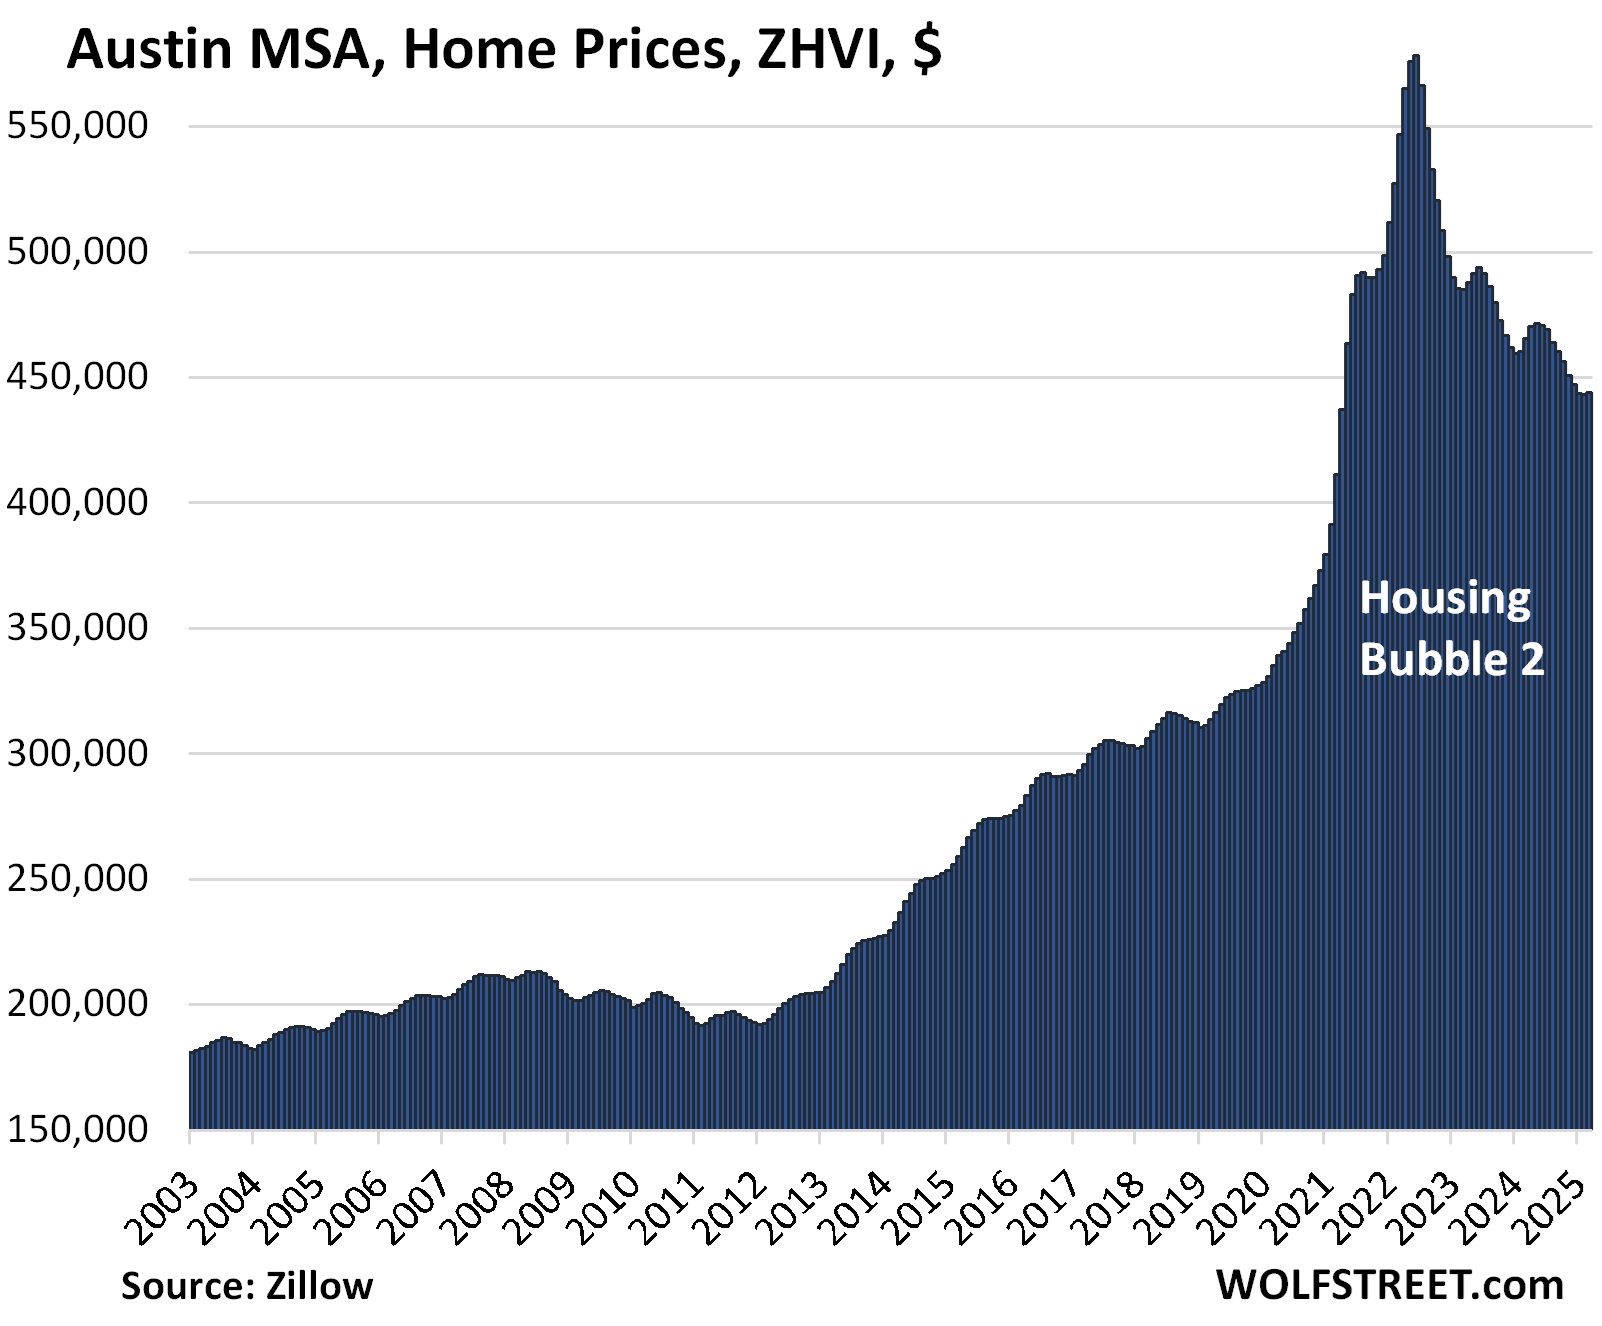
- Austin: -23.2%
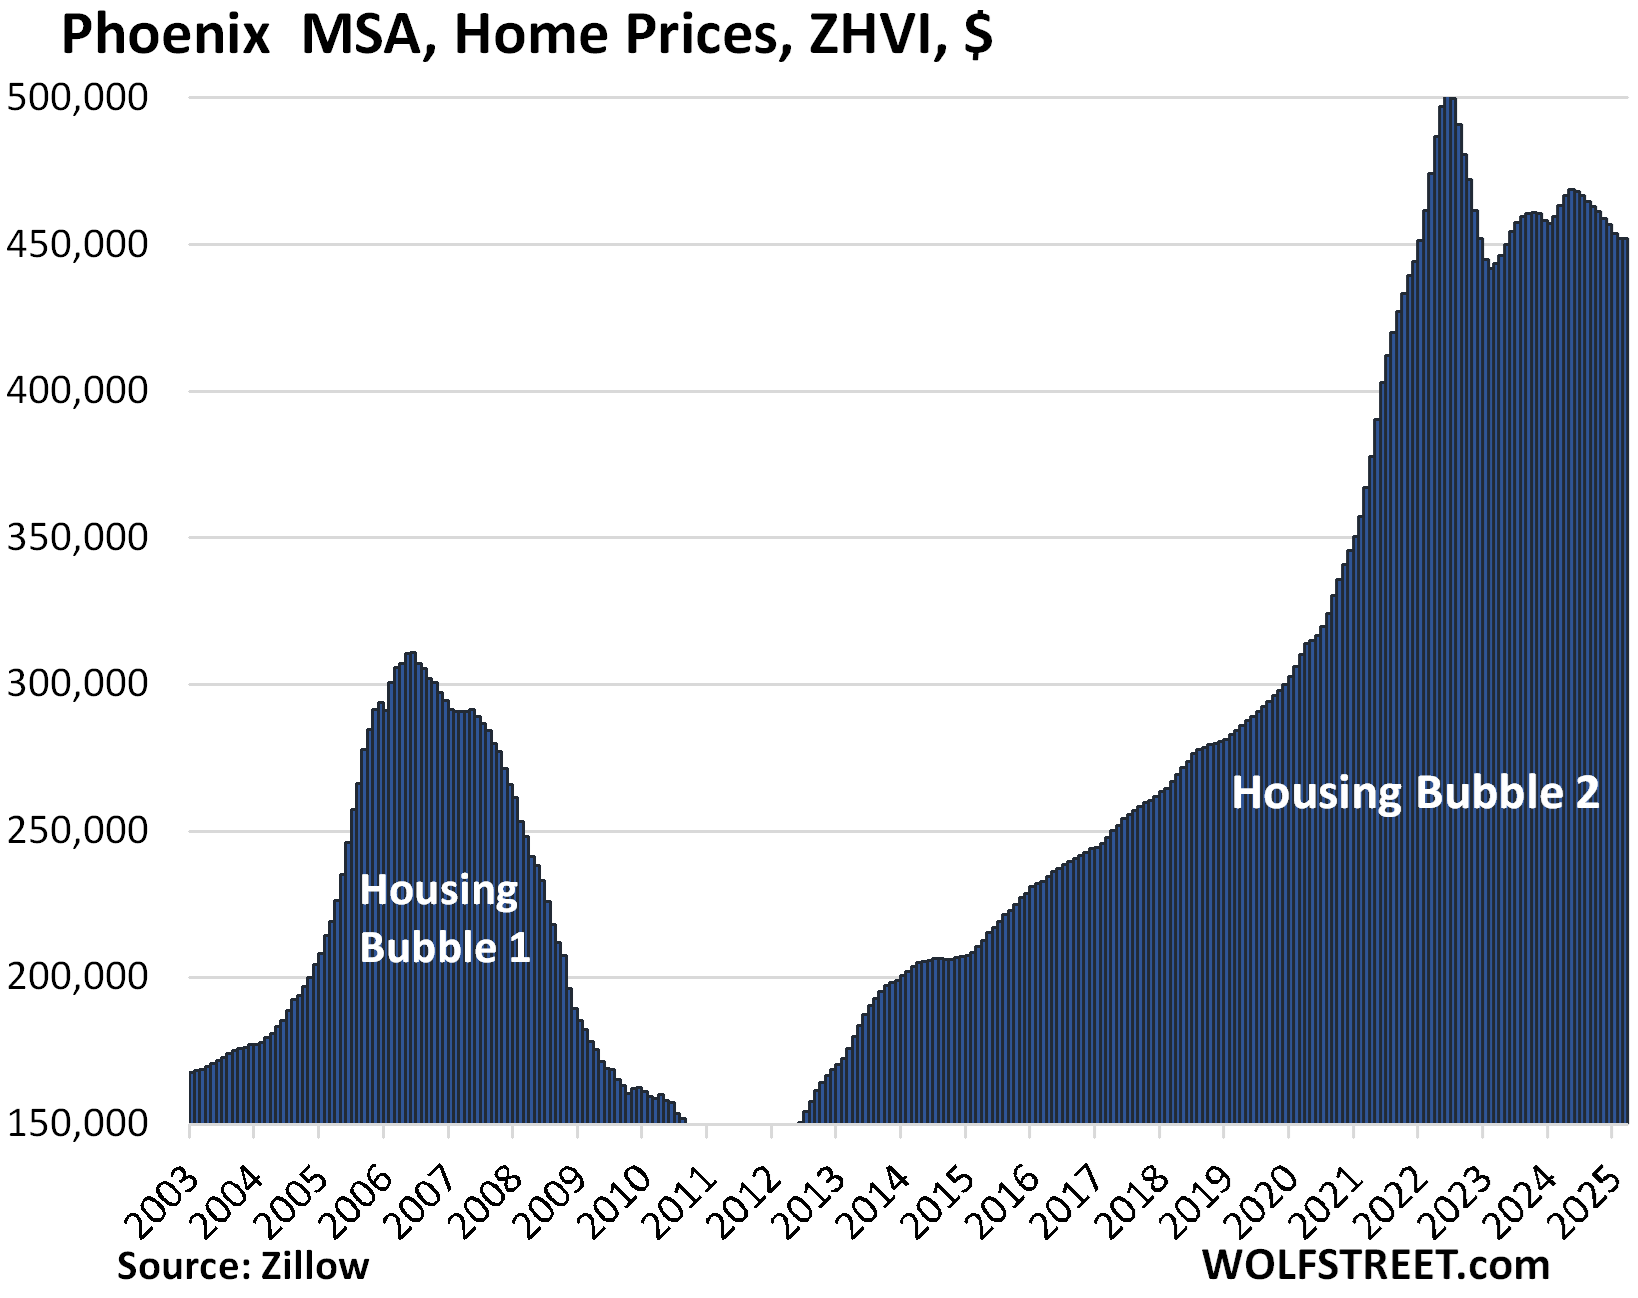
- Phoenix: -10.2%
- San Francisco: -10.8%
- San Antonio: -9.4%
- Denver: -7.9%.
Home prices exploded through mid-2022, fueled by the Fed’s interest rate repression and QE, resulting in below-3% mortgages. But the Fed hiked rates starting in 2022 and has shed $2.2 trillion in assets through QT. Mortgage rates have been above 6% since September 2022 and over 7% for some of that time. Prices are now simply too high after spiking like this, and demand has plunged.
The 20 metros that are below their highs of mid-2022.
| Austin MSA, Home Prices | |||
| From Jun 2022 peak | MoM | YoY | Since 2000 |
| -23.2% | 0.2% | -4.6% | 154% |
The YoY decline worsened from -3.8% in February. Prices are back where they’d been in April 2021.
The Austin MSA includes the counties of Travis (Austin-Round Rock), Williamson, Hays, Caldwell, and Bastrop.
| Phoenix MSA, Home Prices | |||
| From Jun 2022 peak | MoM | YoY | Since 2000 |
| -10.2% | 0.0% | -2.5% | 216% |
The YoY decline worsened from -1.6% in February. Prices are back where they’d first been in January 2022:
| San Francisco MSA, Home Prices | |||
| From May 2022 peak | MoM | YoY | Since 2000 |
| -9.8% | 0.9% | 0.5% | 293% |
In February, the YoY increase was still +2.4%.
The MSA includes San Francisco, Oakland, much of the East Bay, much of the North Bay, and goes south on the Peninsula into Silicon Valley through San Mateo County.
Prices are roughly where they’d first been in June 2021.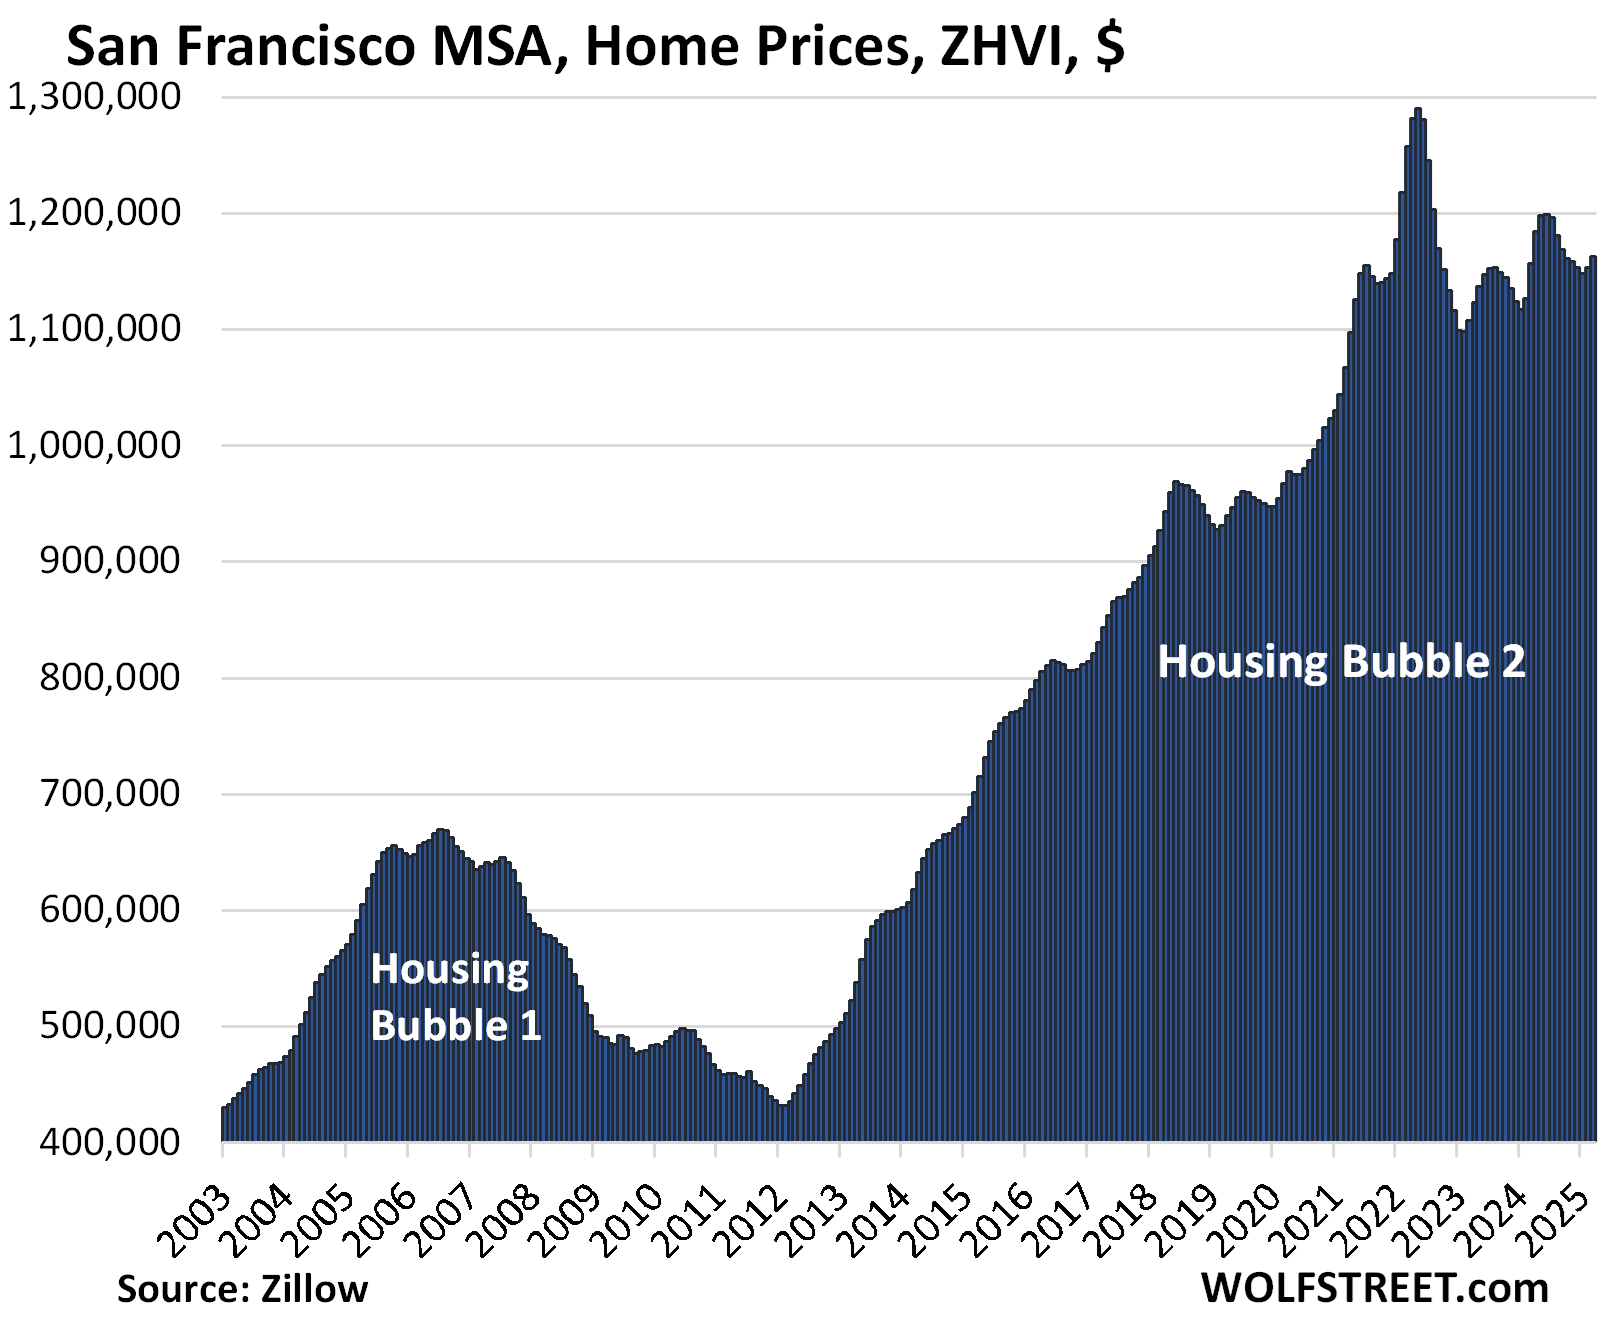
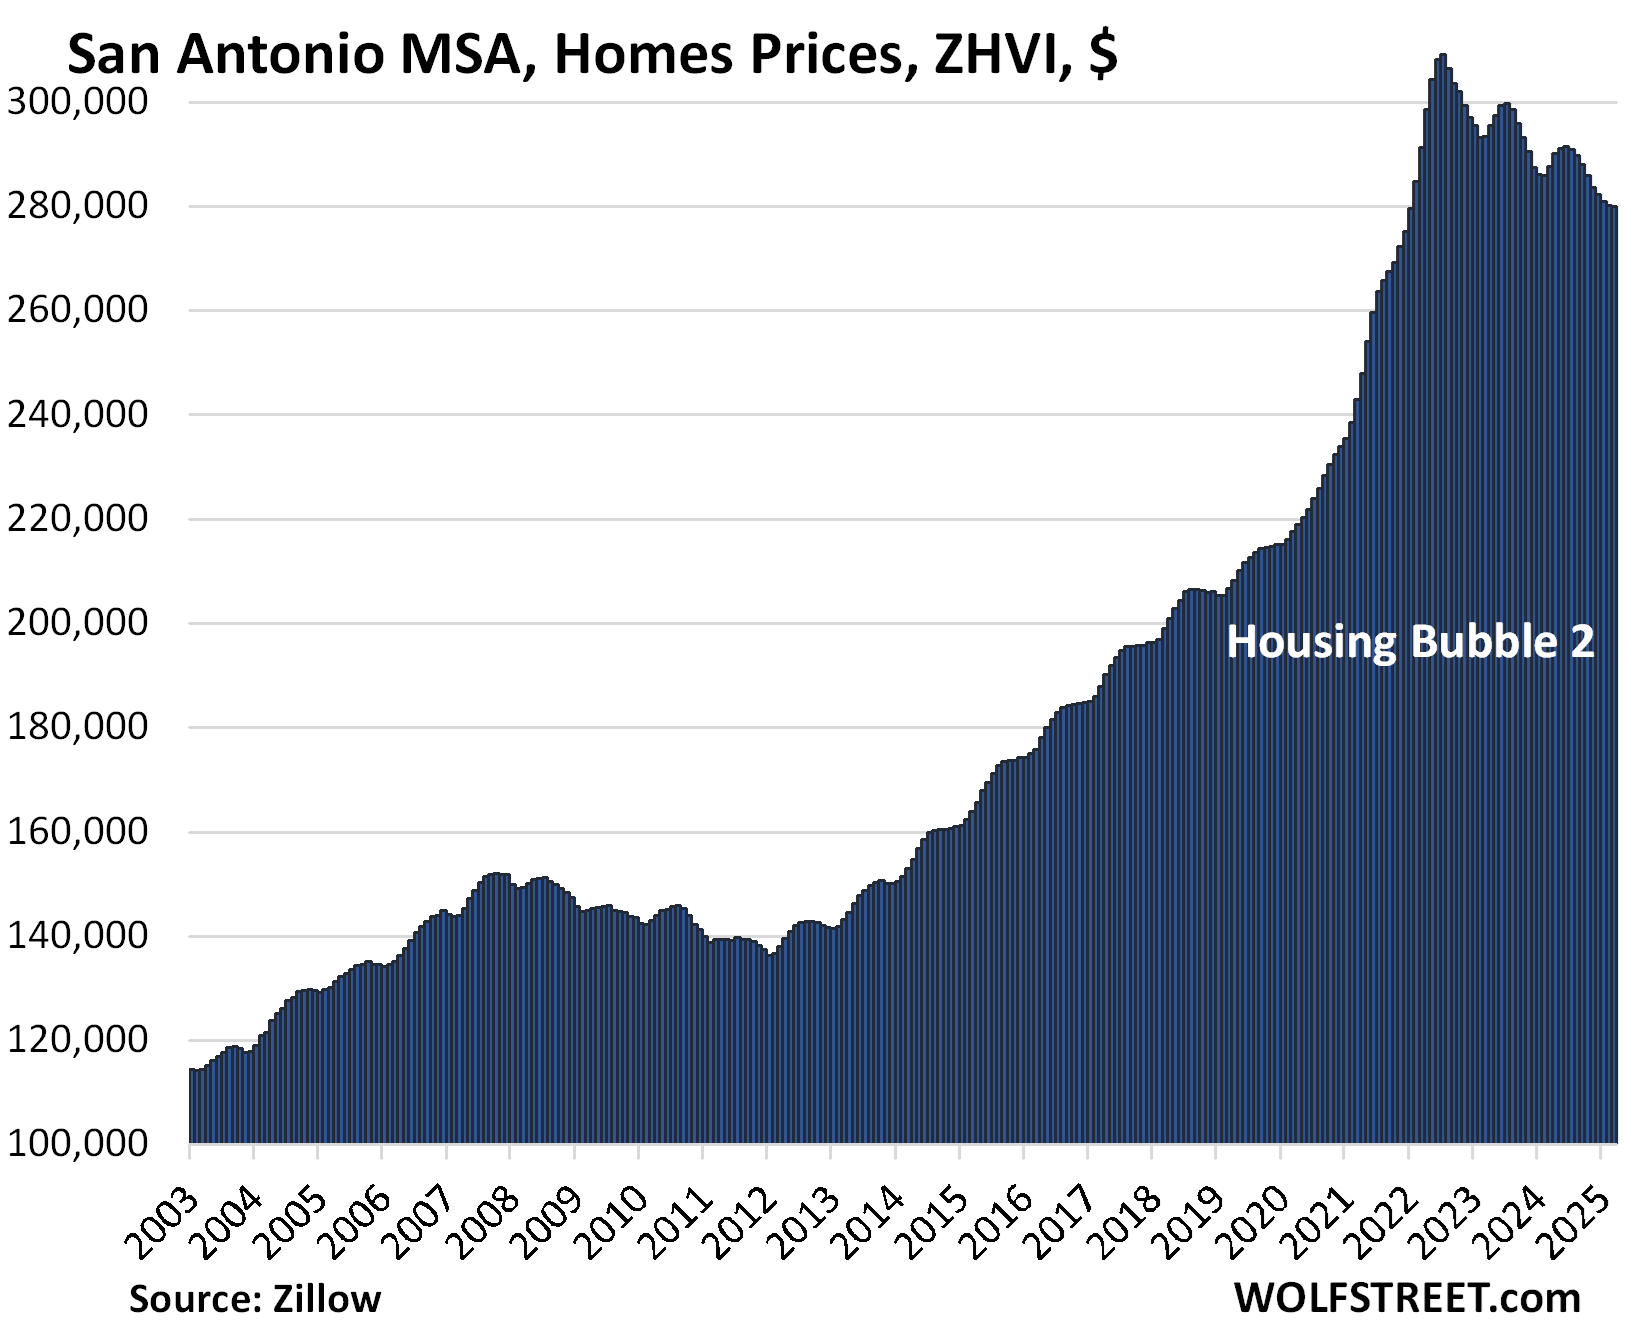
| San Antonio MSA, Home Prices | |||
| From Jul 2022 peak | MoM | YoY | Since 2000 |
| -9.4% | -0.1% | -2.7% | 145.4% |
The YoY decline worsened from -2.0% in February. Prices have dropped to the lowest level since January 2022.
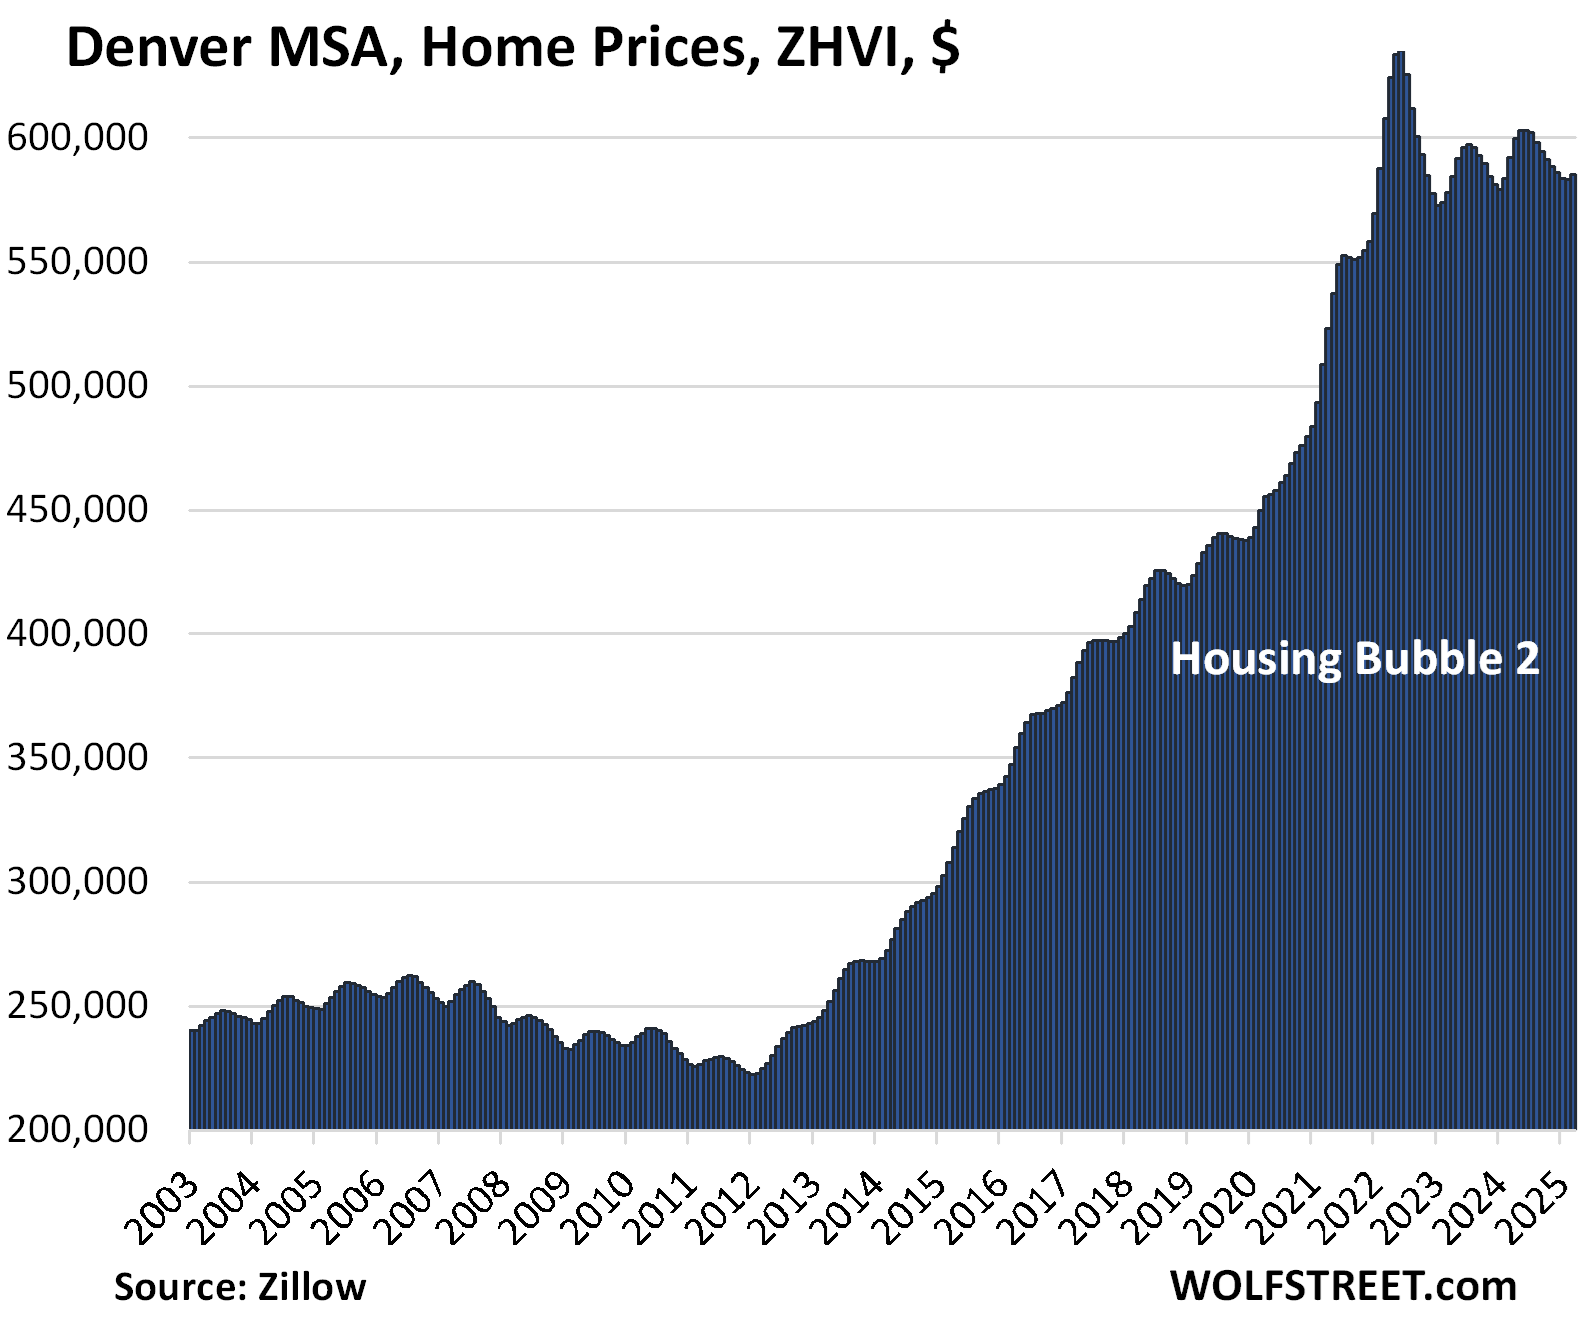
| Denver MSA, Home Prices | |||
| From Jun 2022 peak | MoM | YoY | Since 2000 |
| -7.9% | 0.4% | -1.1% | 211% |
The YoY decline worsened from 0% in February. Prices are back where they’d first been in February 2022.
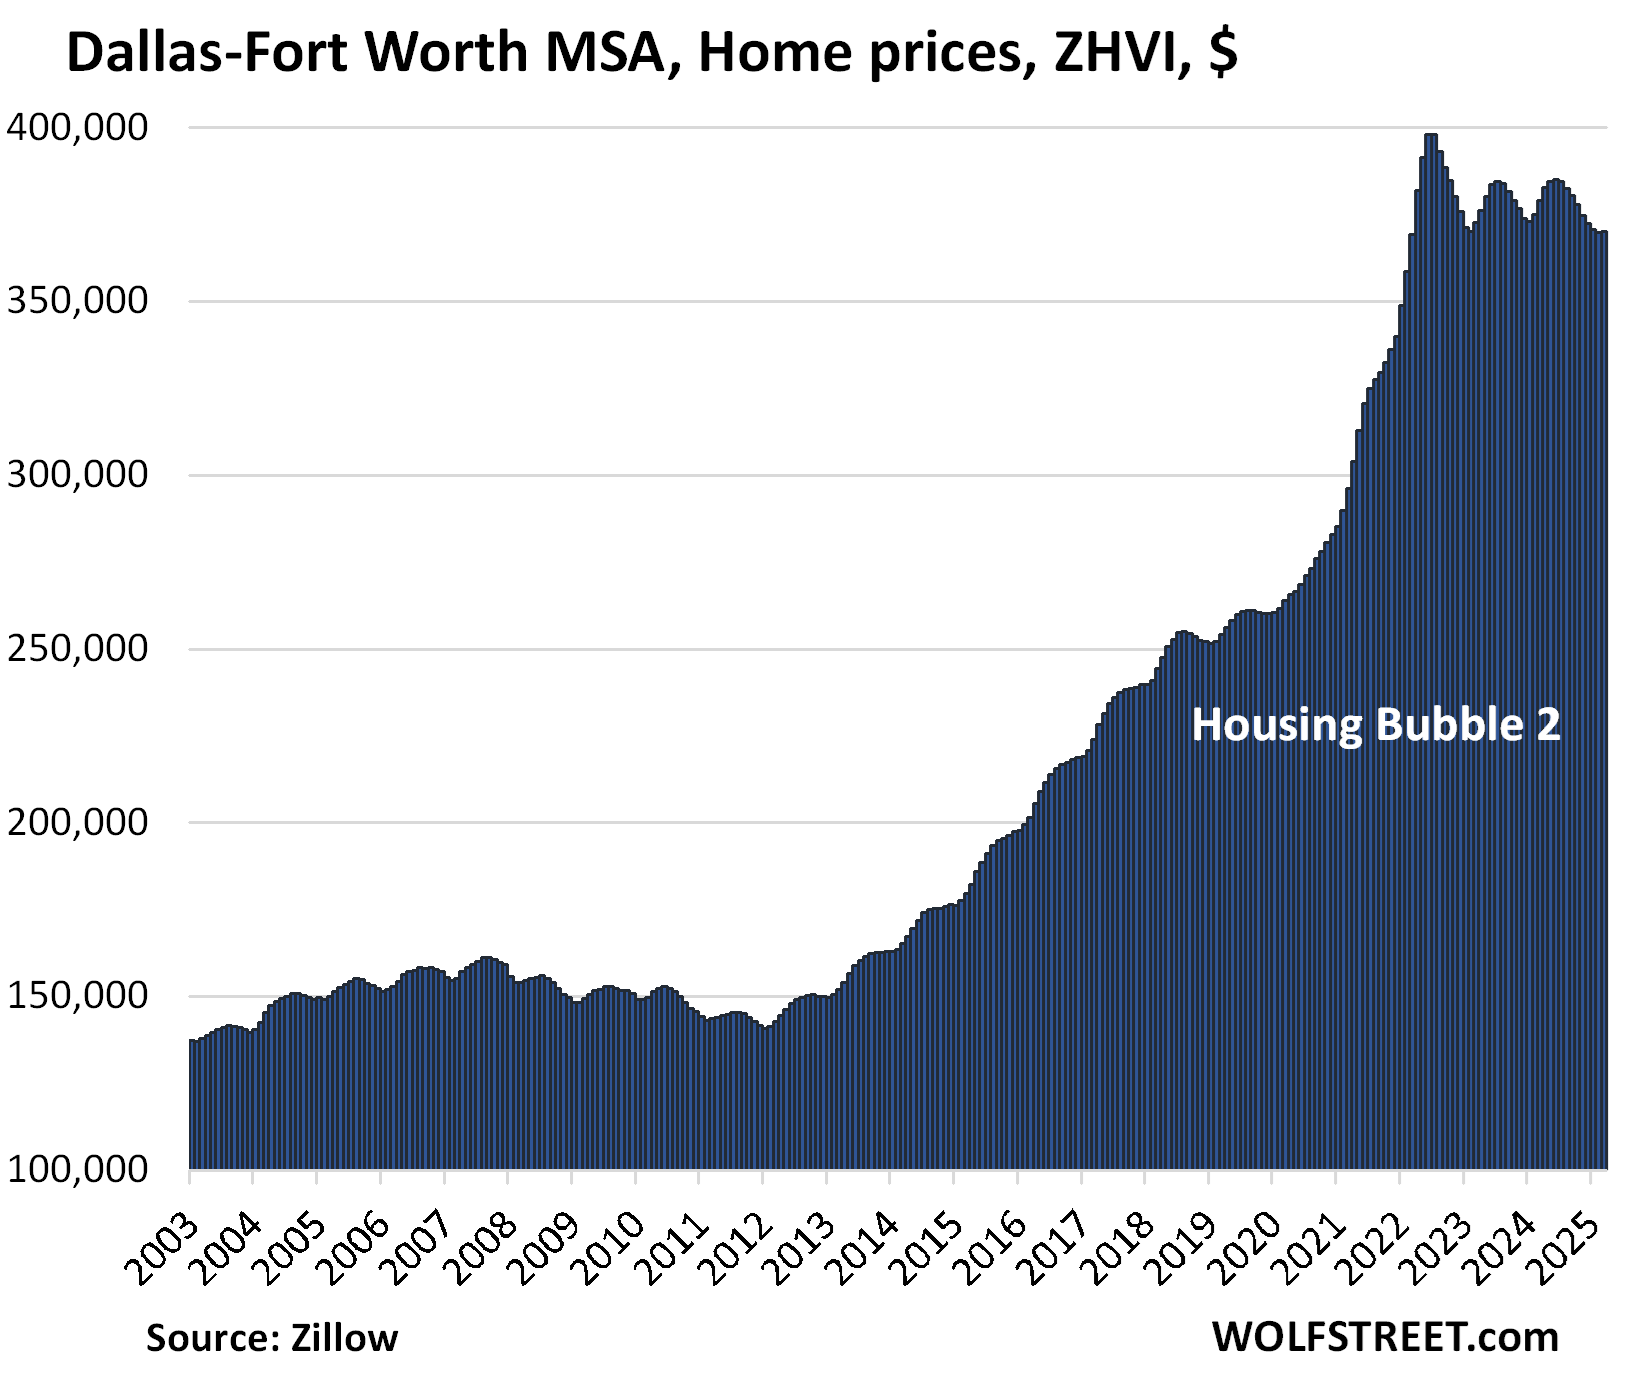
| Dallas-Fort Worth MSA, Home Prices | |||
| From Jun 2022 peak | MoM | YoY | Since 2000 |
| -7.0% | 0.1% | -2.4% | 190% |
The YoY drop worsened from -1.4% in February.
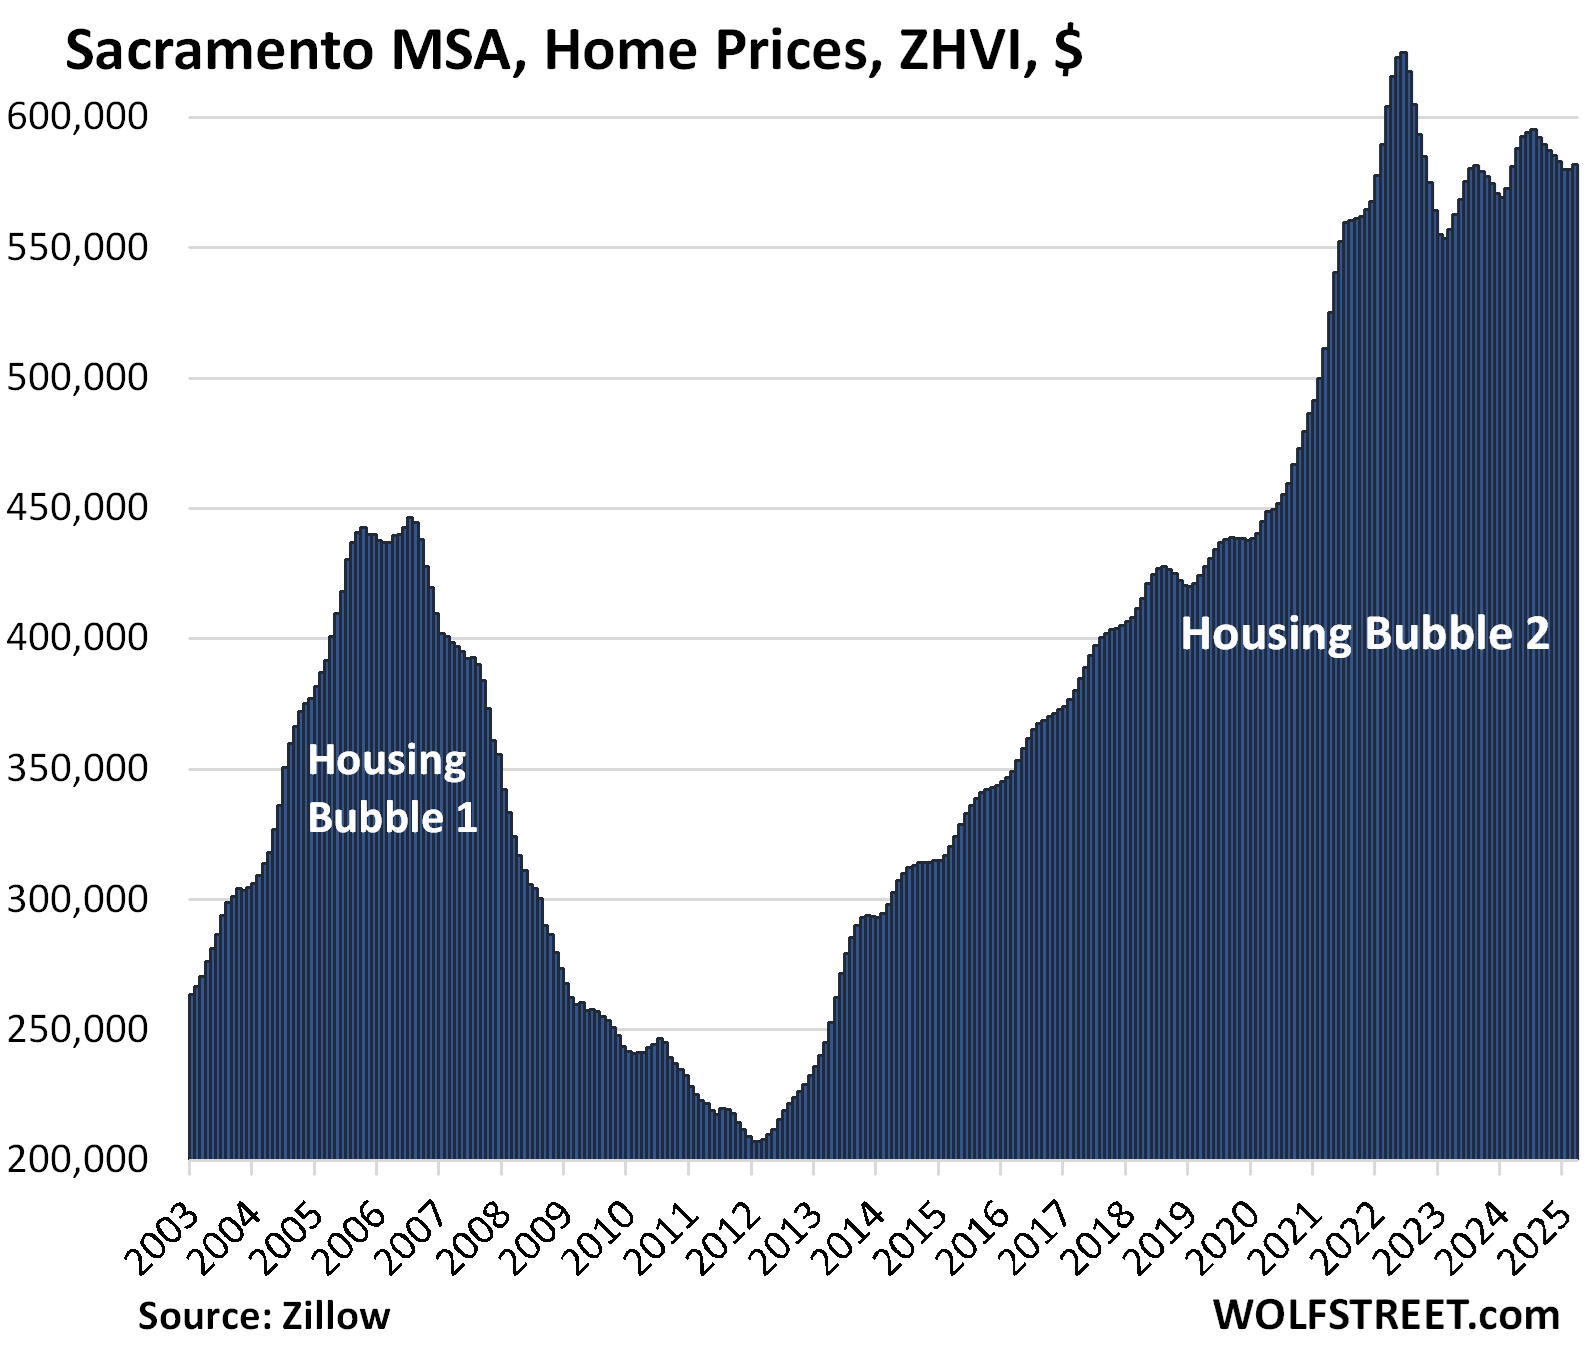
| Sacramento MSA, Home Prices | |||
| From July 2022 peak | MoM | YoY | Since 2000 |
| -6.9% | 0.3% | 0.1% | 244.0% |
February’s YoY gain of 1.3% nearly vanished in March.
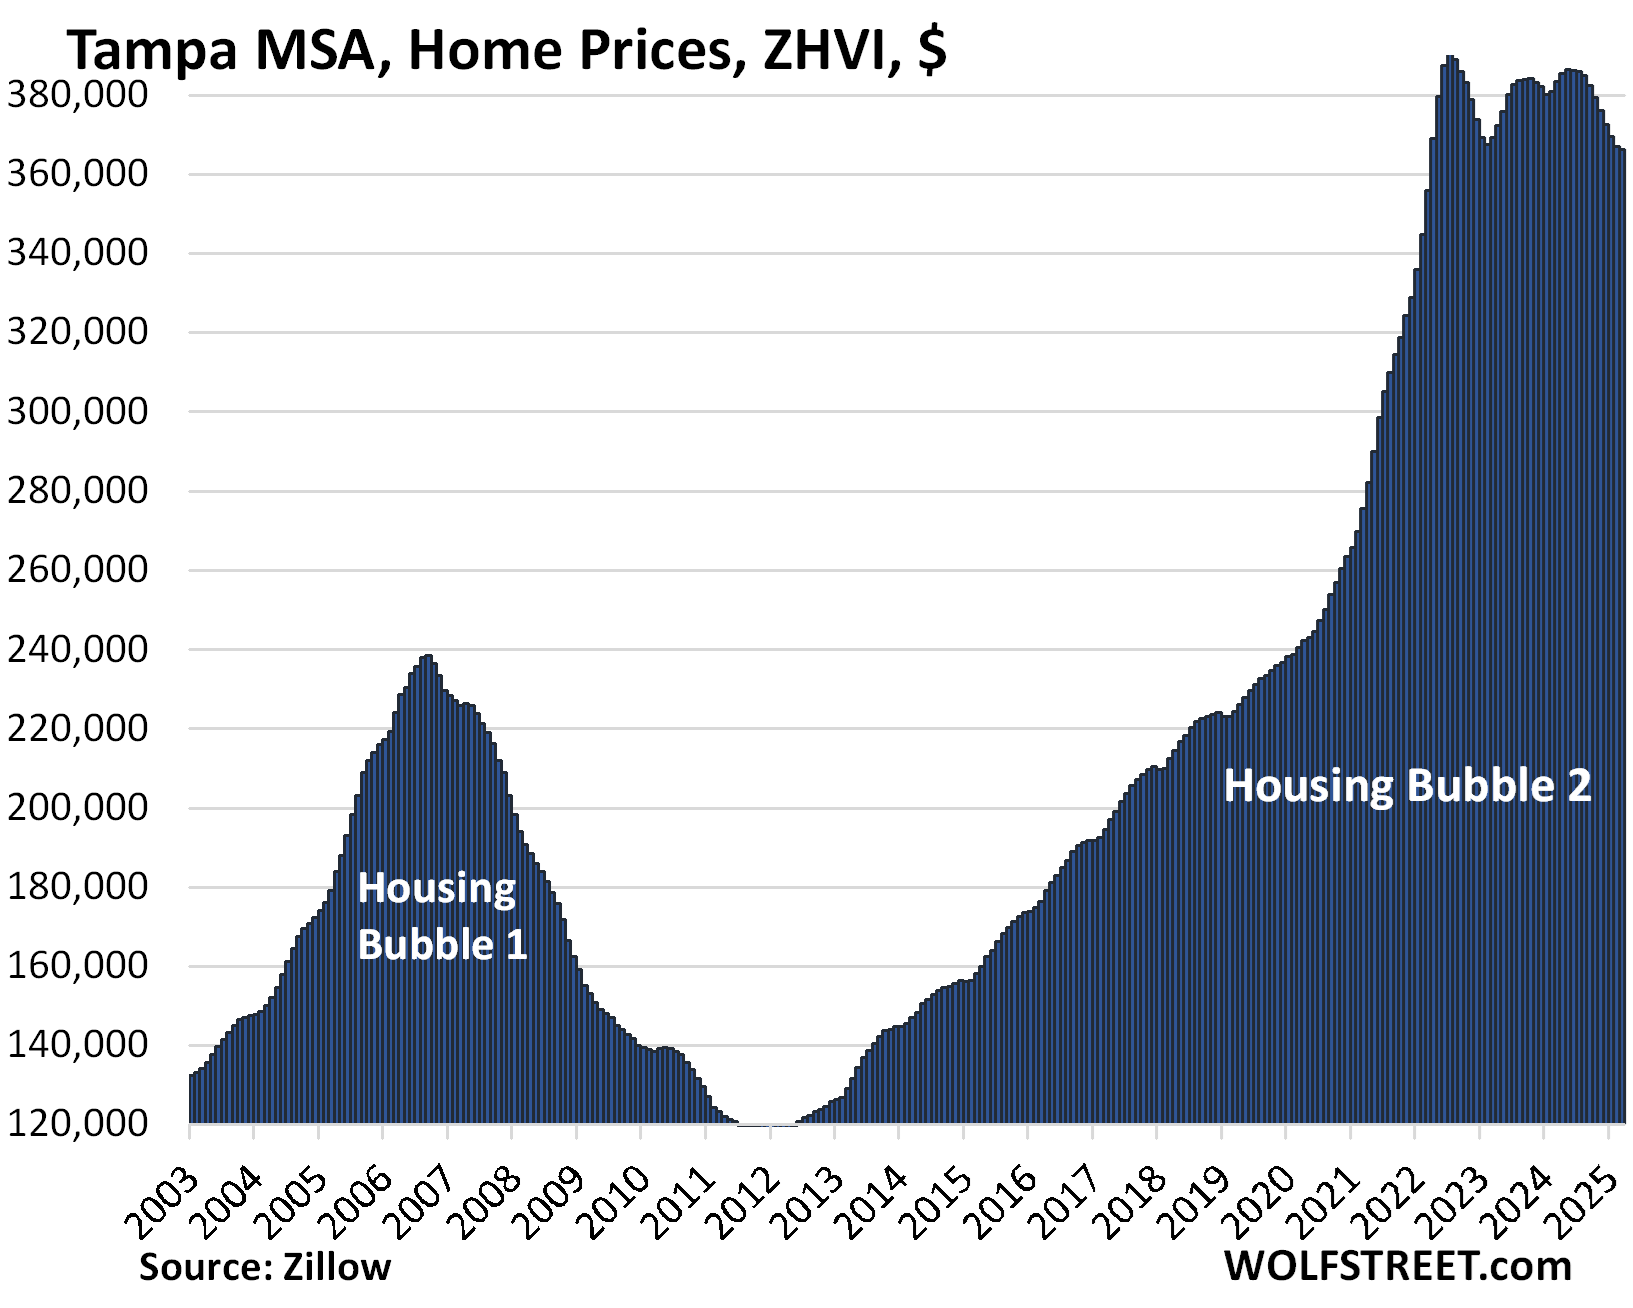
| Tampa MSA, Home Prices | |||
| From Jul 2022 peak | MoM | YoY | Since 2000 |
| -6.2% | -0.3% | -4.5% | 261% |
The YoY drop worsened from -3.6% in February.
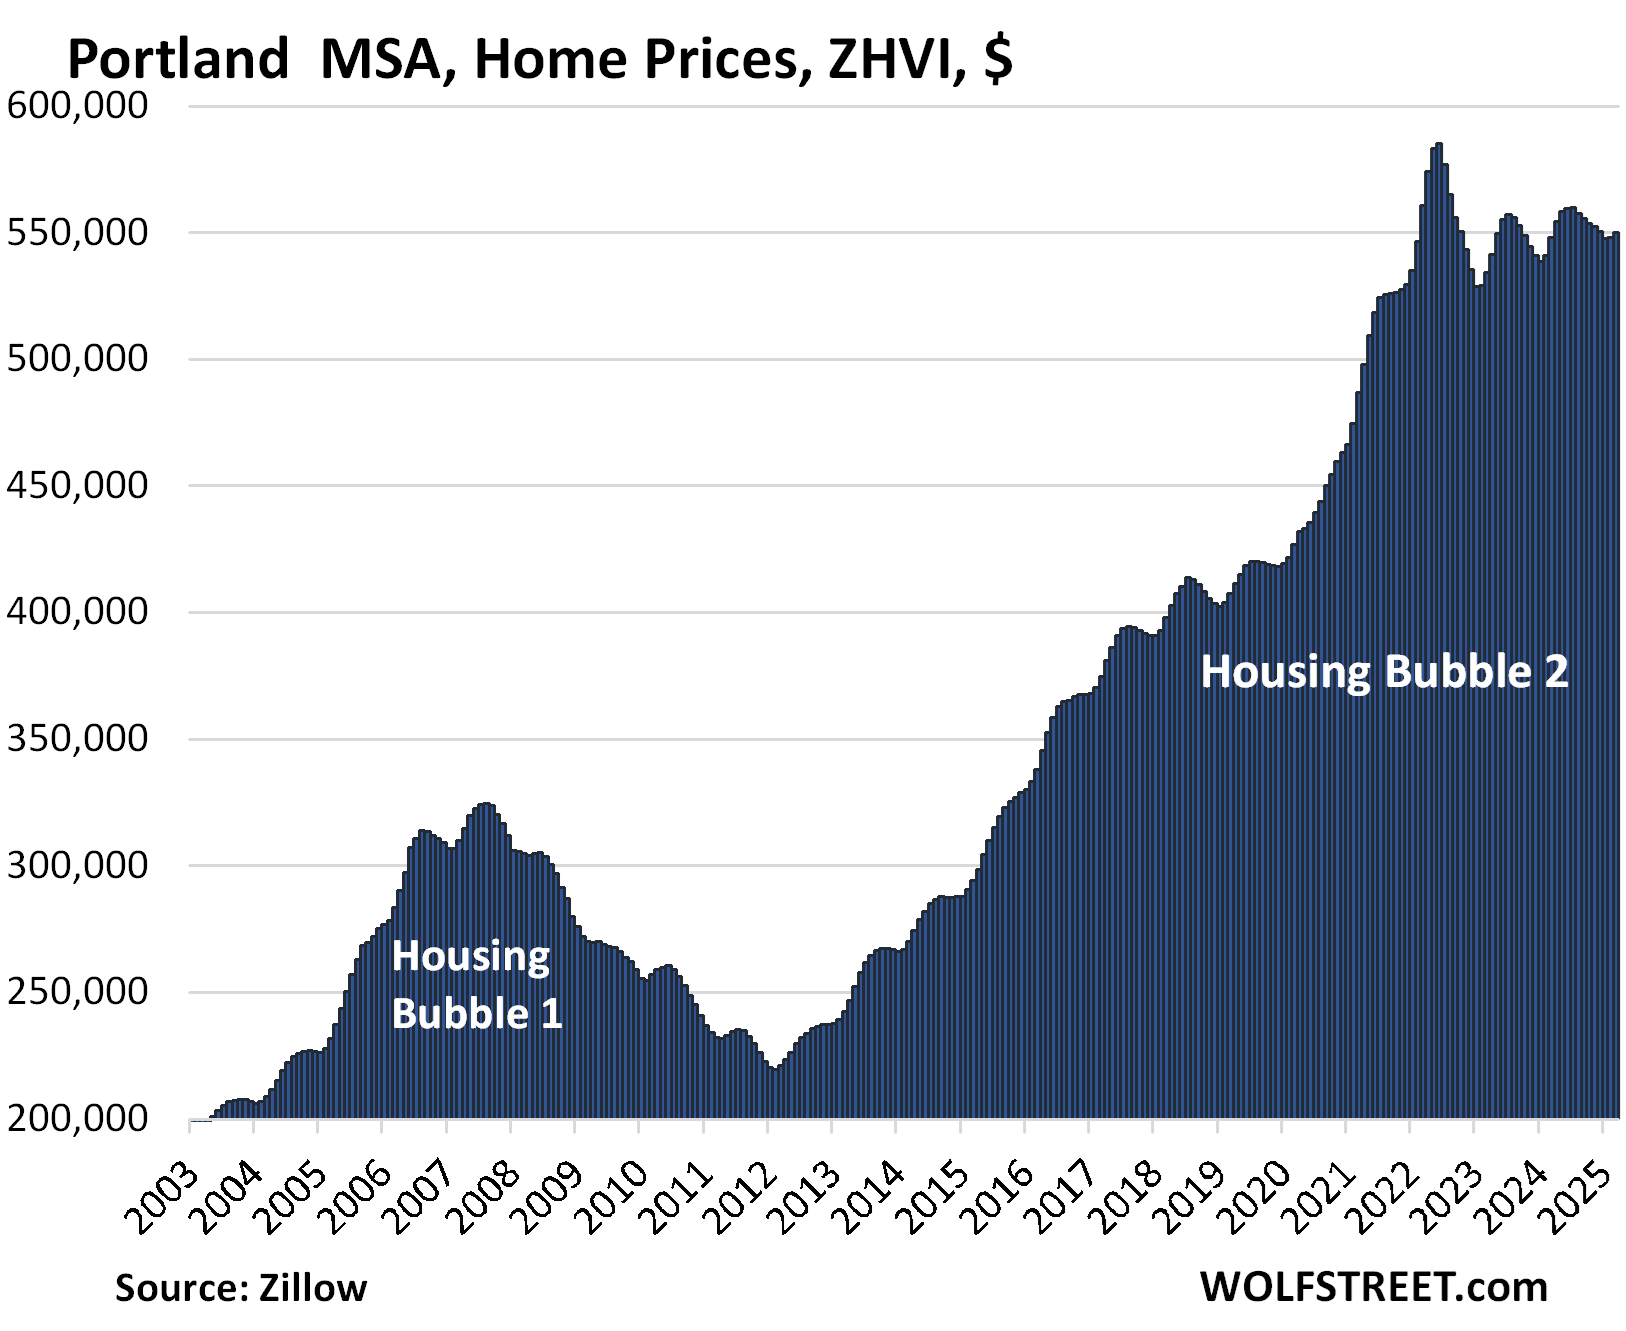
| Portland MSA, Home Prices | |||
| From May 2022 peak | MoM | YoY | Since 2000 |
| -6.0% | 0.3% | 0.3% | 217% |
In February, the YoY gain was +1.3%. Prices are back where they’d first been in January 2022.
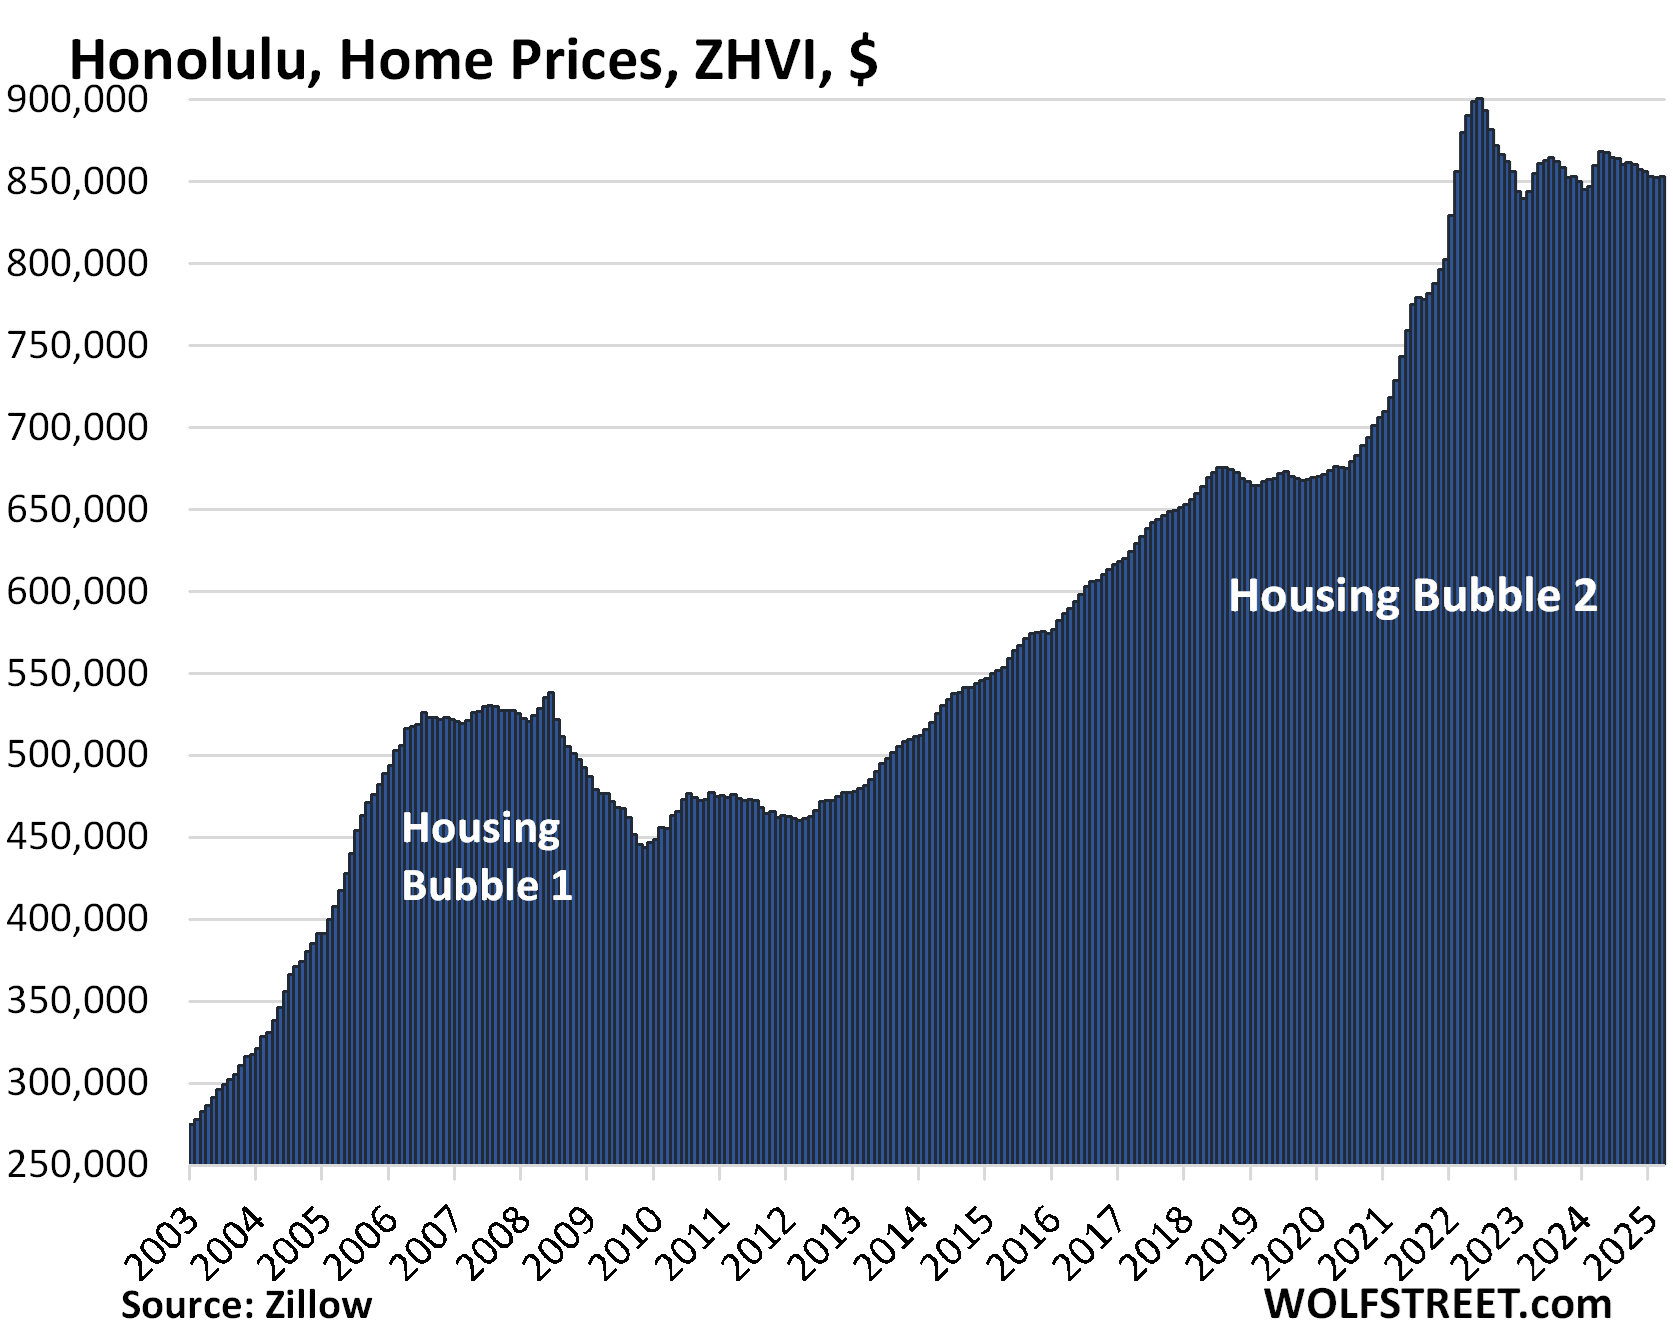
| Honolulu, Home Prices | |||
| From Jun 2022 peak | MoM | YoY | Since 2000 |
| -5.3% | 0.0% | -0.8% | 278% |
The YoY gain in February of +0.6% flipped to a YoY loss in March.
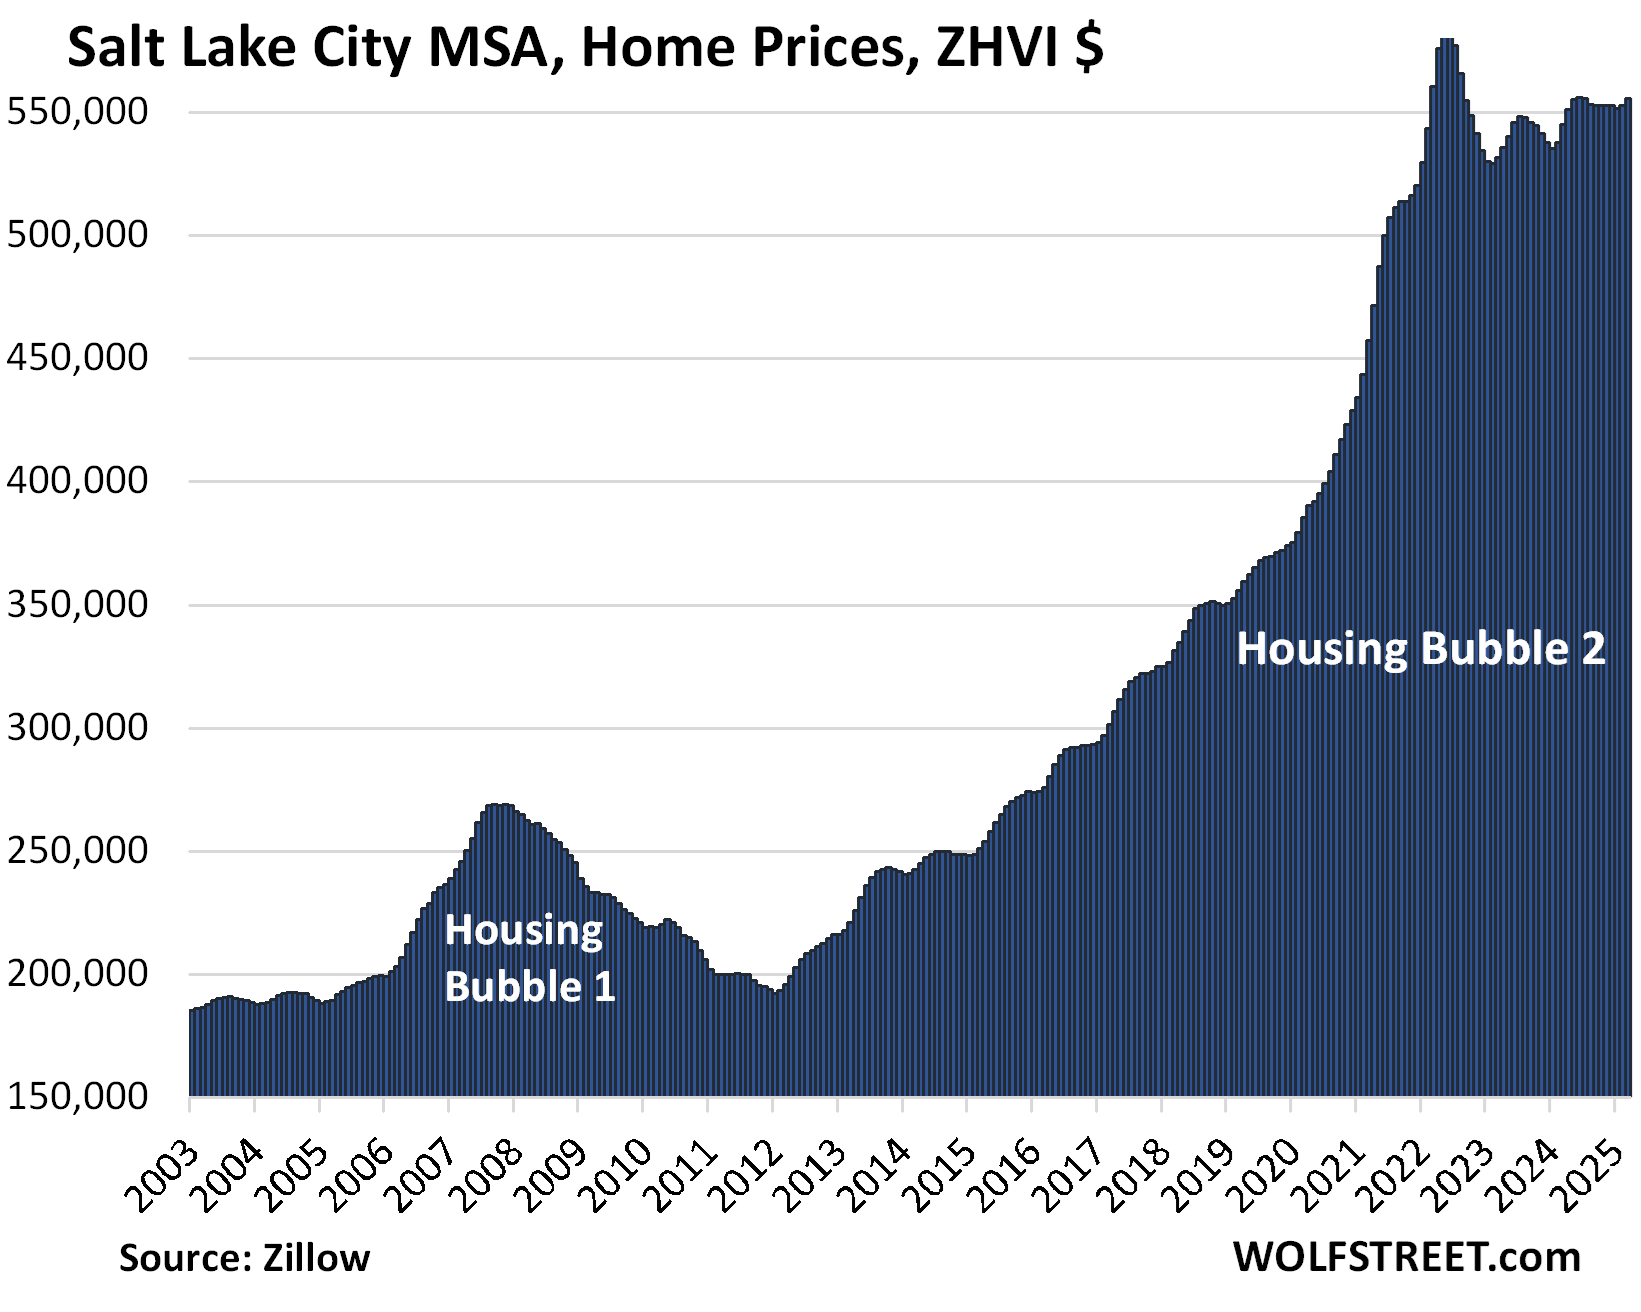
| Salt Lake City MSA, Home Prices | |||
| From July 2022 peak | MoM | YoY | Since 2000 |
| -5.2% | 0.6% | 2.0% | 216% |
In February, the YoY gain was +2.7%. Prices are back where they’d first been in March 2022.
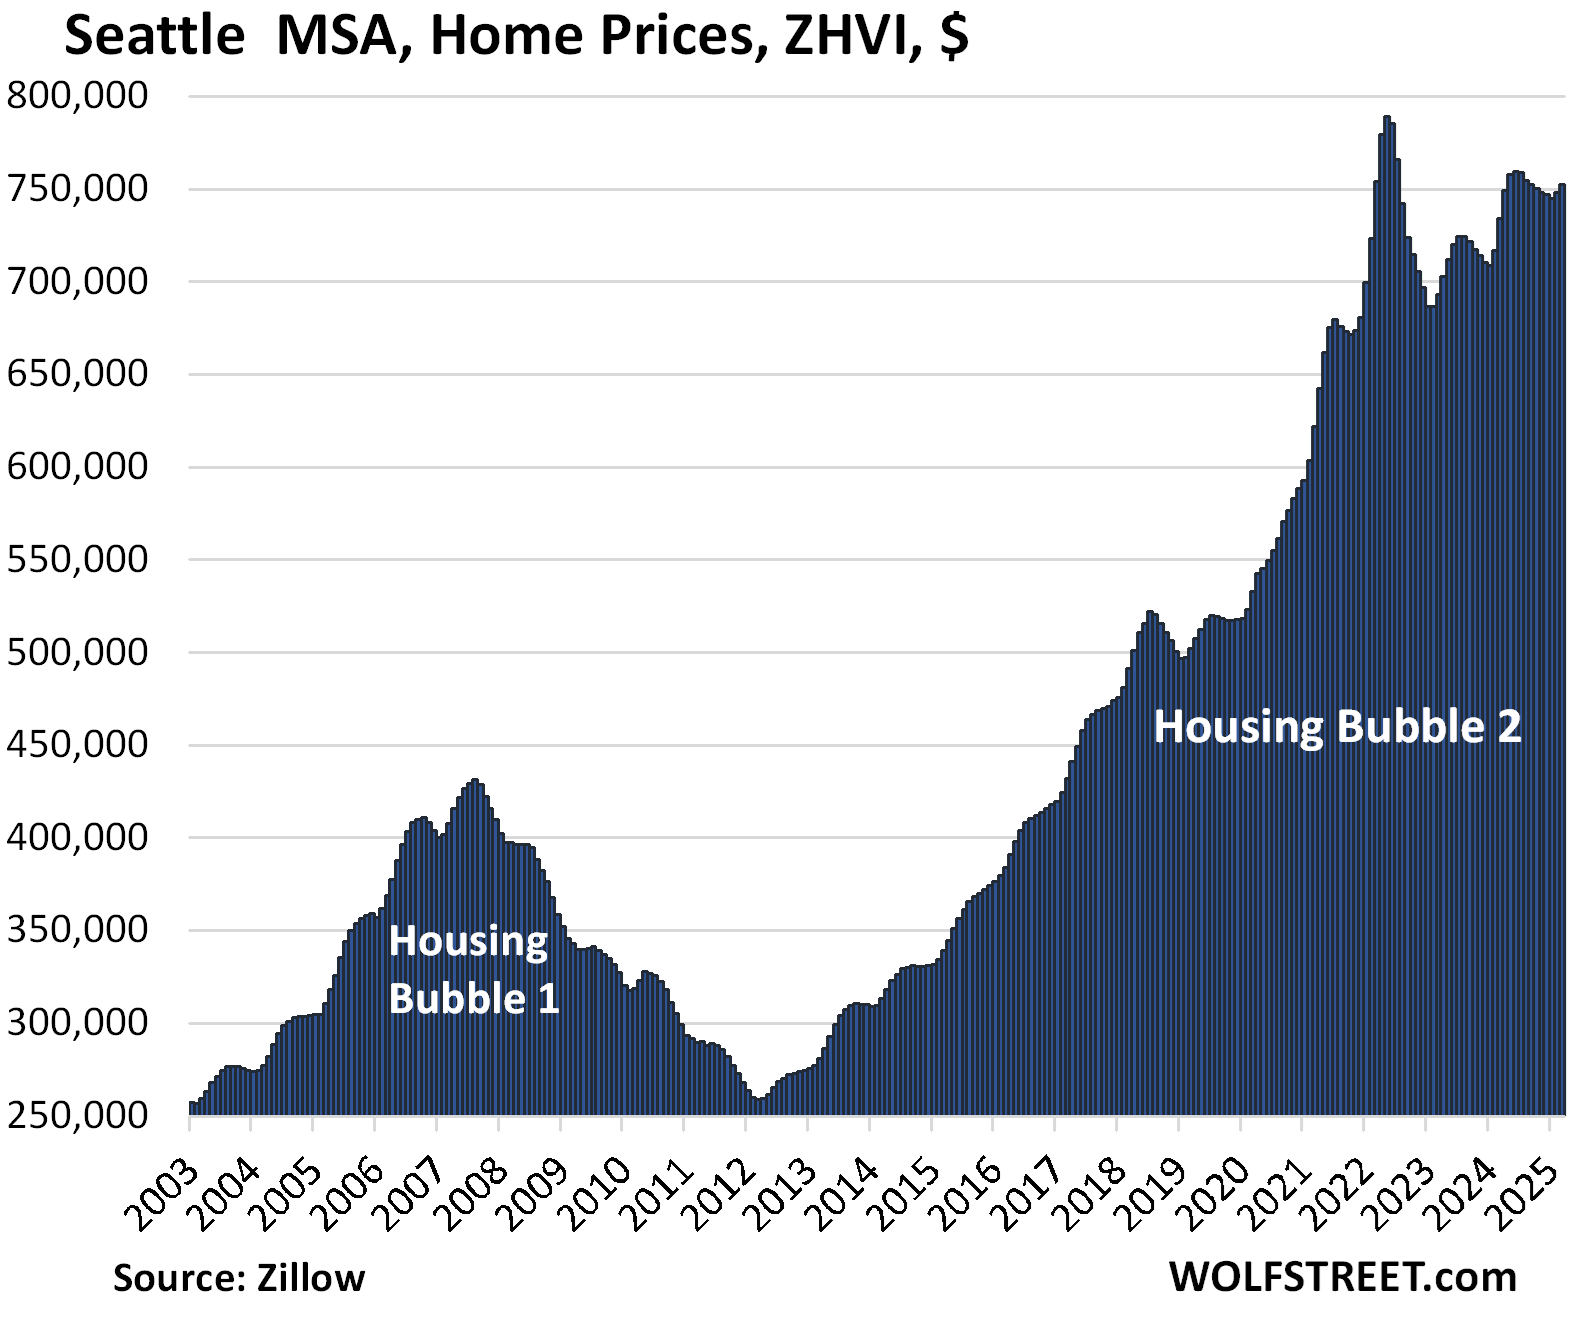
| Seattle MSA, Home Prices | |||
| From May 2022 peak | MoM | YoY | Since 2000 |
| -4.7% | 0.6% | 2.4% | 240% |
The YoY gain in February was +4.3%.
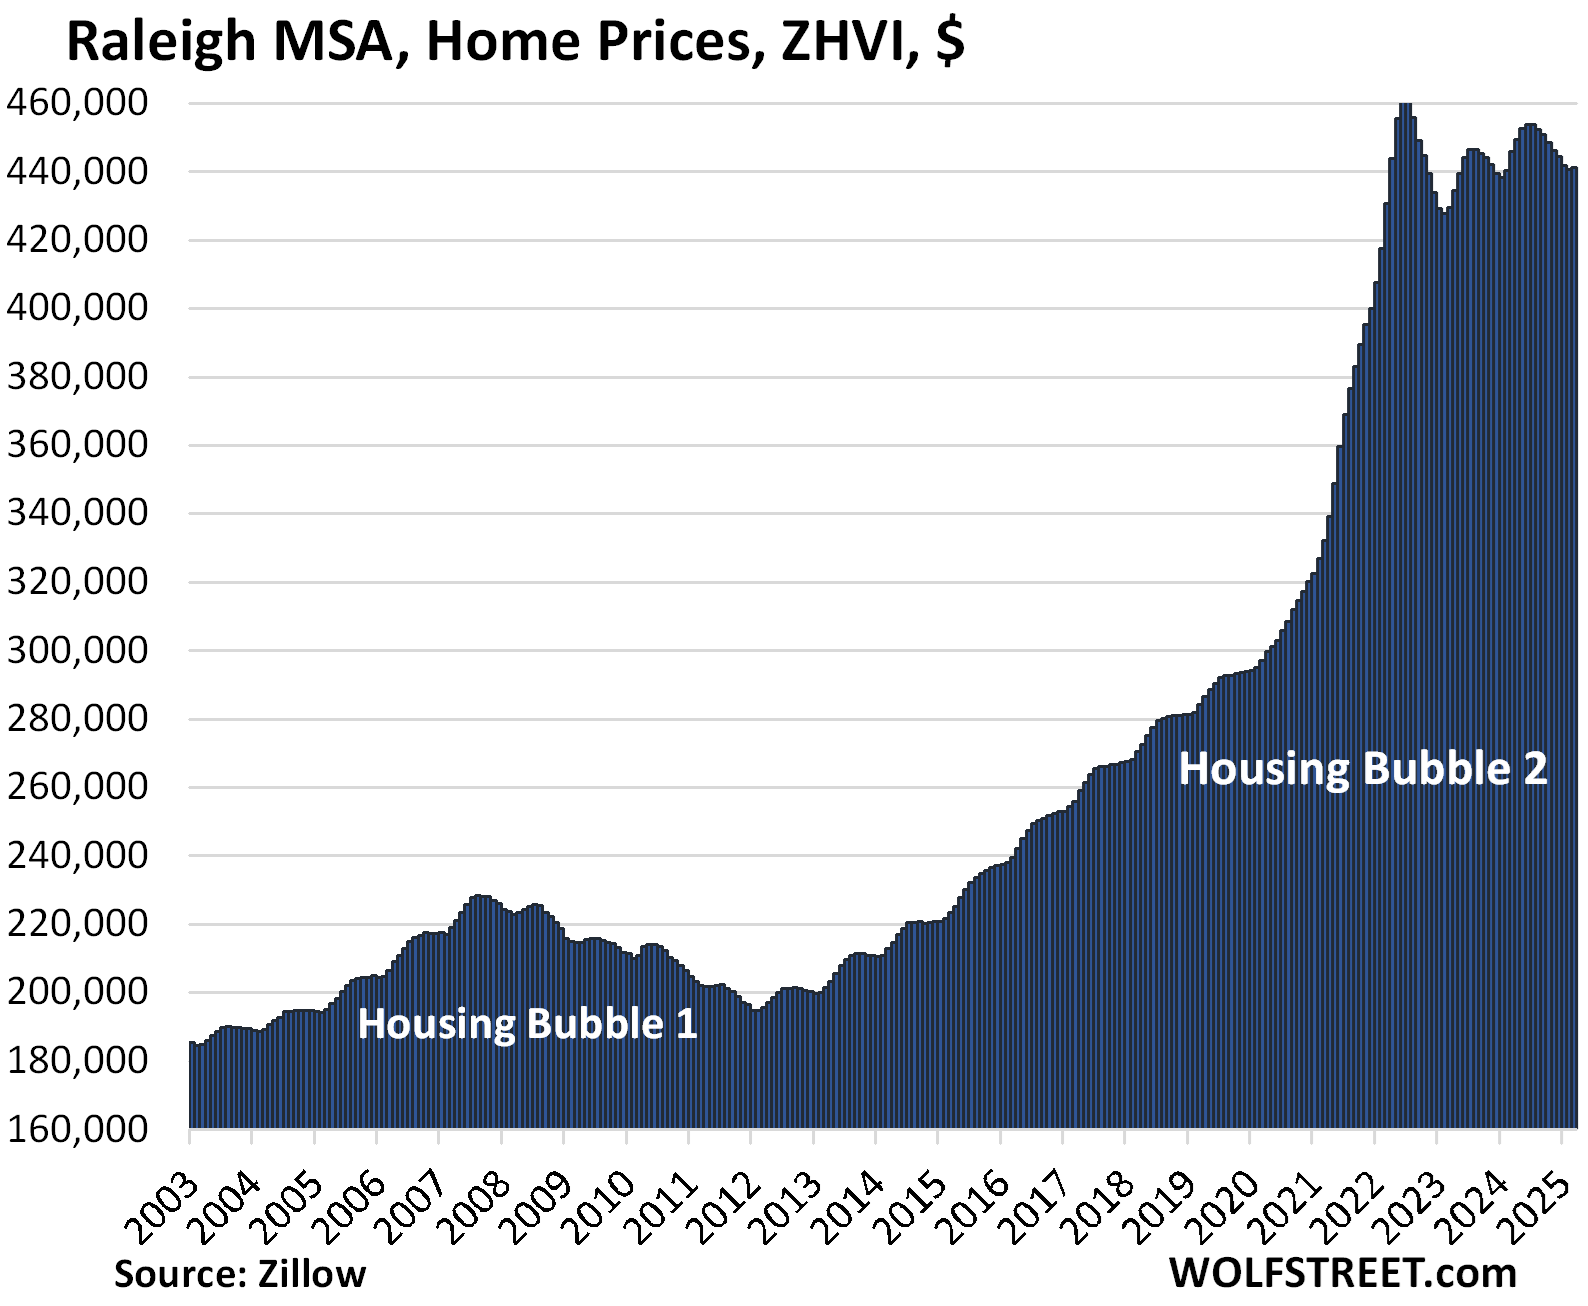
| Raleigh MSA, Home Prices | |||
| From July 2022 peak | MoM | YoY | Since 2000 |
| -4.5% | 0.2% | -1.0% | 156% |
A deterioration from February’s YoY 0%.
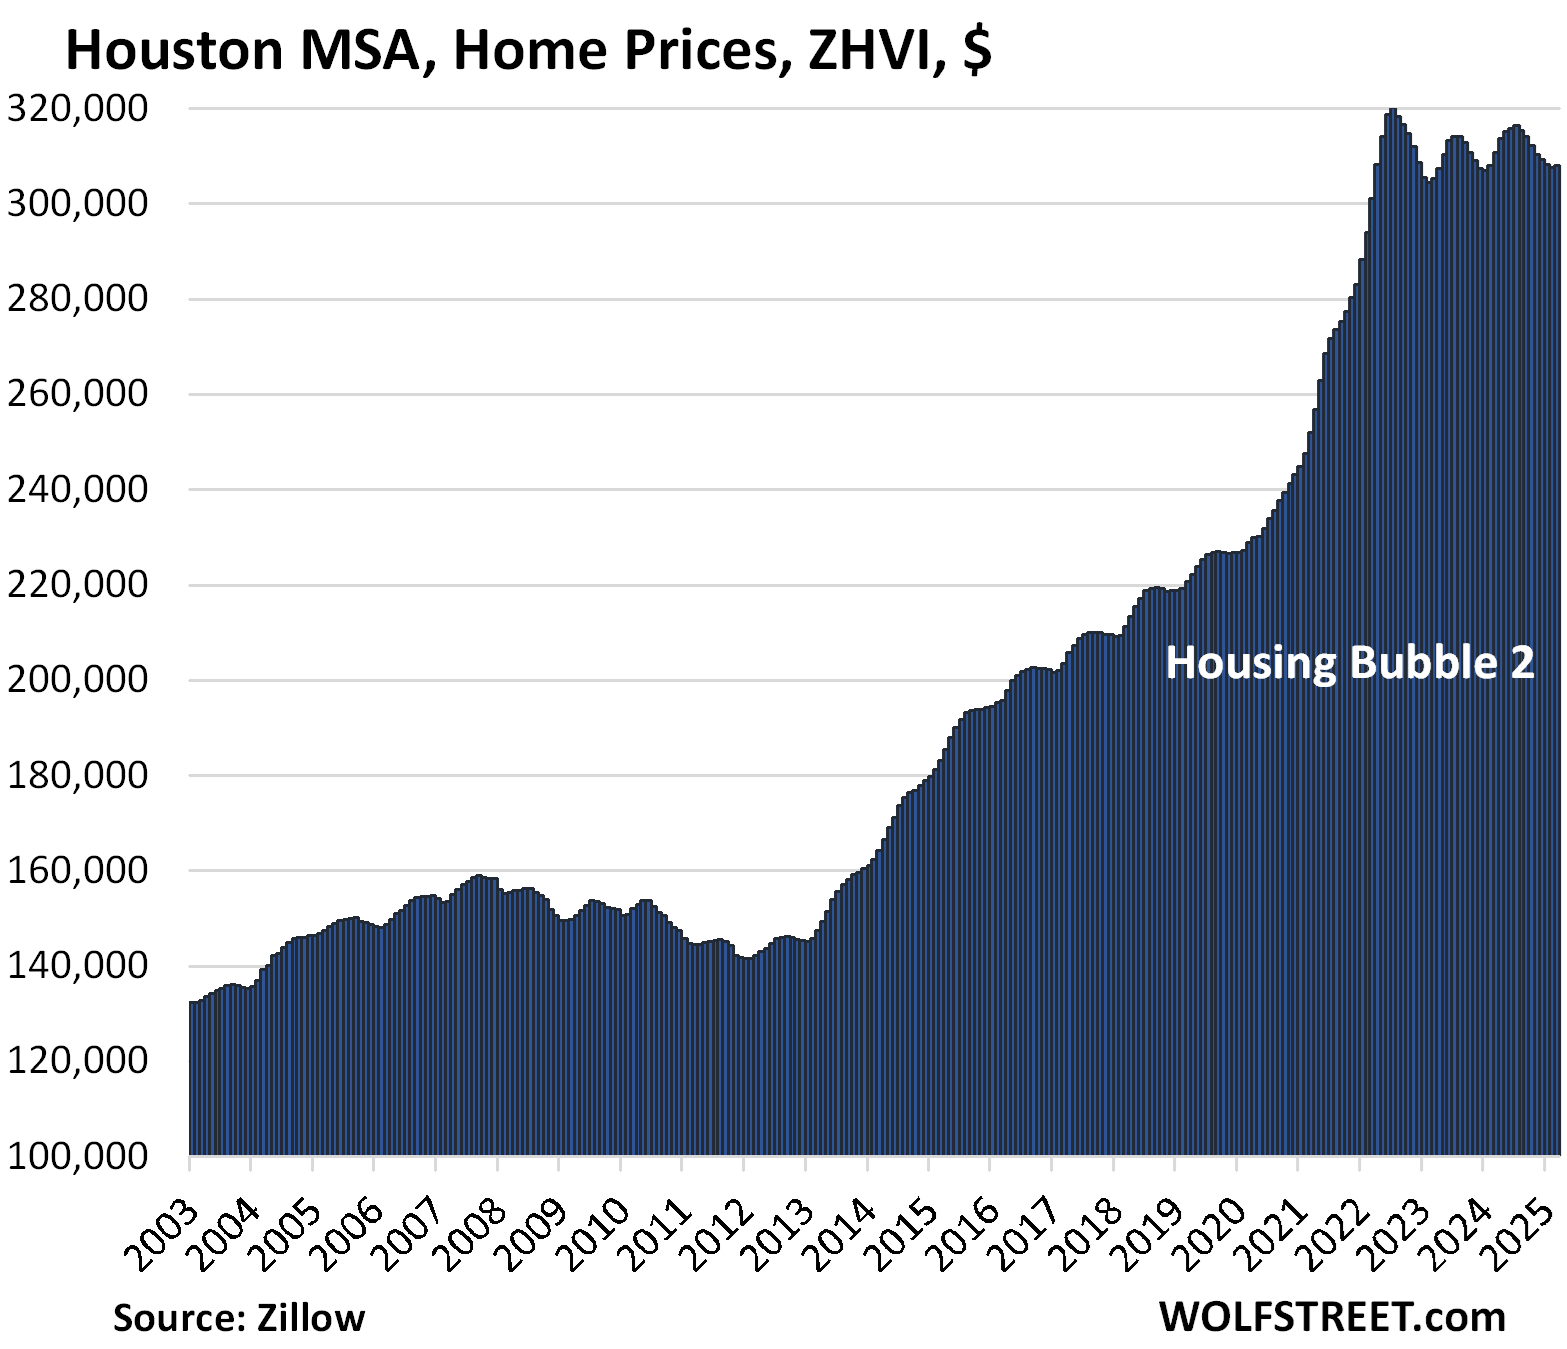
| Houston MSA, Home Prices | |||
| From Jul 2022 peak | MoM | YoY | Since 2000 |
| -3.8% | 0.1% | -0.9% | 149% |
The YoY decline worsened from -0.2% in February. The index is where it had first been in April 2022.
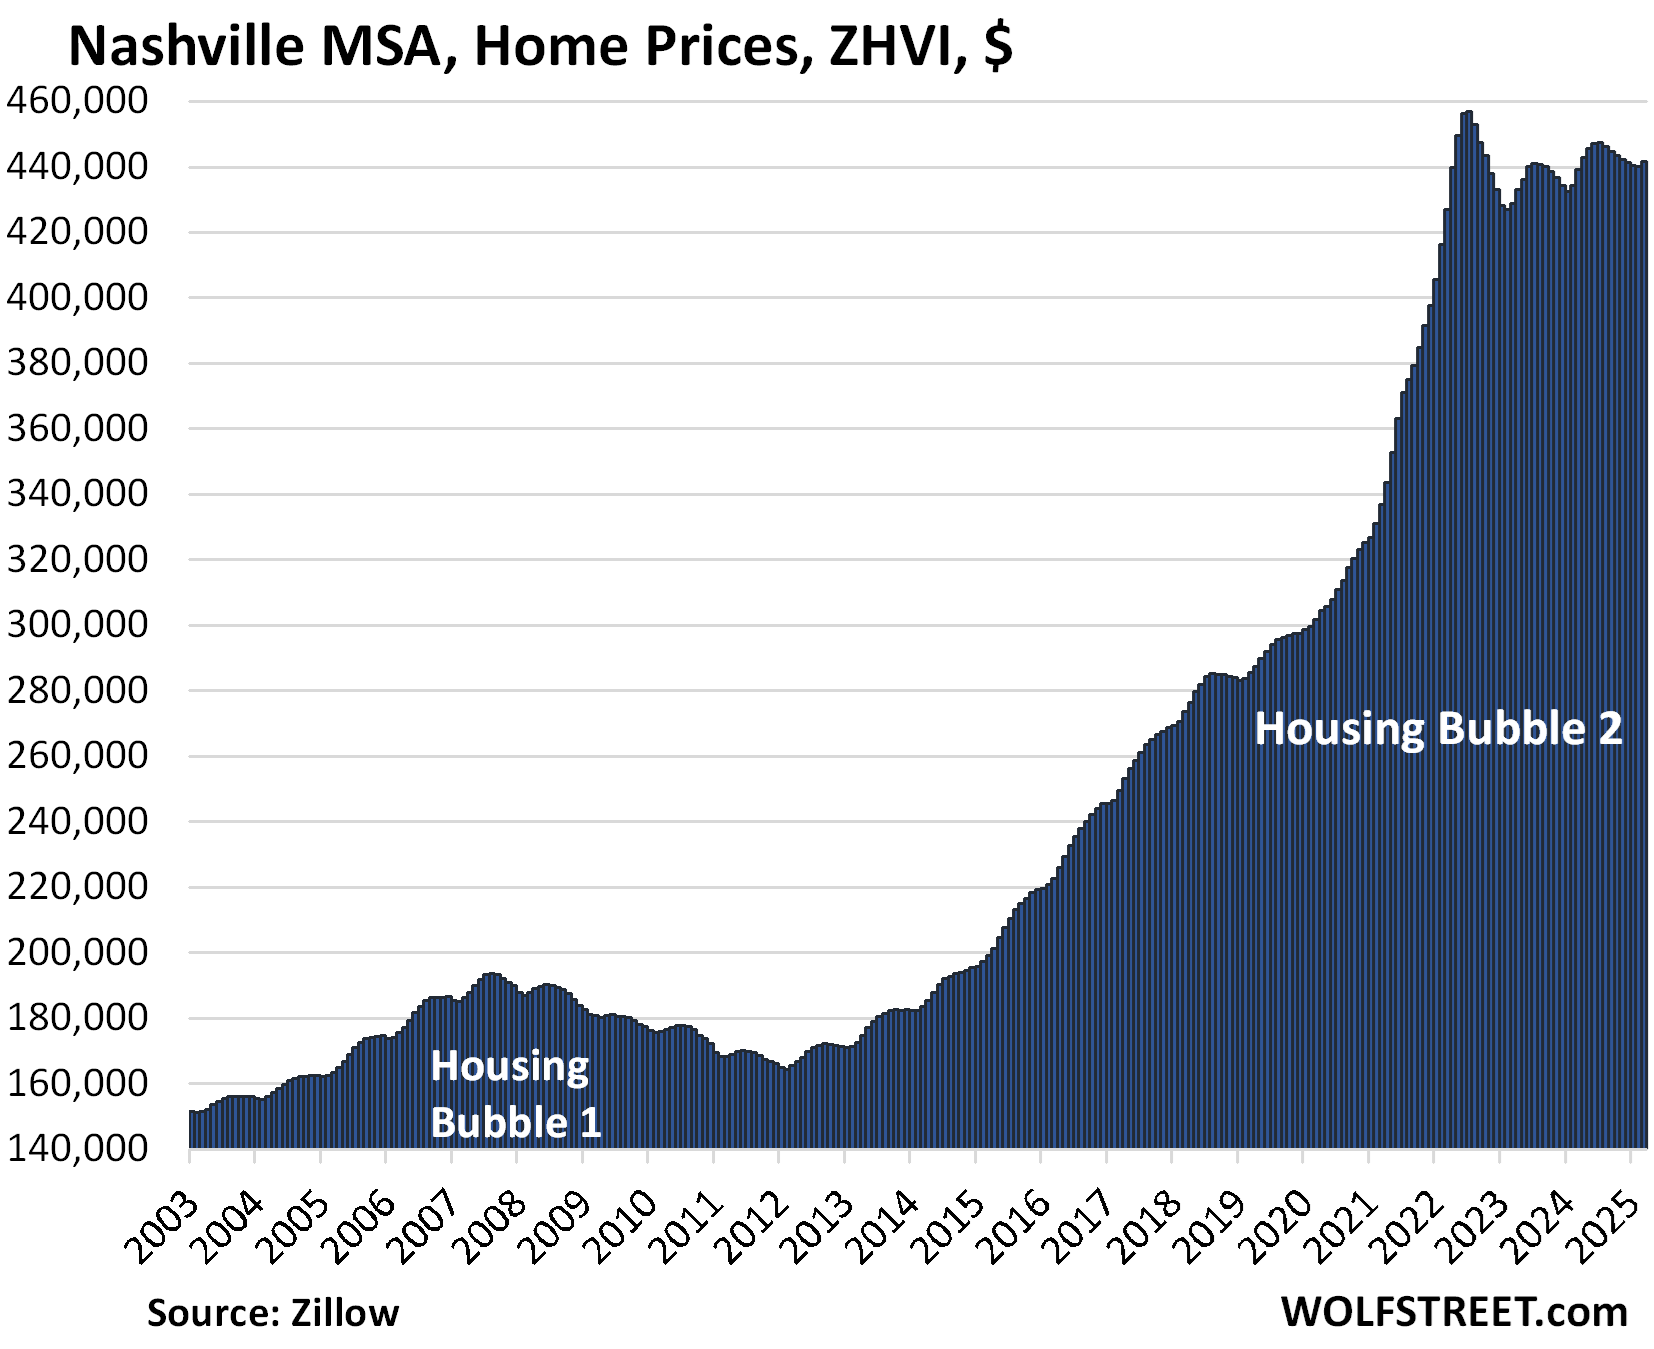
| Nashville MSA, Home Prices | |||
| From July 2022 peak | MoM | YoY | Since 2000 |
| -3.3% | 0.4% | 0.5% | 217% |
In February, the YoY gain was +1.3%. The index is where it had been in April 2022.
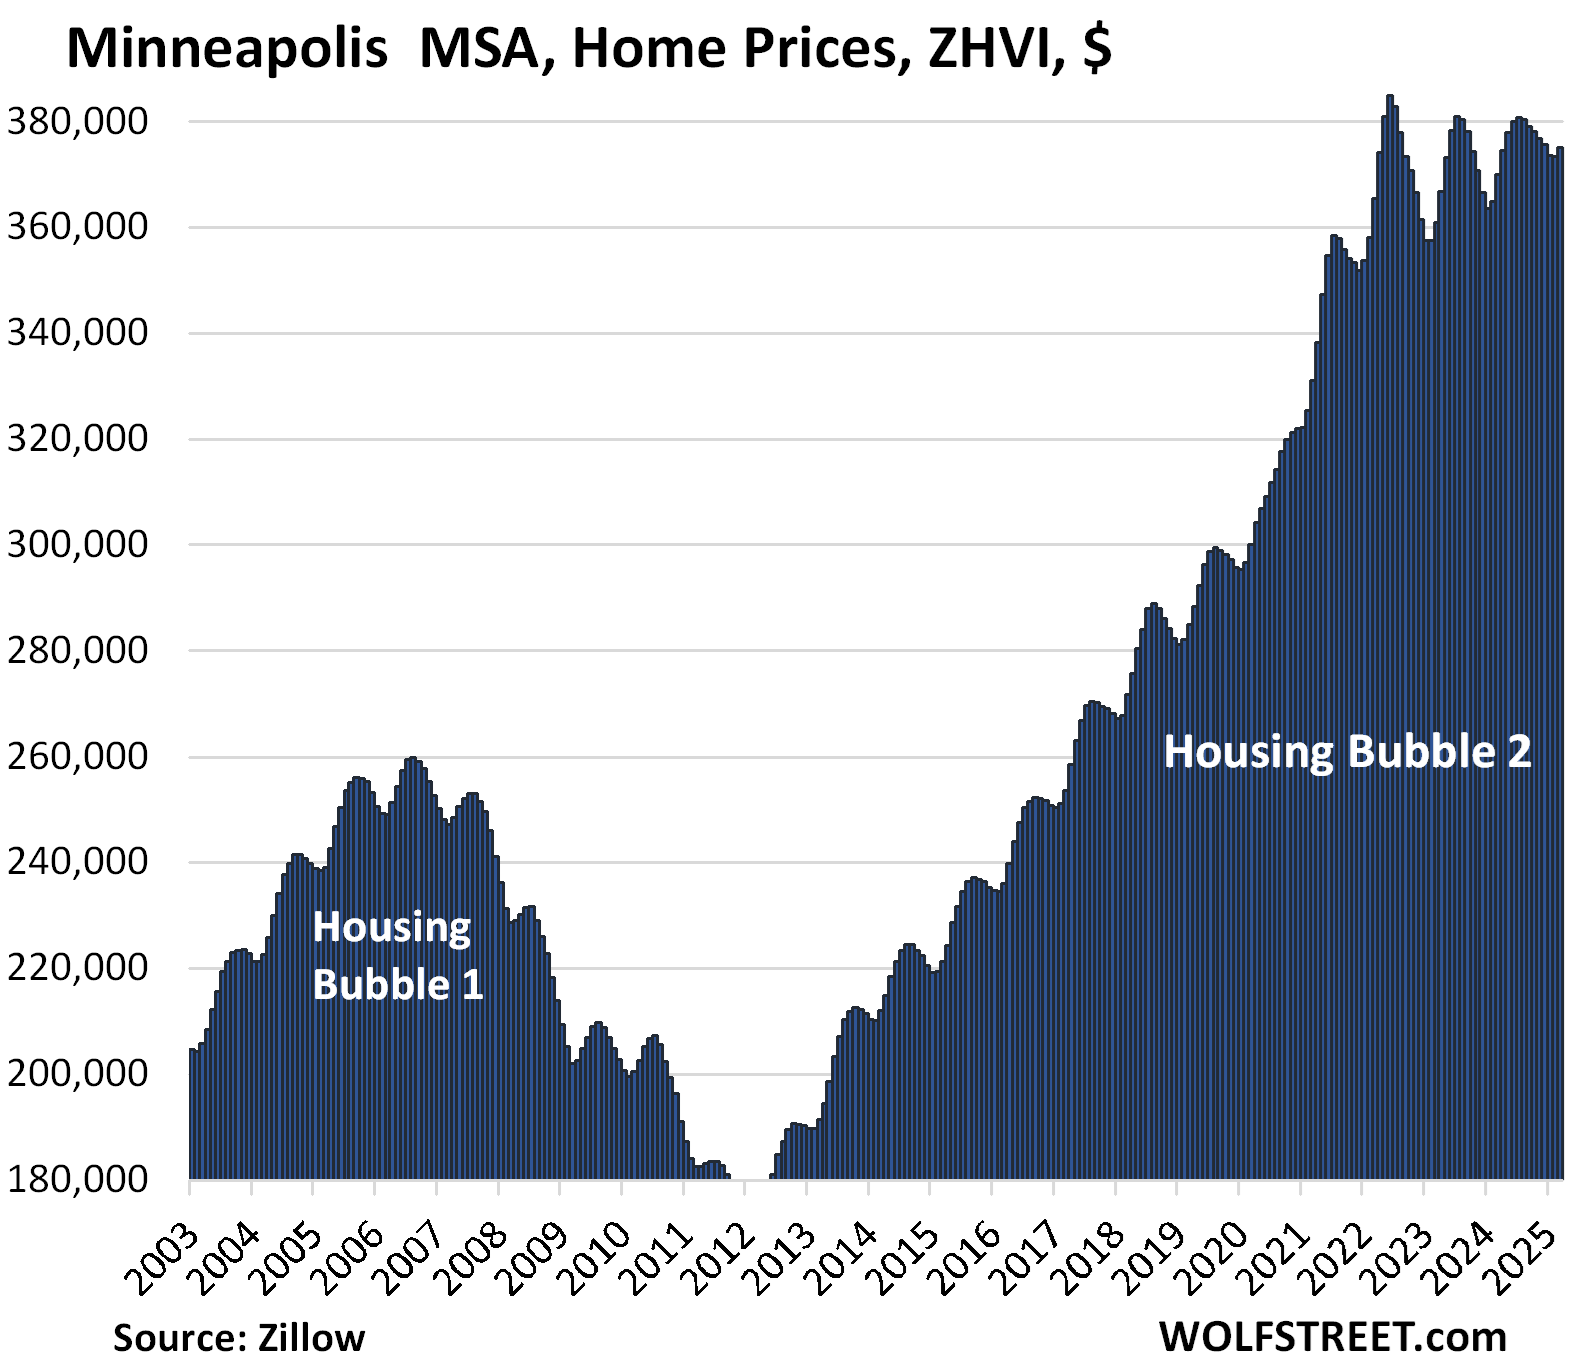
| Minneapolis MSA, Home Prices | |||
| From May 2022 peak | MoM | YoY | Since 2000 |
| -2.5% | 0.4% | 1.3% | 156% |
The YoY gain in February was +2.4%.
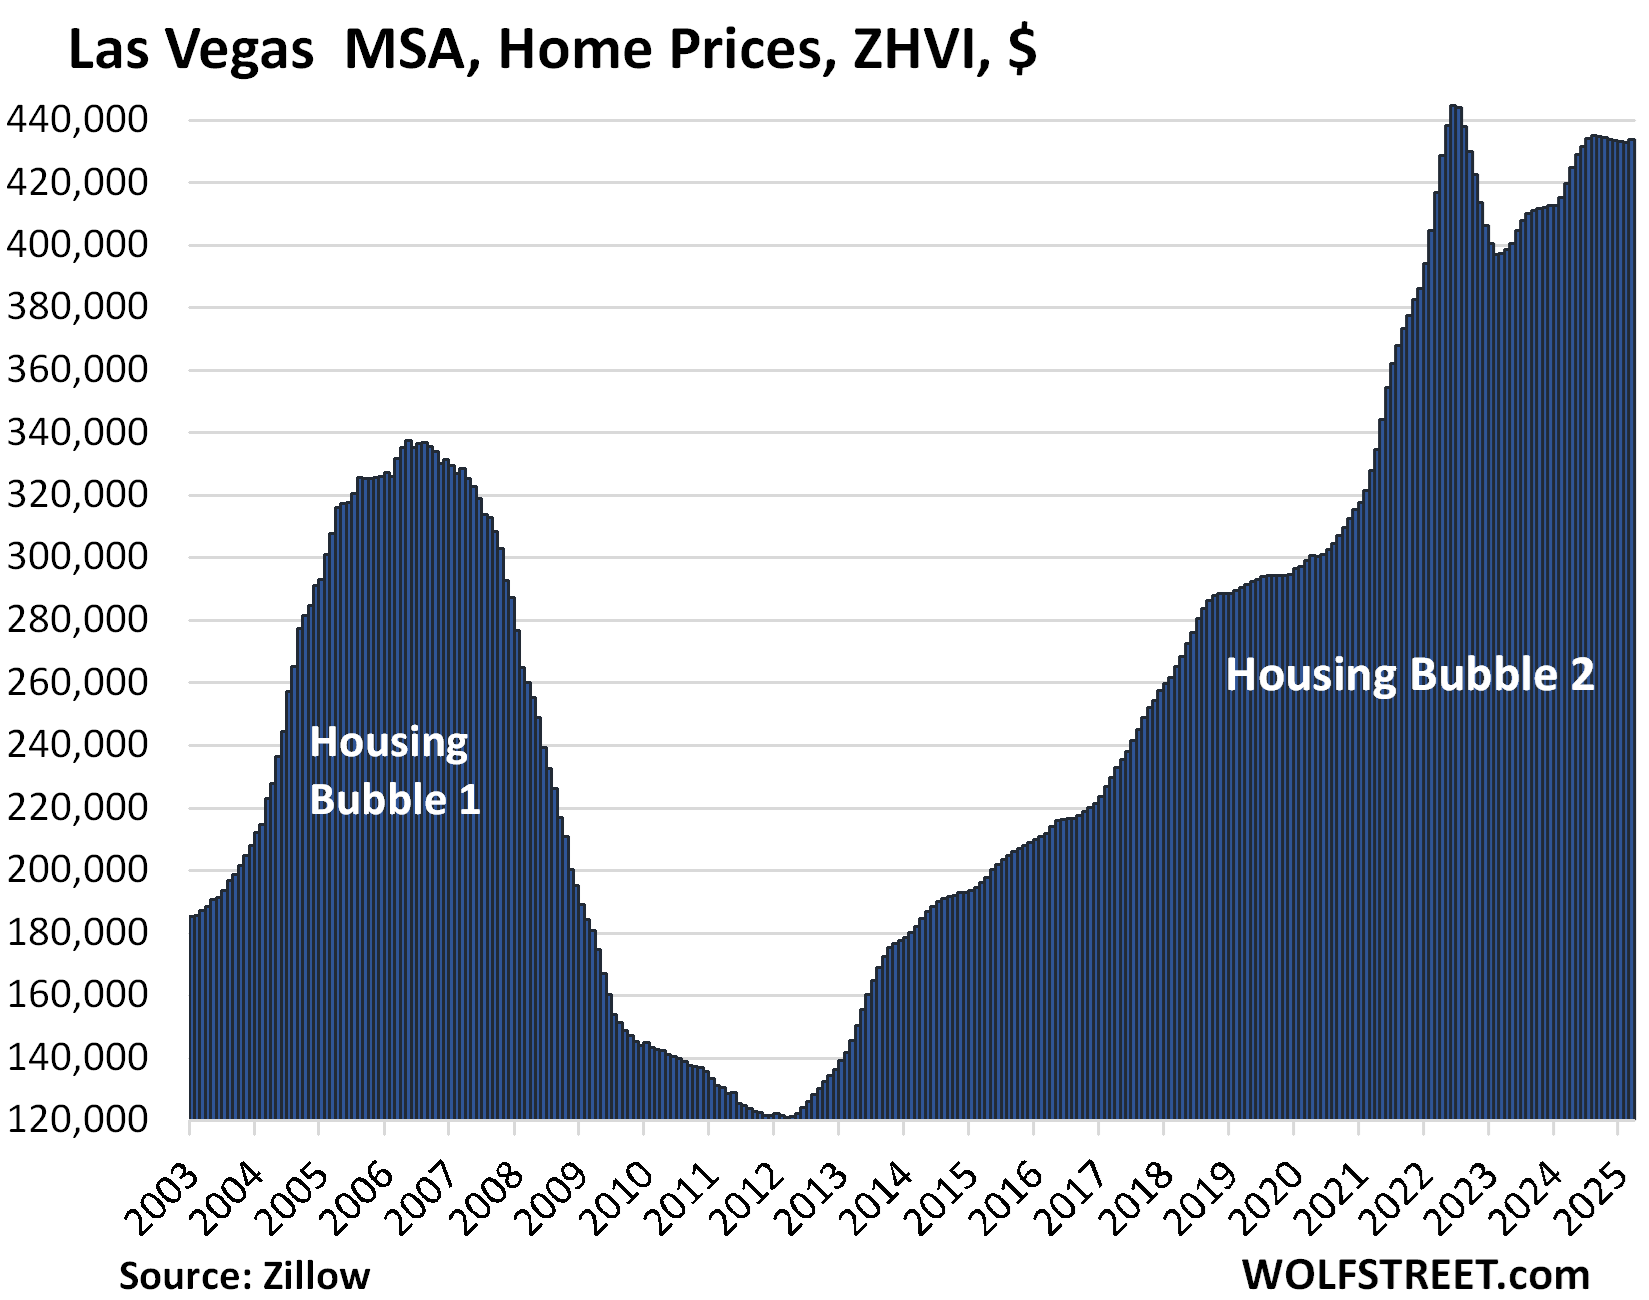
| Las Vegas MSA, Home Prices | |||
| From June 2022 peak | MoM | YoY | Since 2000 |
| -2.5% | 0.2% | 3.3% | 179% |
In February, the YoY gain was +4.2%.
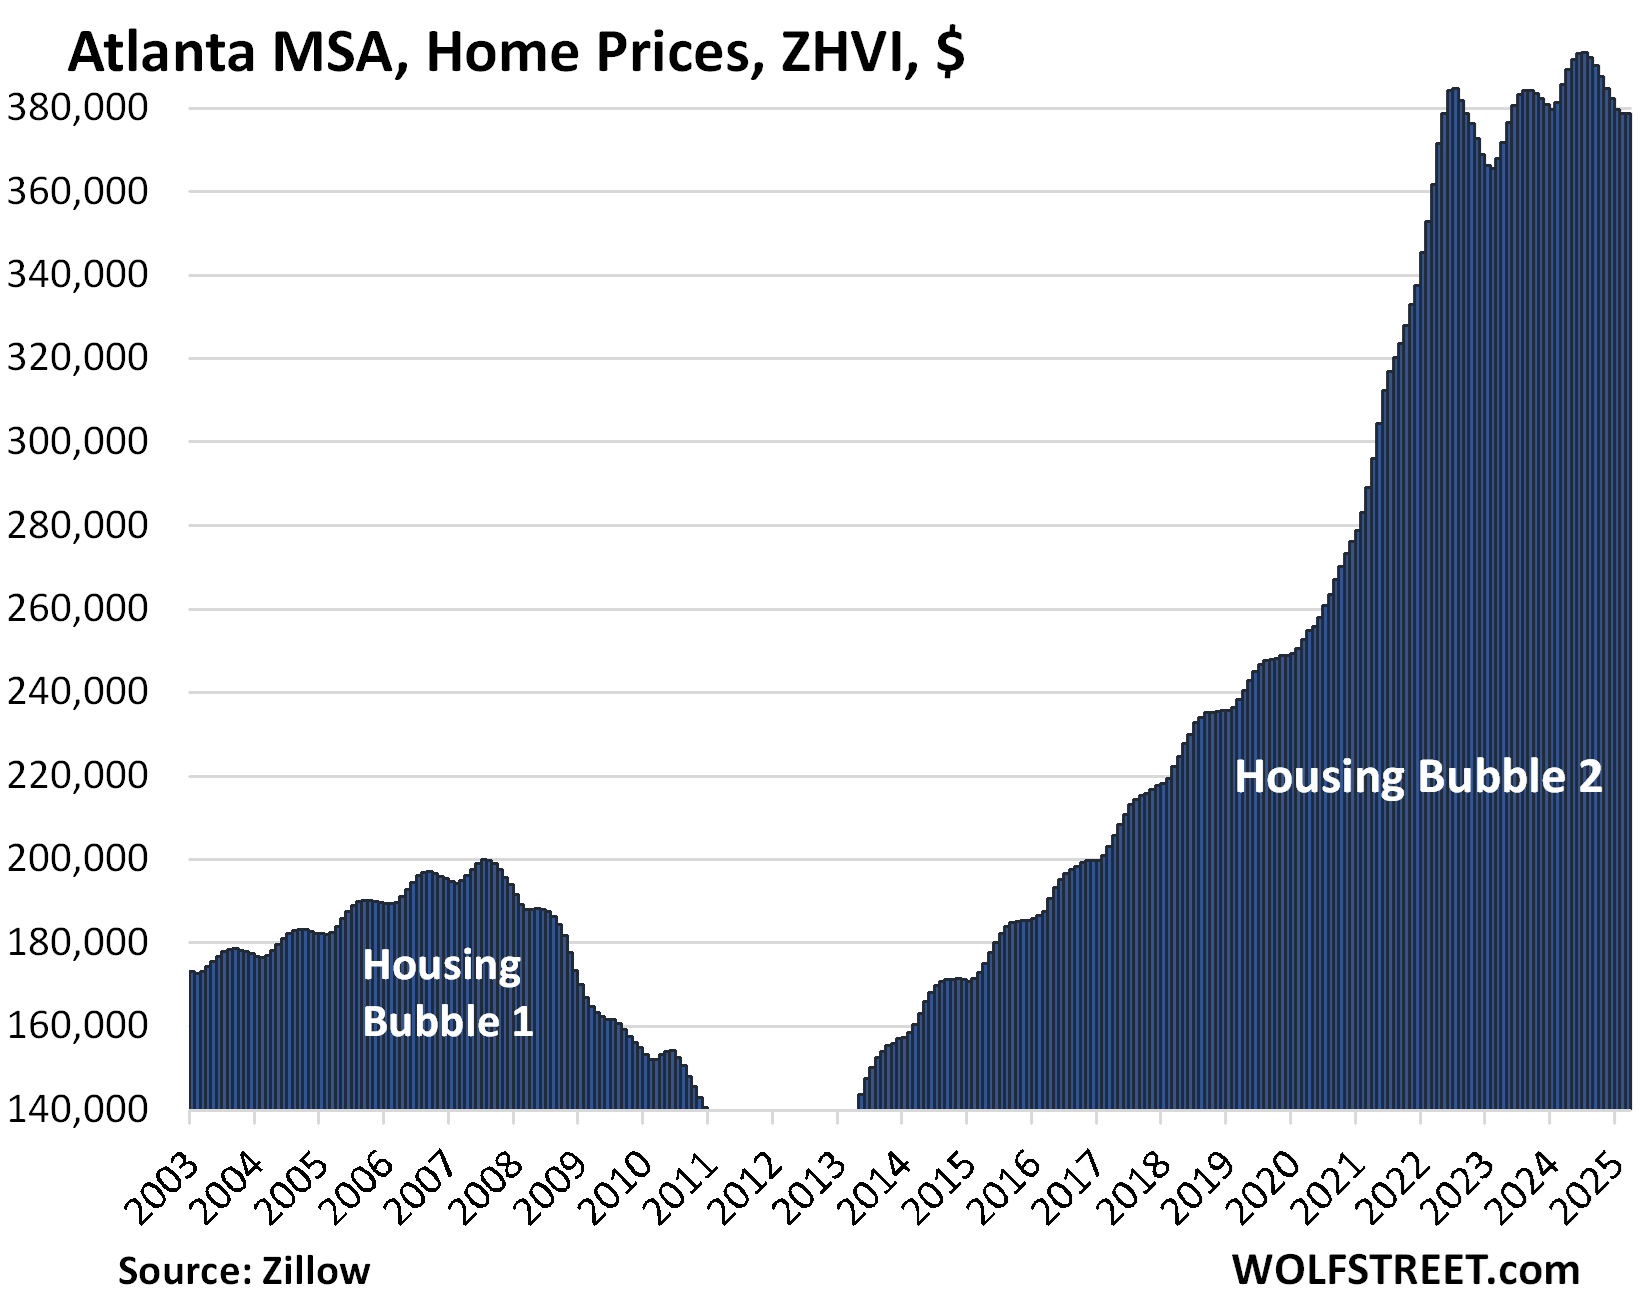
| Atlanta MSA, Home Prices | |||
| From July 2022 | MoM | YoY | Since 2000 |
| -1.5% | 0.0% | -1.8% | 158% |
In February, the YoY decline was -0.7%.
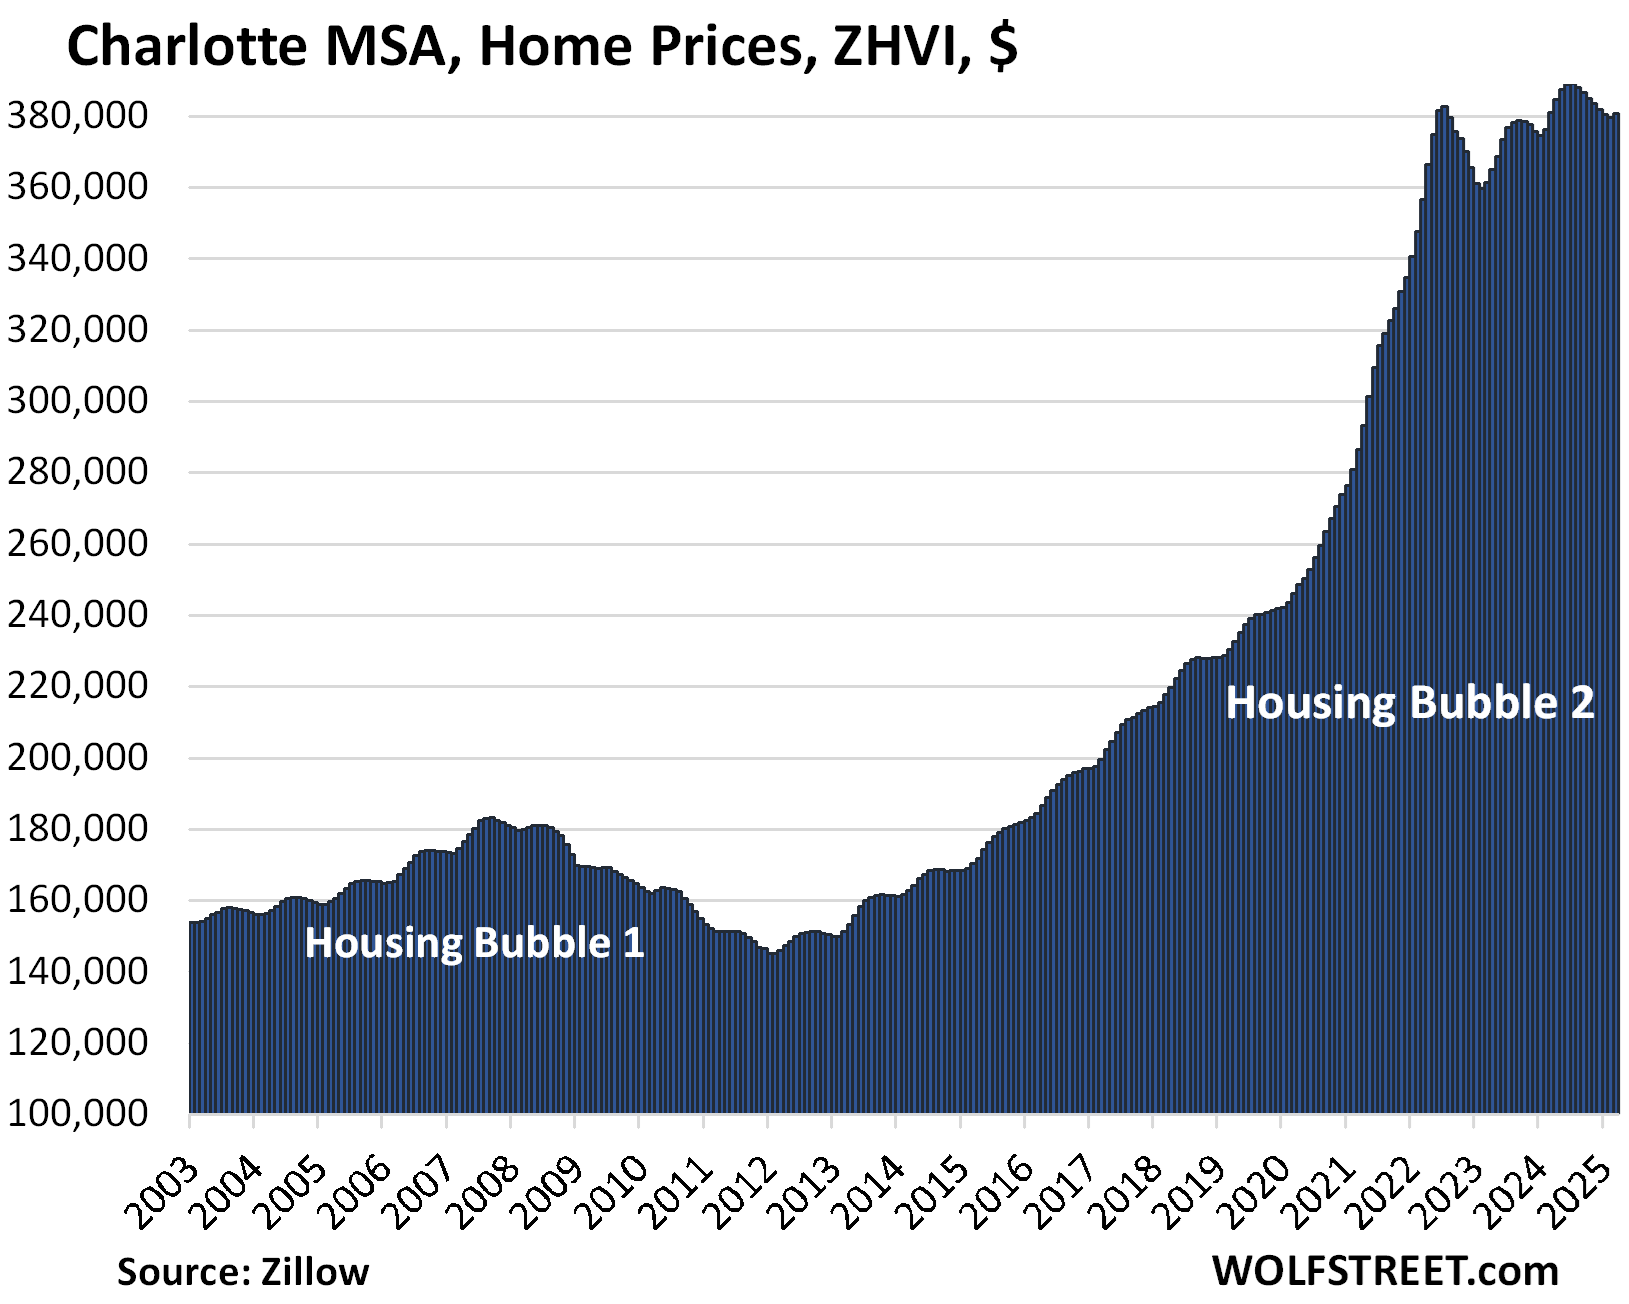
| Charlotte MSA, Home Prices | |||
| From June 2022 | MoM | YoY | Since 2000 |
| -0.5% | 0.3% | -0.1% | 168% |
The index flipped from a YoY gain in February (+0.9%) to a YoY decline in March (-0.1%).
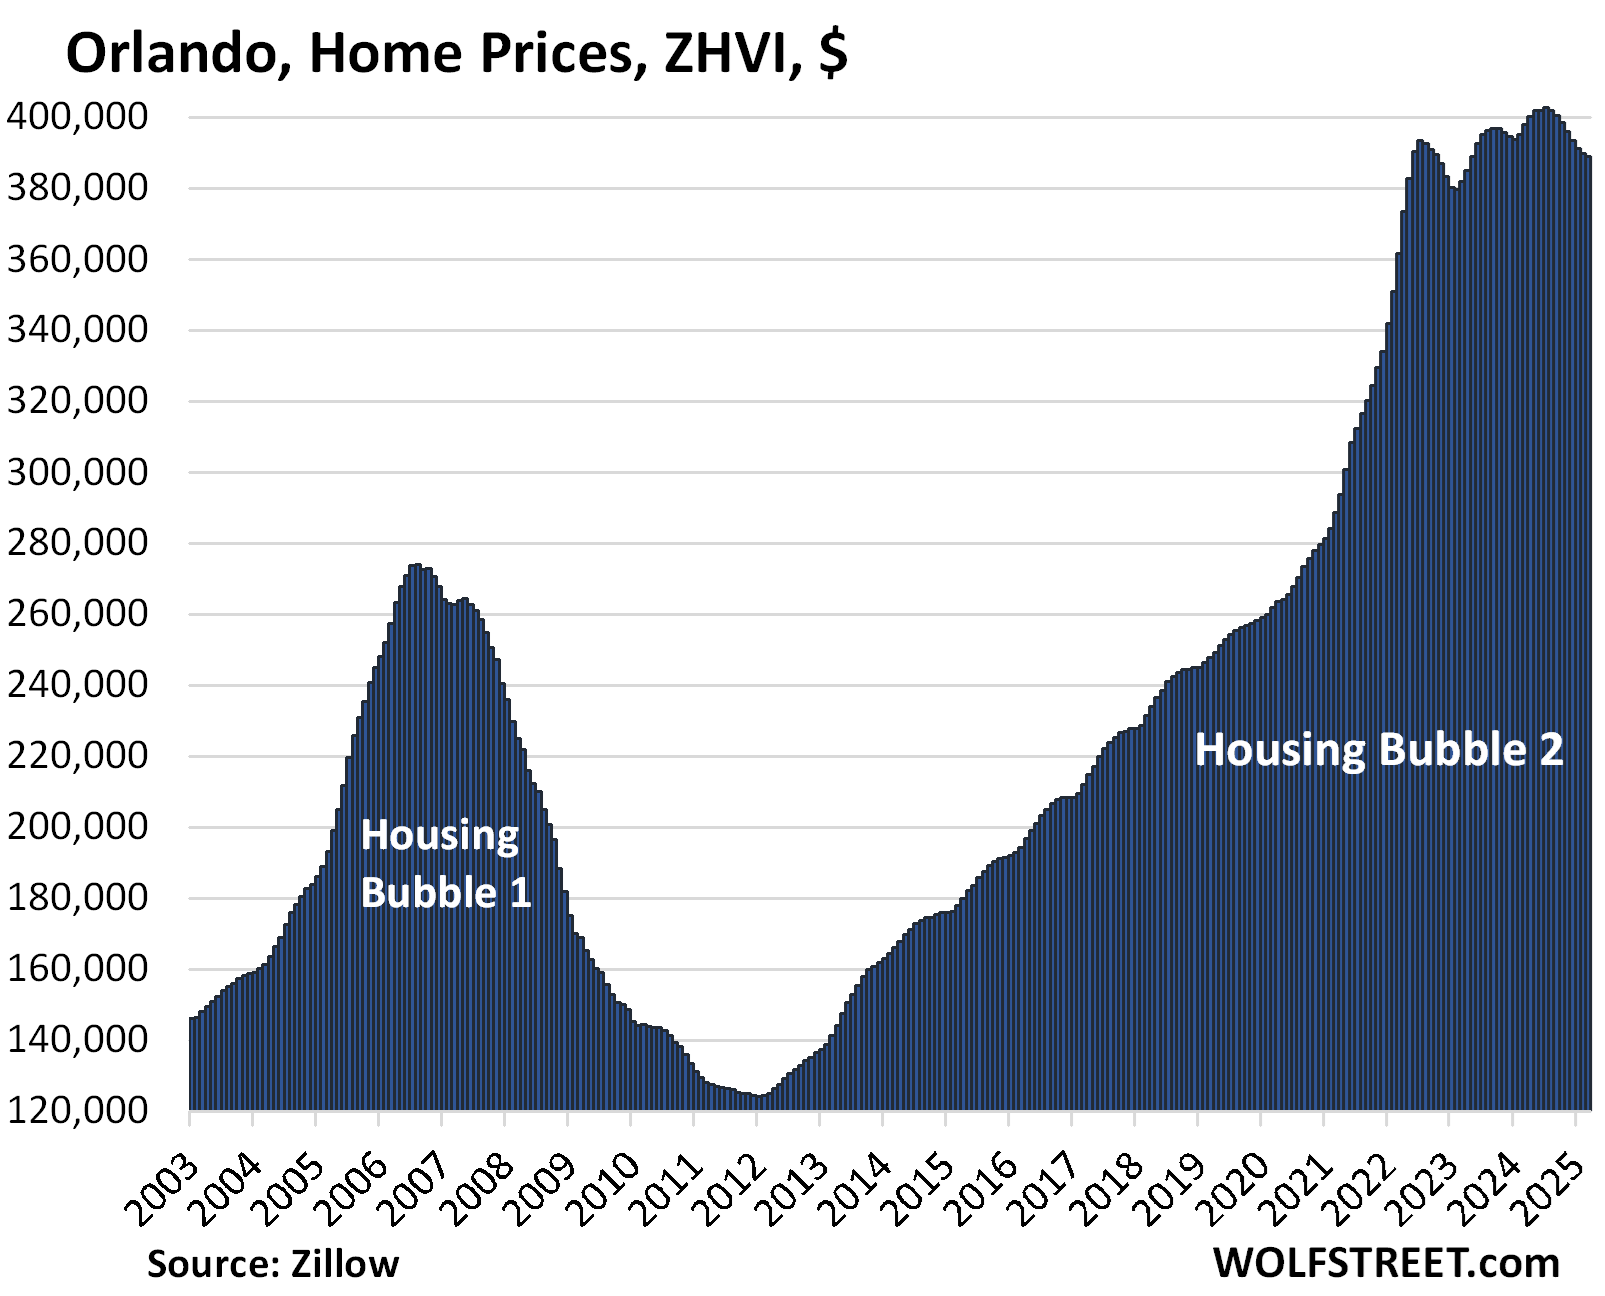
| Orlando MSA, Home Prices | |||
| From June 2022 | MoM | YoY | Since 2000 |
| -1.1% | -0.2% | -2.2% | 231% |
YoY decline worsened from -1.4% in February.
The 13 markets are higher than in mid-2022:
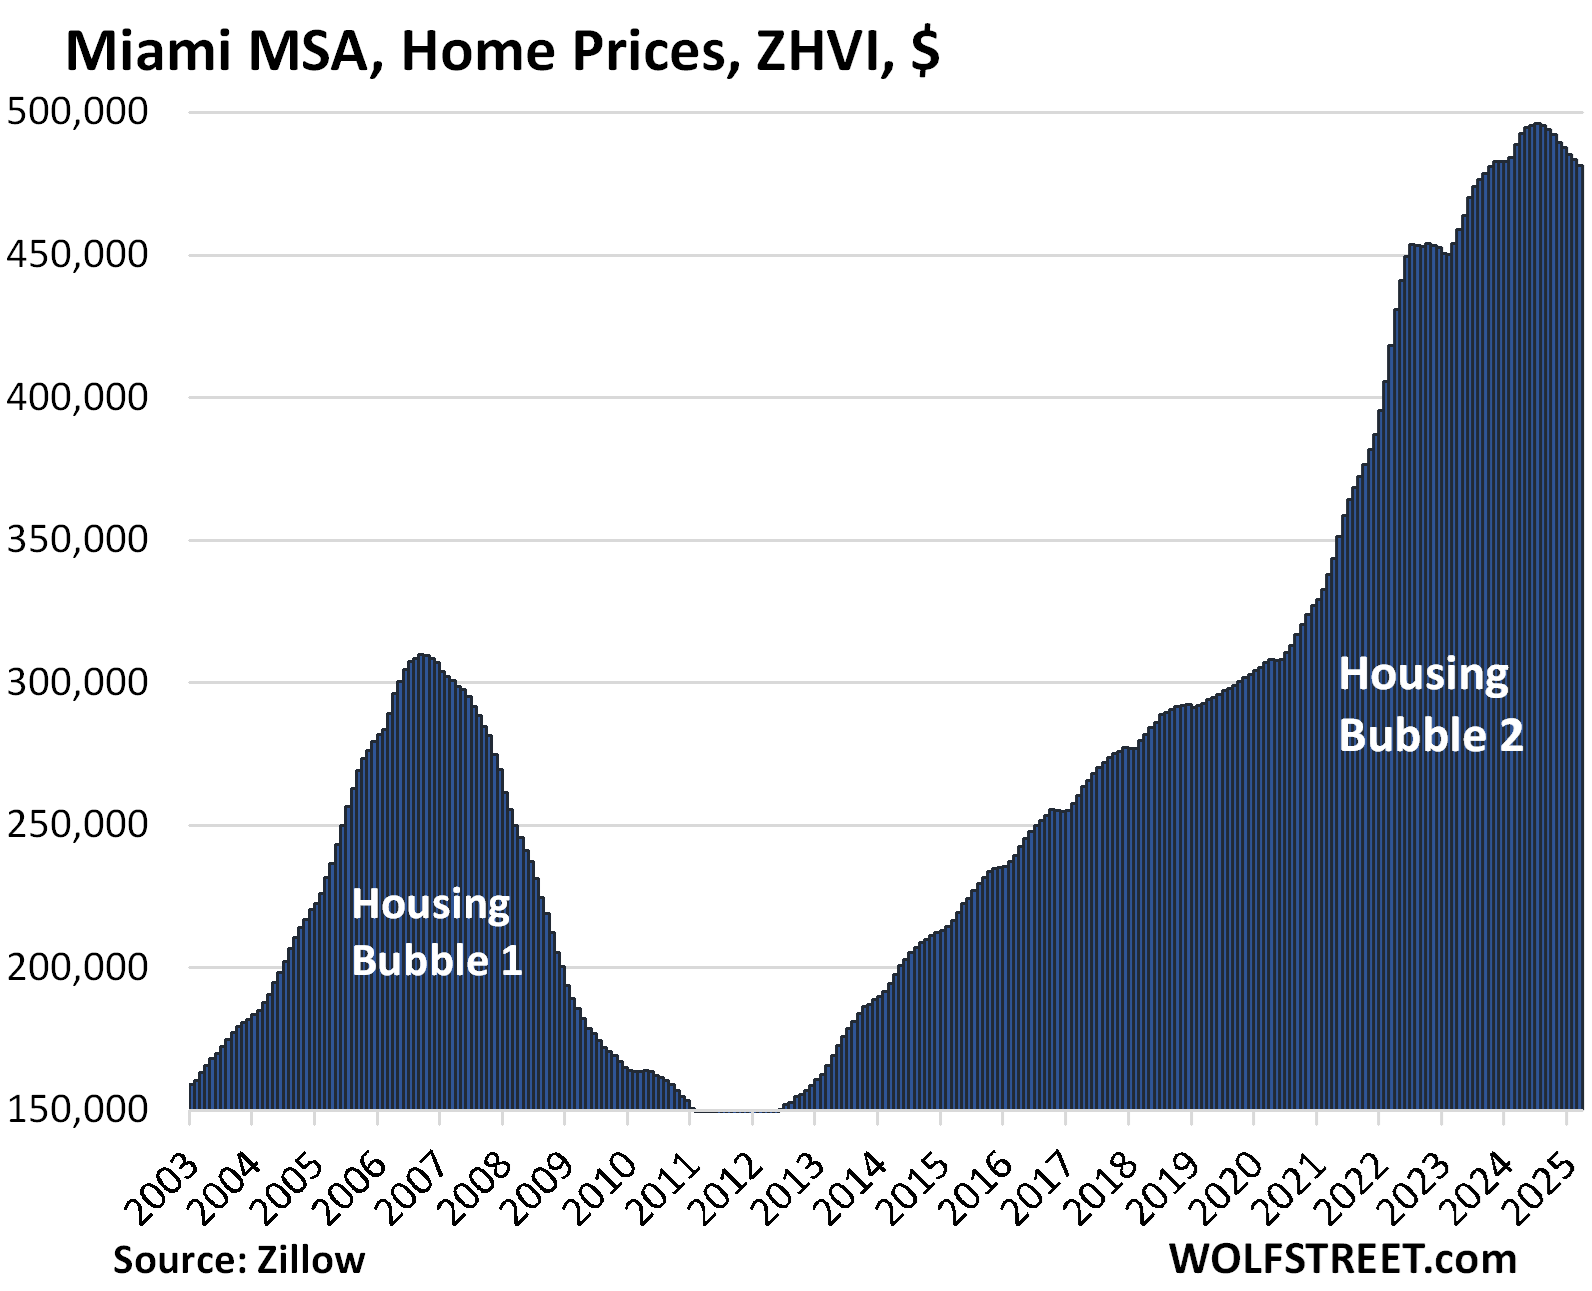
| Miami MSA, Home Prices | ||
| MoM | YoY | Since 2000 |
| -0.4% | -1.5% | 324% |
Miami’s market is turning south:
- The YoY decline worsened from -0.2% in February.
- In March 2024, prices jumped by 1.0% from February. In March 2025, prices fell by 0.4% from February.
- Since the high in July, the index has dropped by 3.0%.
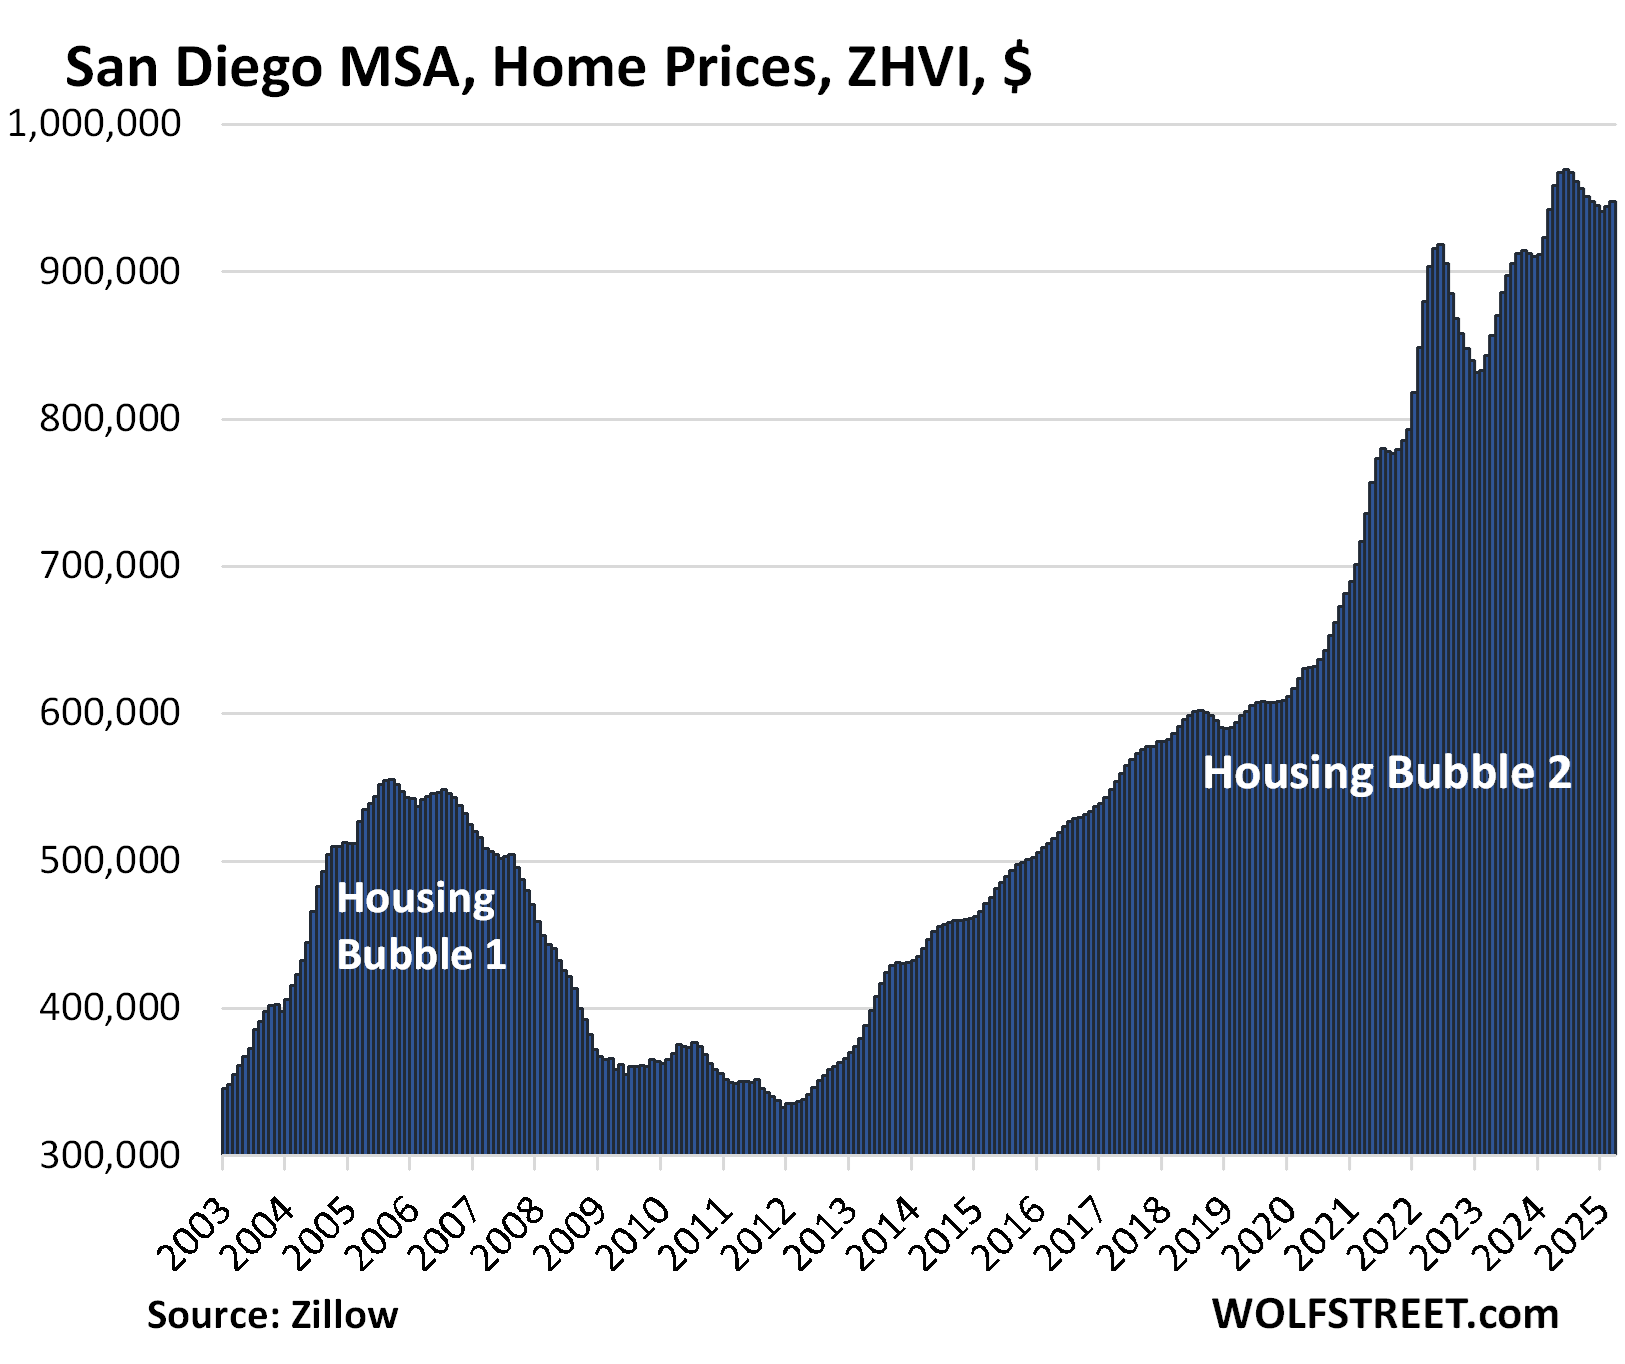
| San Diego MSA, Home Prices | ||
| MoM | YoY | Since 2000 |
| 0.4% | 0.5% | 334% |
In February, the YoY gain was +2.3%.
| Columbus MSA, Home Prices | ||
| MoM | YoY | Since 2000 |
| 0.6% | 2.1% | 153% |
In February, the YoY gain was +3.1%.

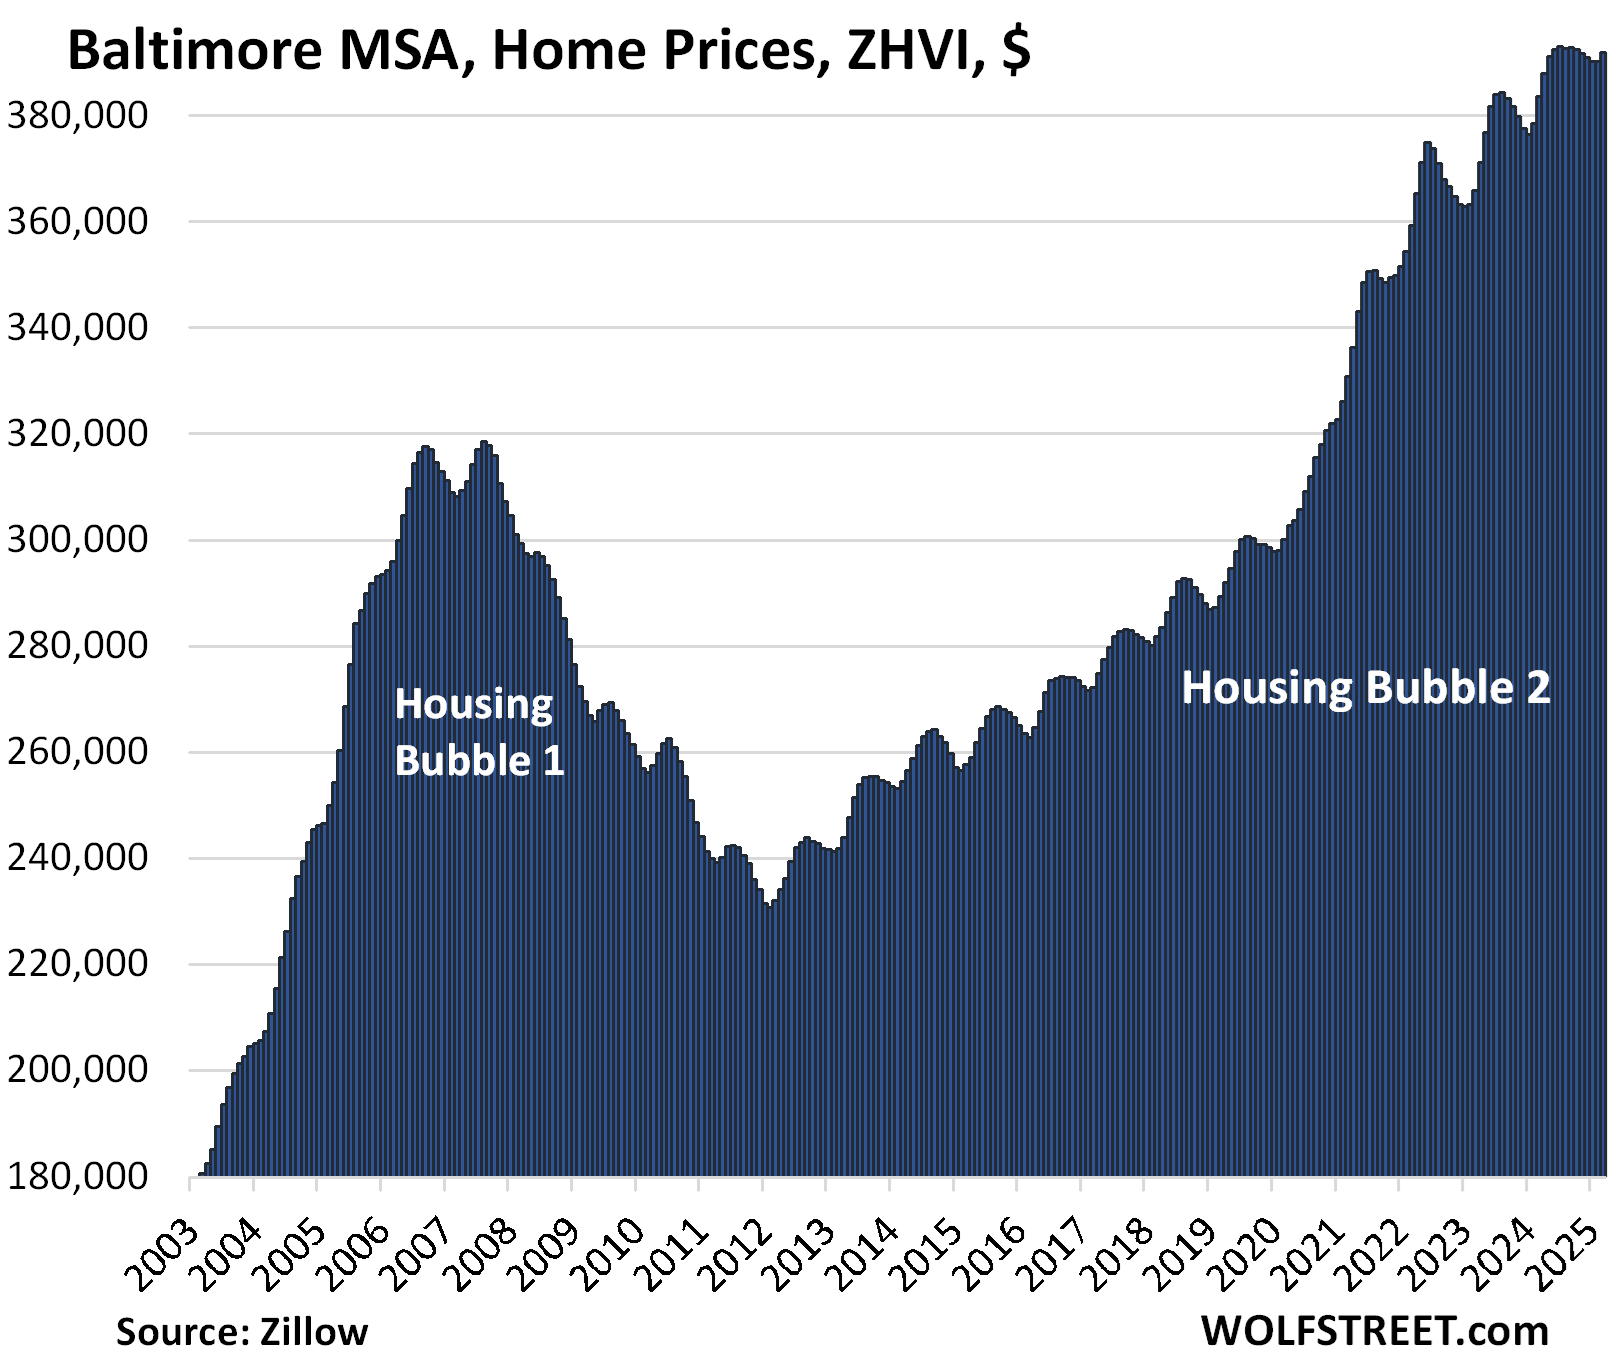
| Baltimore MSA, Home Prices | |||
| MoM | YoY | Since 2000 | |
| 0.4% | 2.2% | 174% | |
In February, the YoY gain was +3.1%.
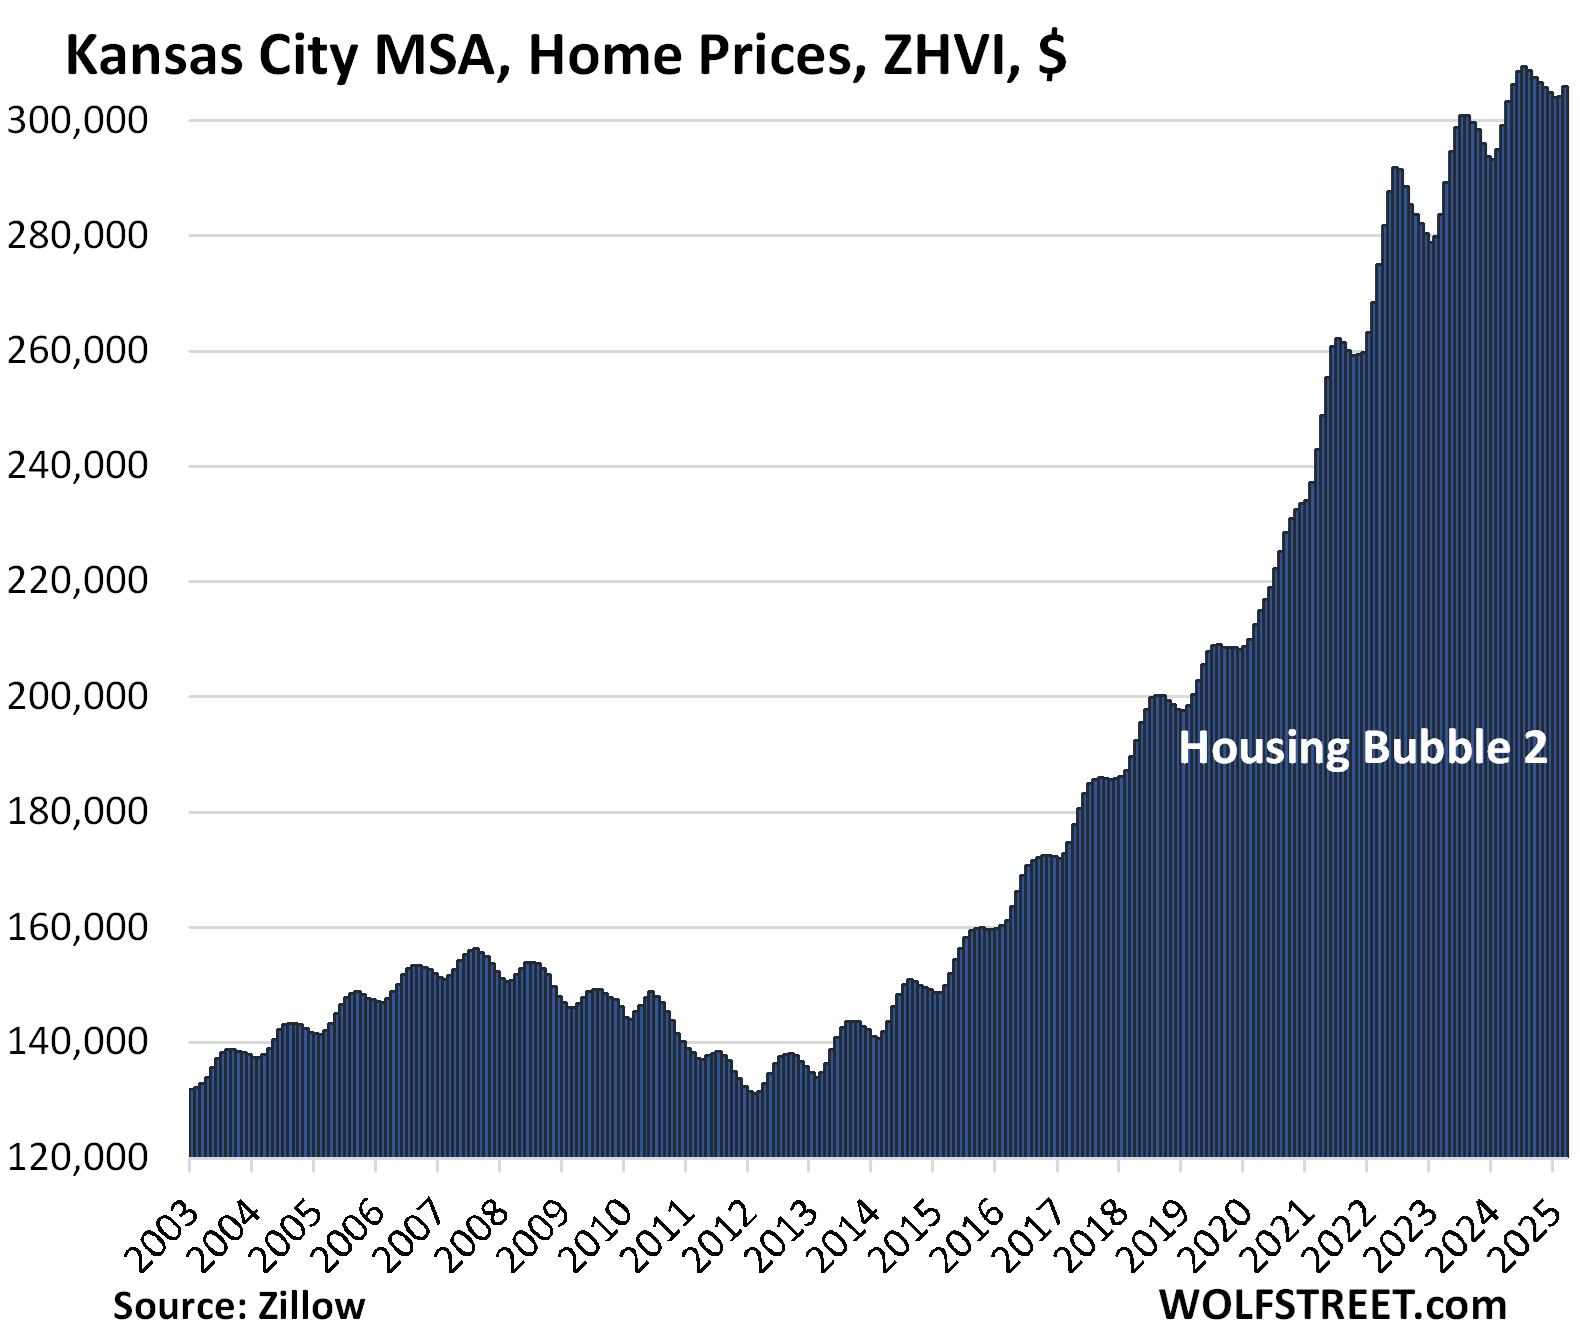
| Kansas City MSA, Home Prices | ||
| MoM | YoY | Since 2000 |
| 0.6% | 2.2% | 176% |
In February, the YoY gain was +3.1%.
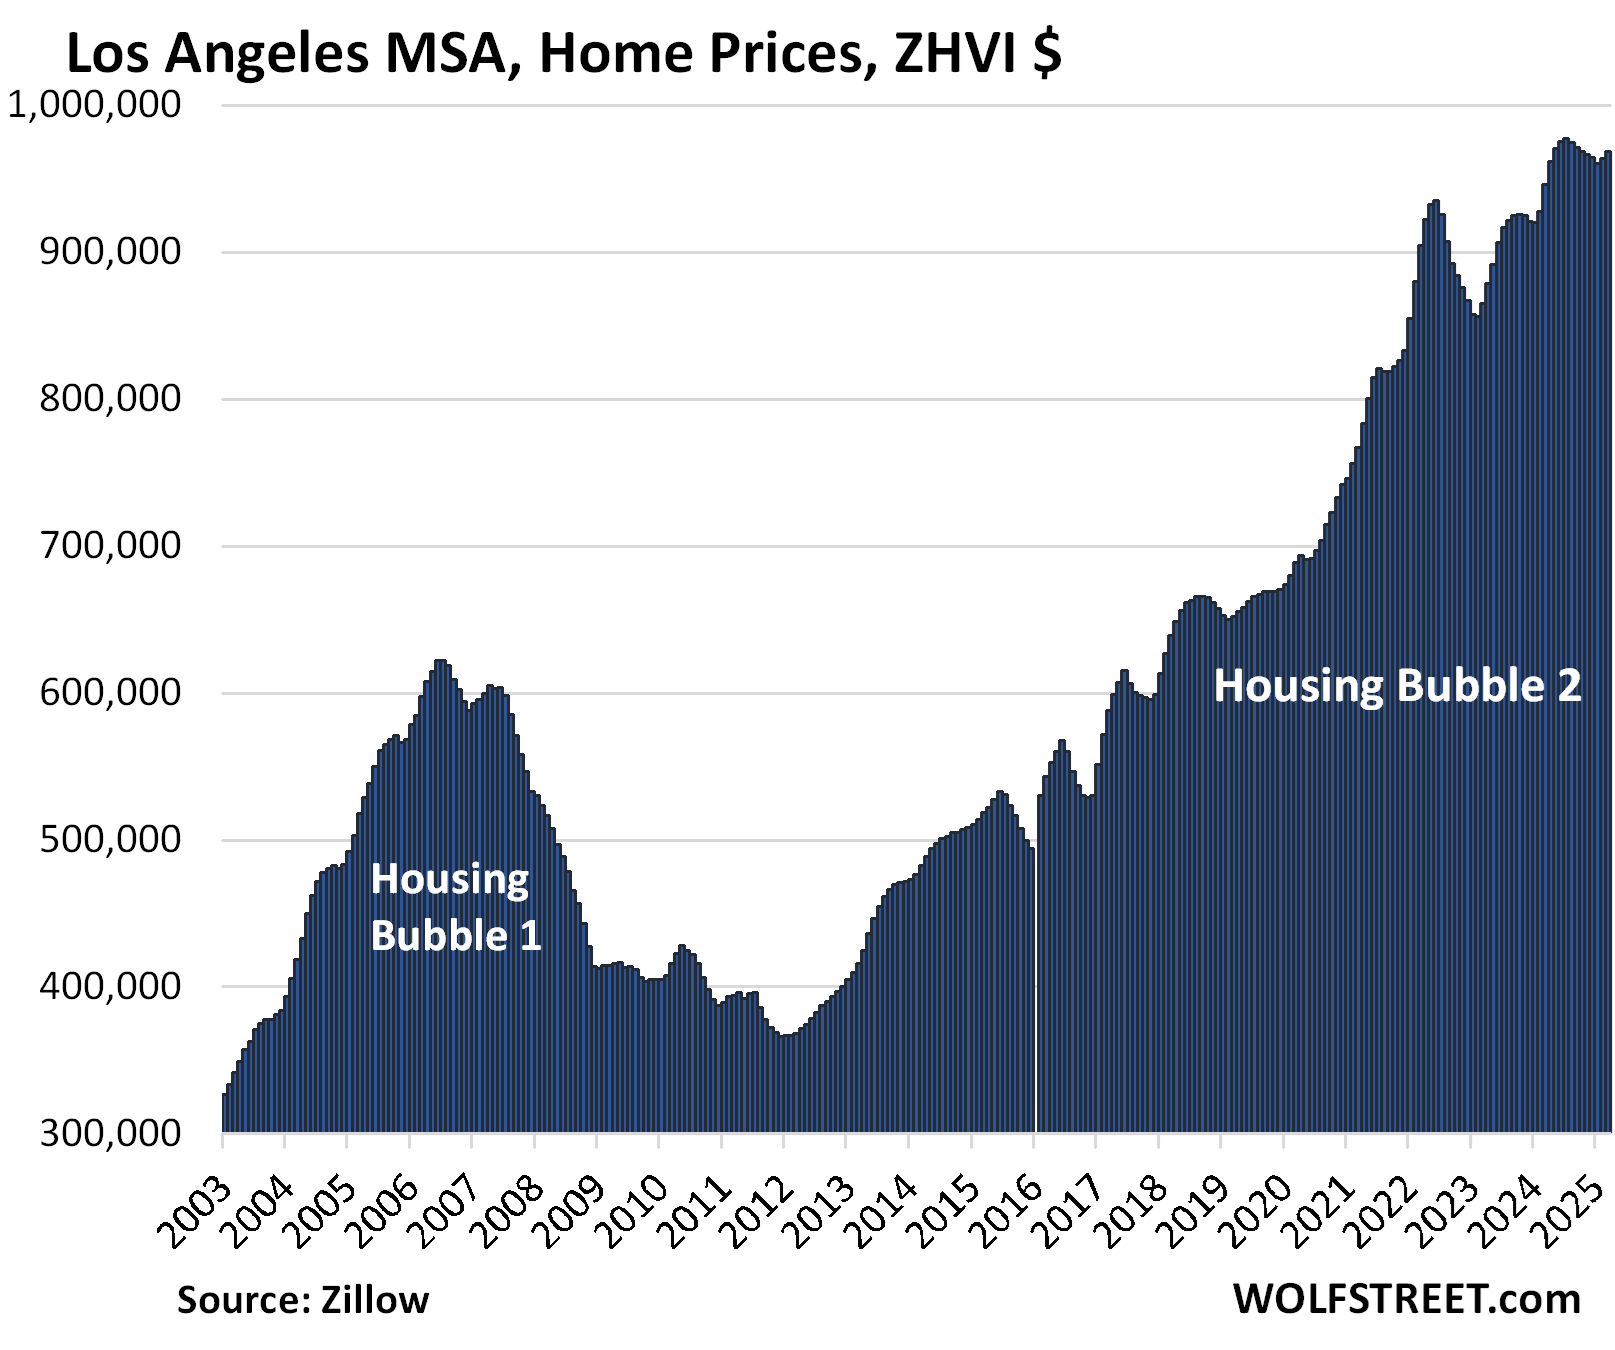
| Los Angeles MSA, Home Prices | ||
| MoM | YoY | Since 2000 |
| 0.5% | 2.4% | 331% |
In February, the YoY gain was +3.9%.
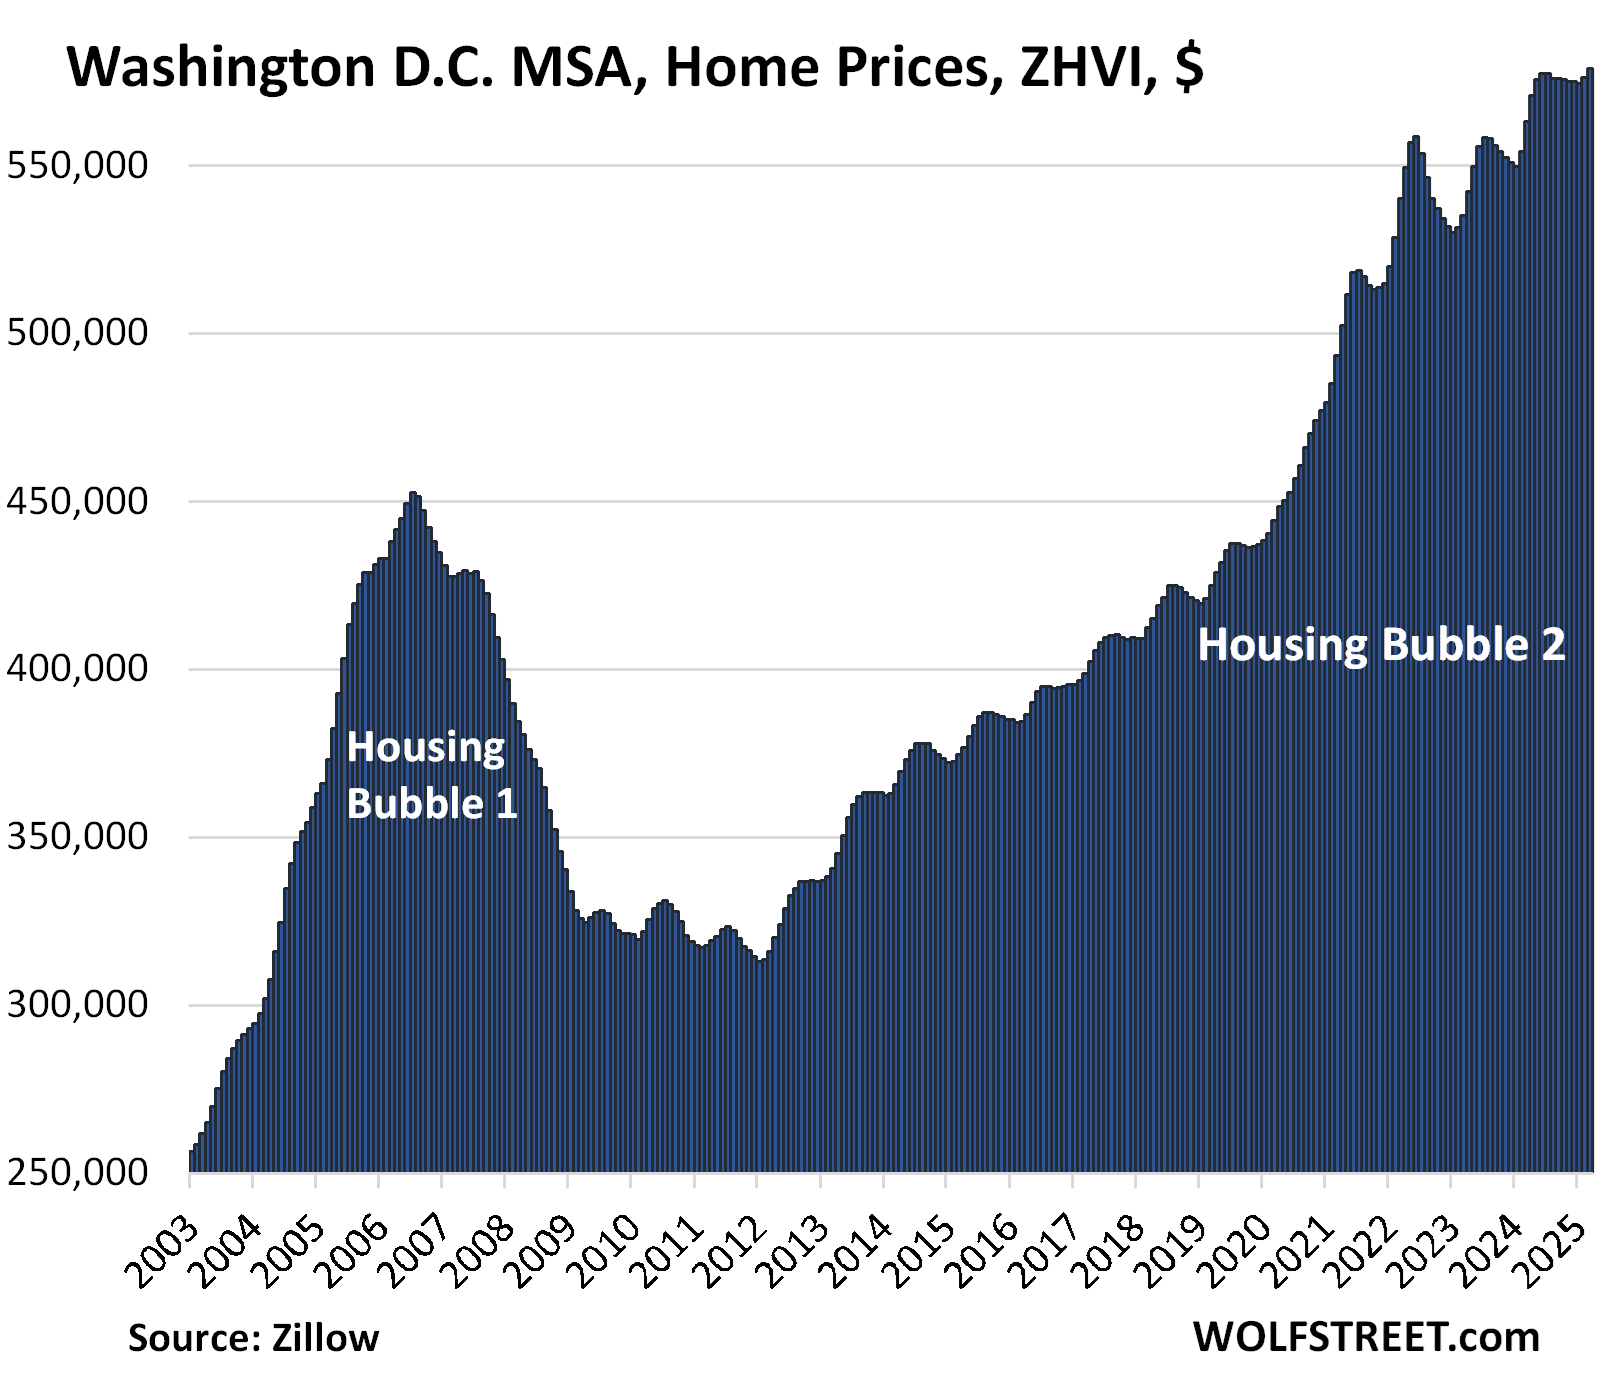
| Washington D.C. MSA, Home Prices | ||
| MoM | YoY | Since 2000 |
| 0.5% | 2.8% | 217% |
In February, the YoY gain was +4.0%. The index is roughly unchanged from June 2024.
The vast and diverse metro includes Washington D.C. and parts of Maryland, Virginia, and West Virginia.
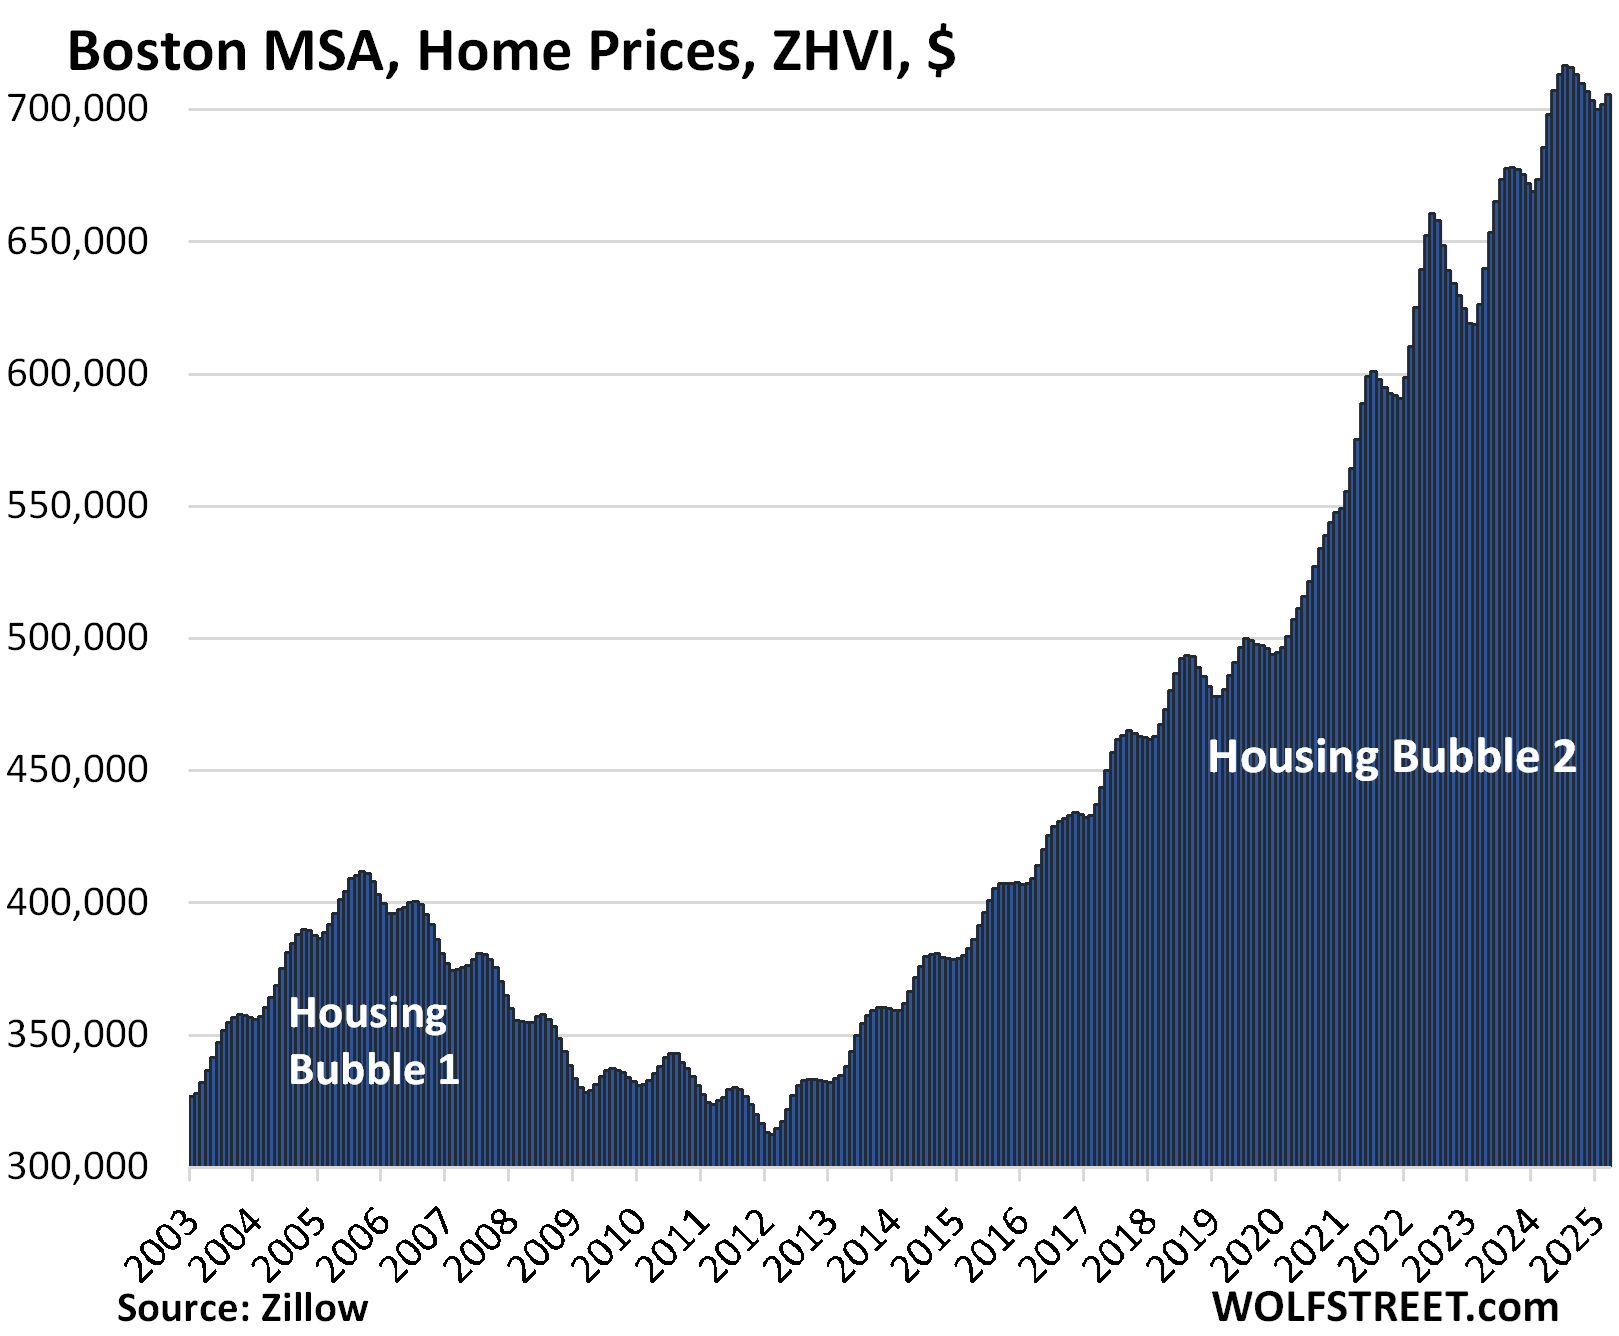
| Boston MSA, Home Prices | ||
| MoM | YoY | Since 2000 |
| 0.6% | 2.9% | 225% |
In February, the YoY gain was +4.2%.
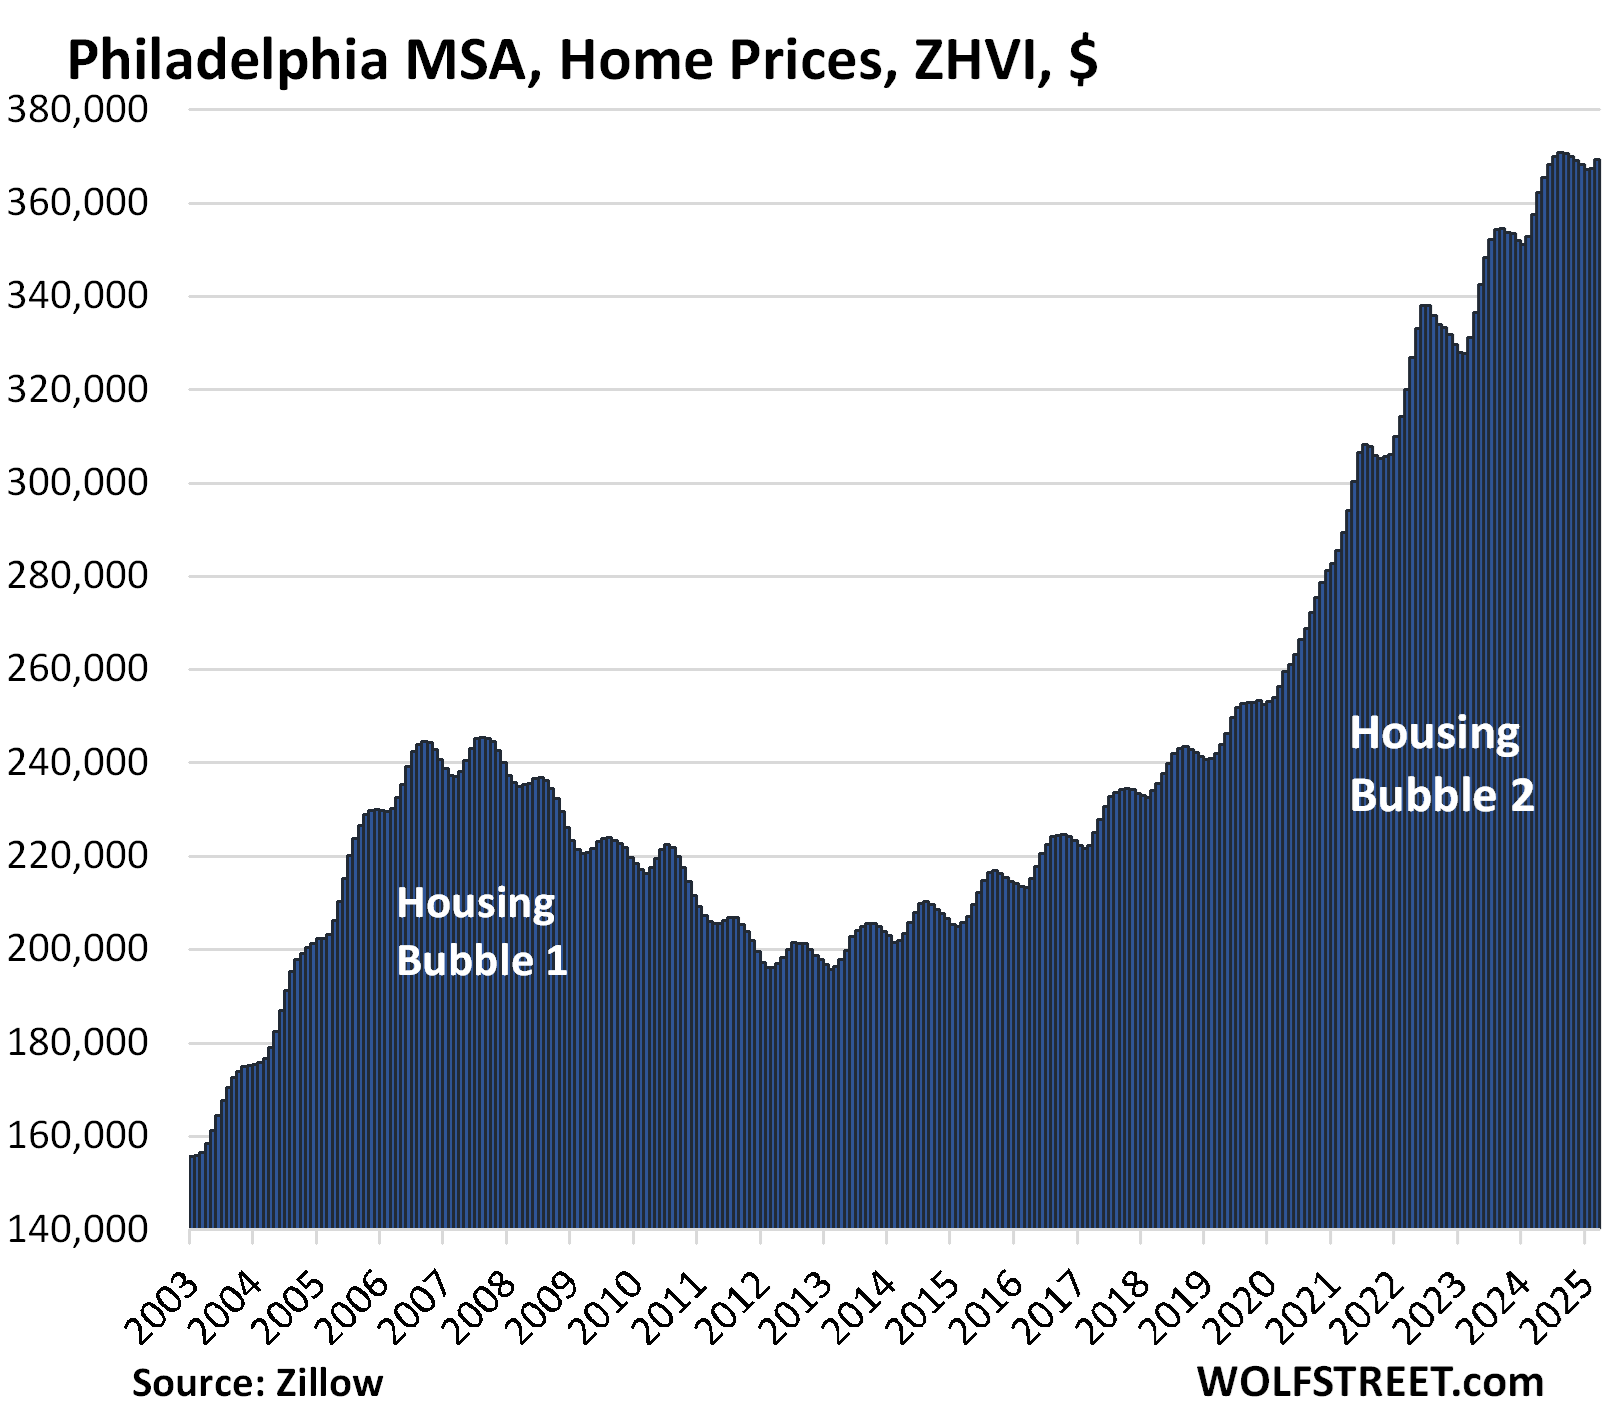
| Philadelphia MSA, Home Prices | ||
| MoM | YoY | Since 2000 |
| 0.5% | 3.3% | 201% |
In February, the YoY gain was +4.1%.
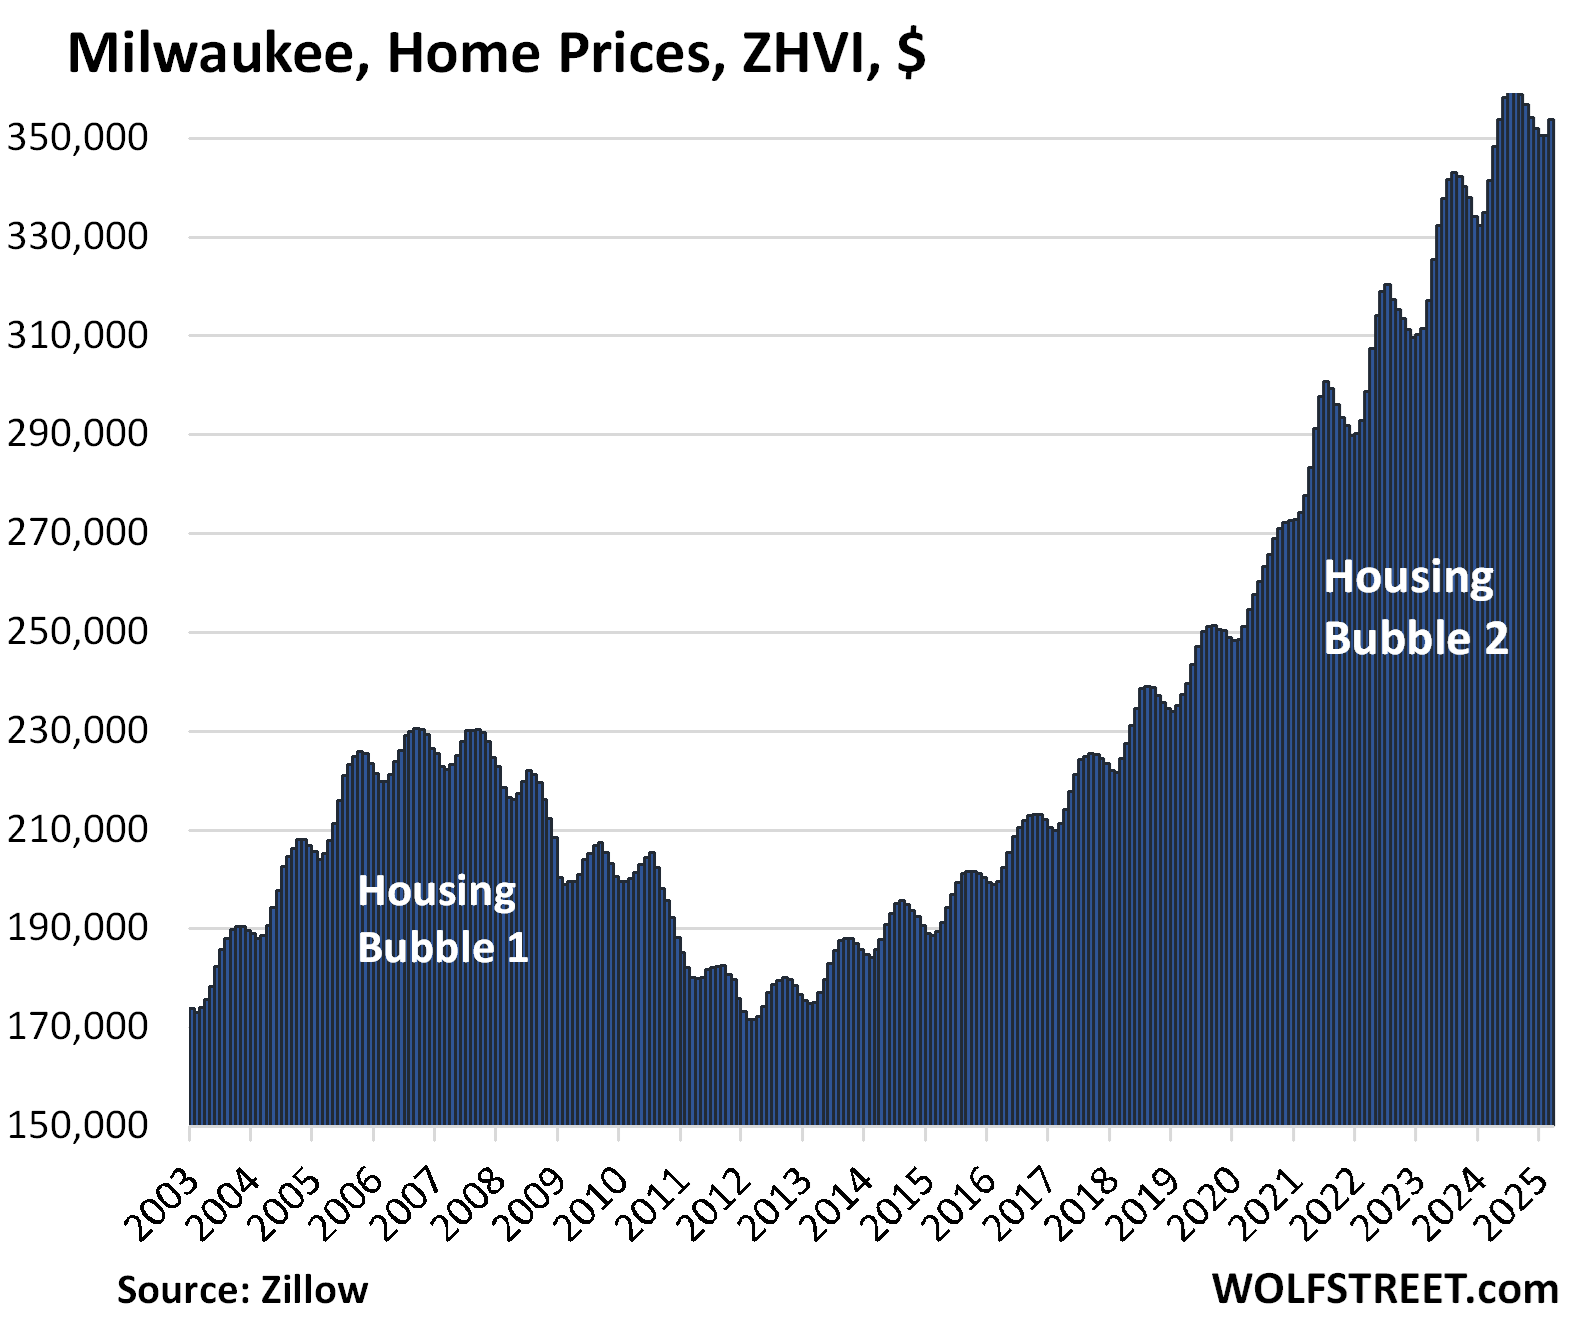
| Milwaukee MSA, Home Prices | ||
| MoM | YoY | Since 2000 |
| 0.9% | 3.6% | 143.5% |
Though the month-to-month price gain in March looks big, it was a lot smaller than in March 2024, causing the YoY gain to narrow from +4.7% in February.
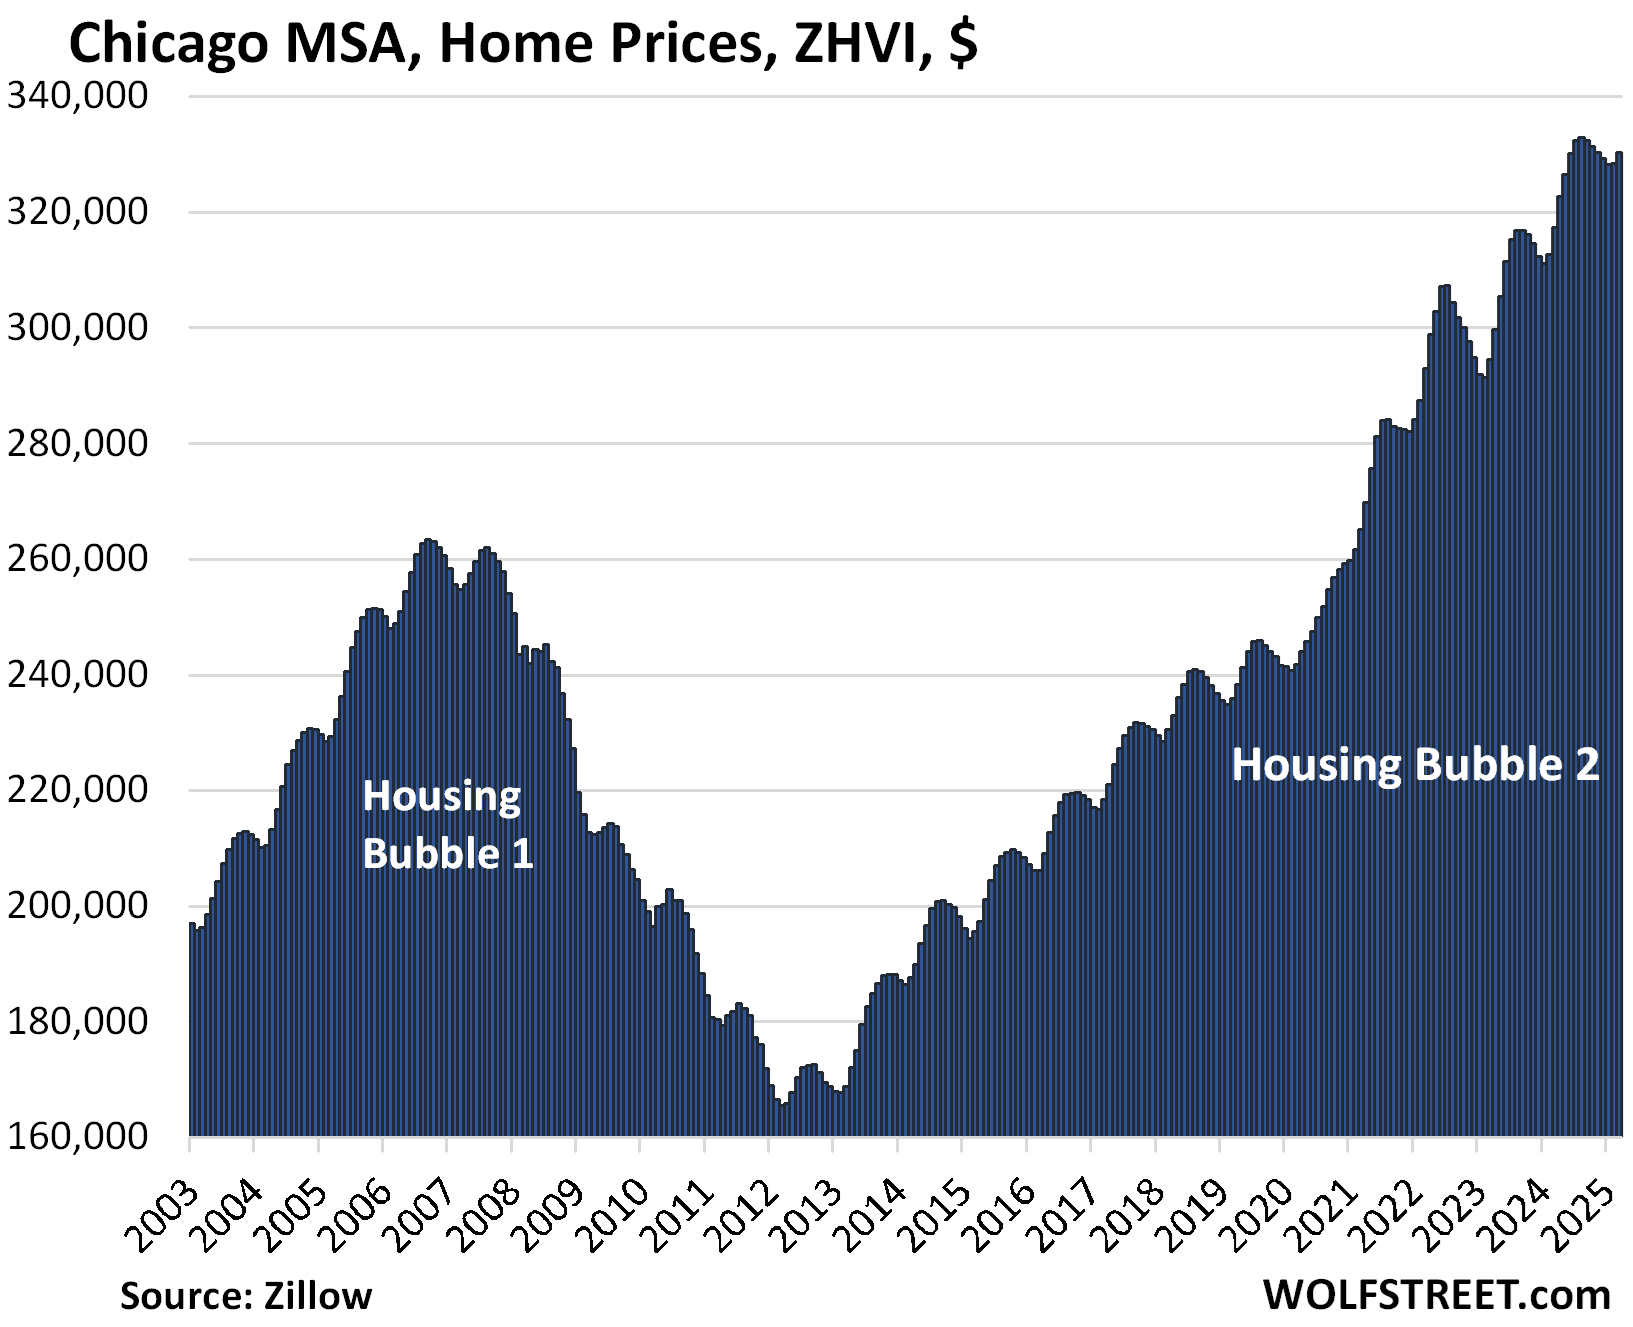
| Chicago MSA, Home Prices | ||
| MoM | YoY | Since 2000 |
| 0.6% | 4.1% | 112% |
In February, the YoY gain was +5.1%.
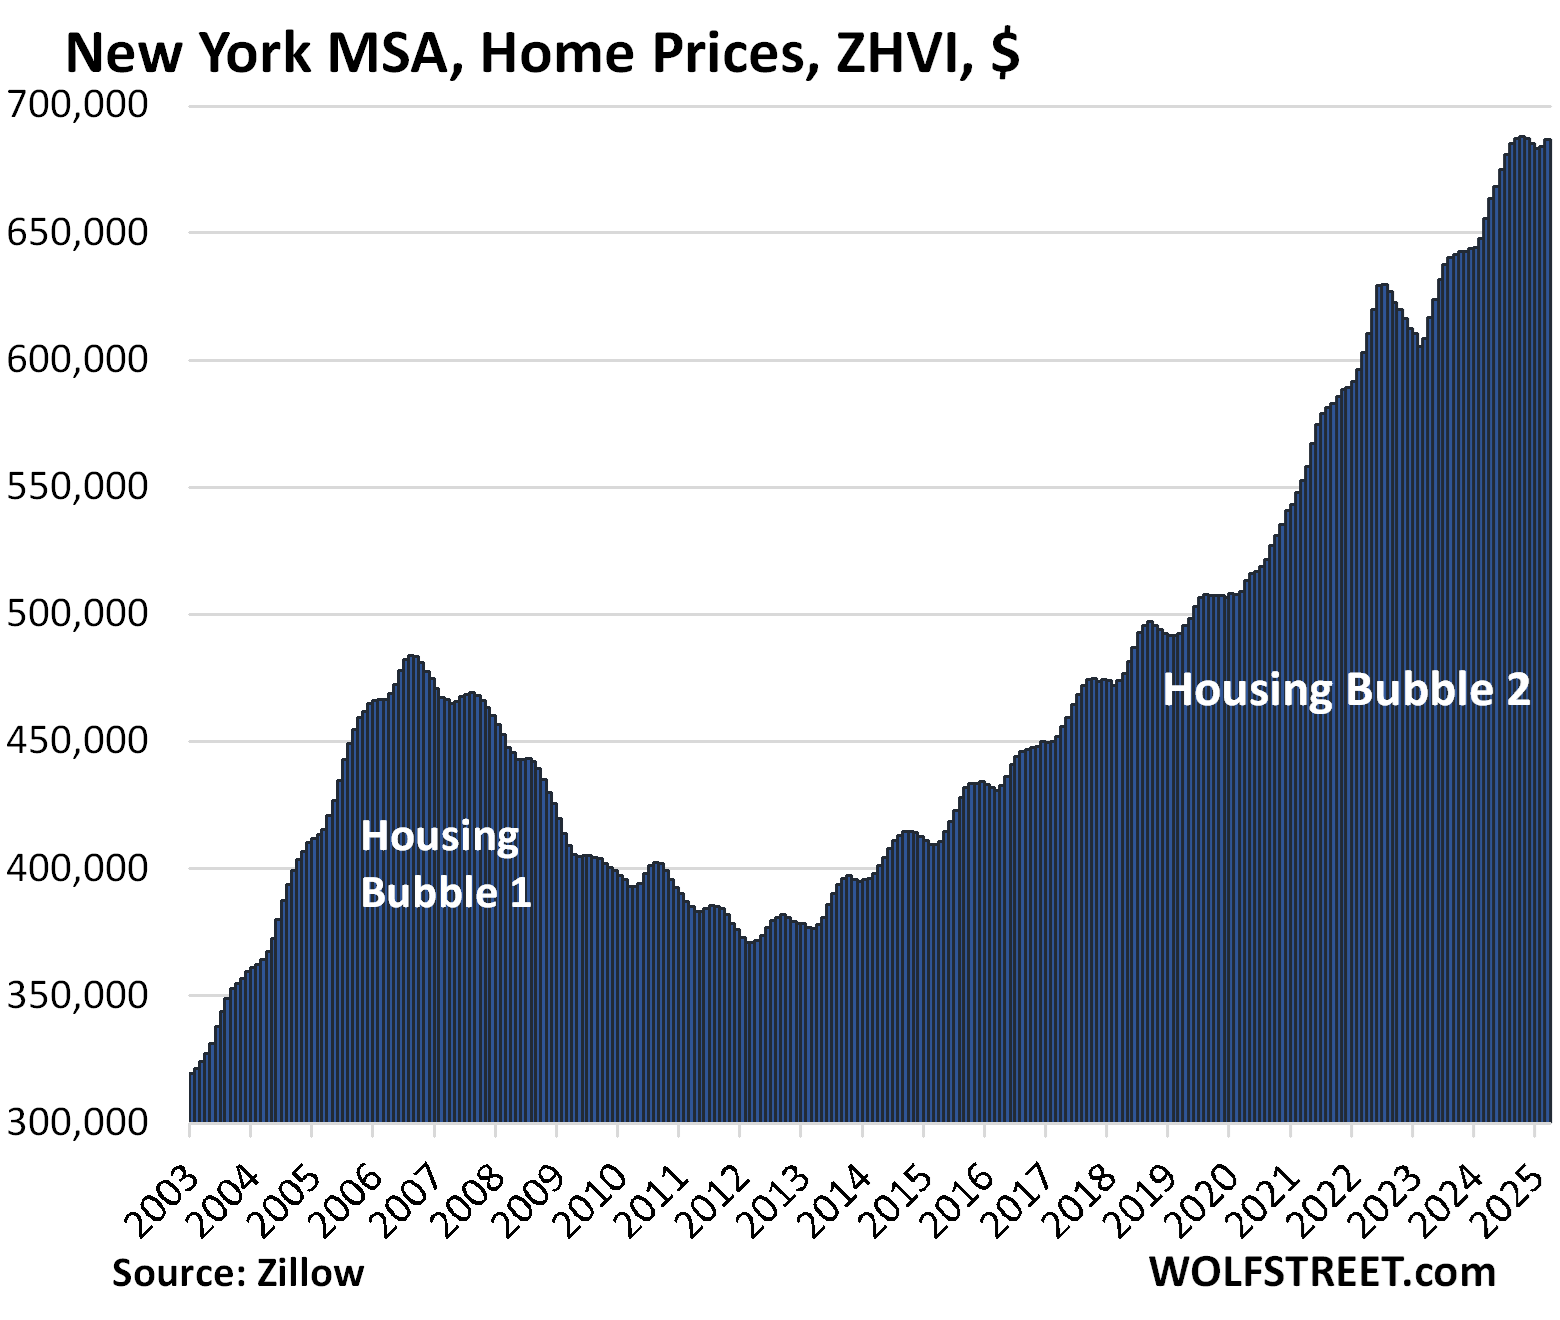
| New York MSA, Home Prices | ||
| MoM | YoY | Since 2000 |
| 0.4% | 4.8% | 212% |
In February, the YoY gain was +5.6%.
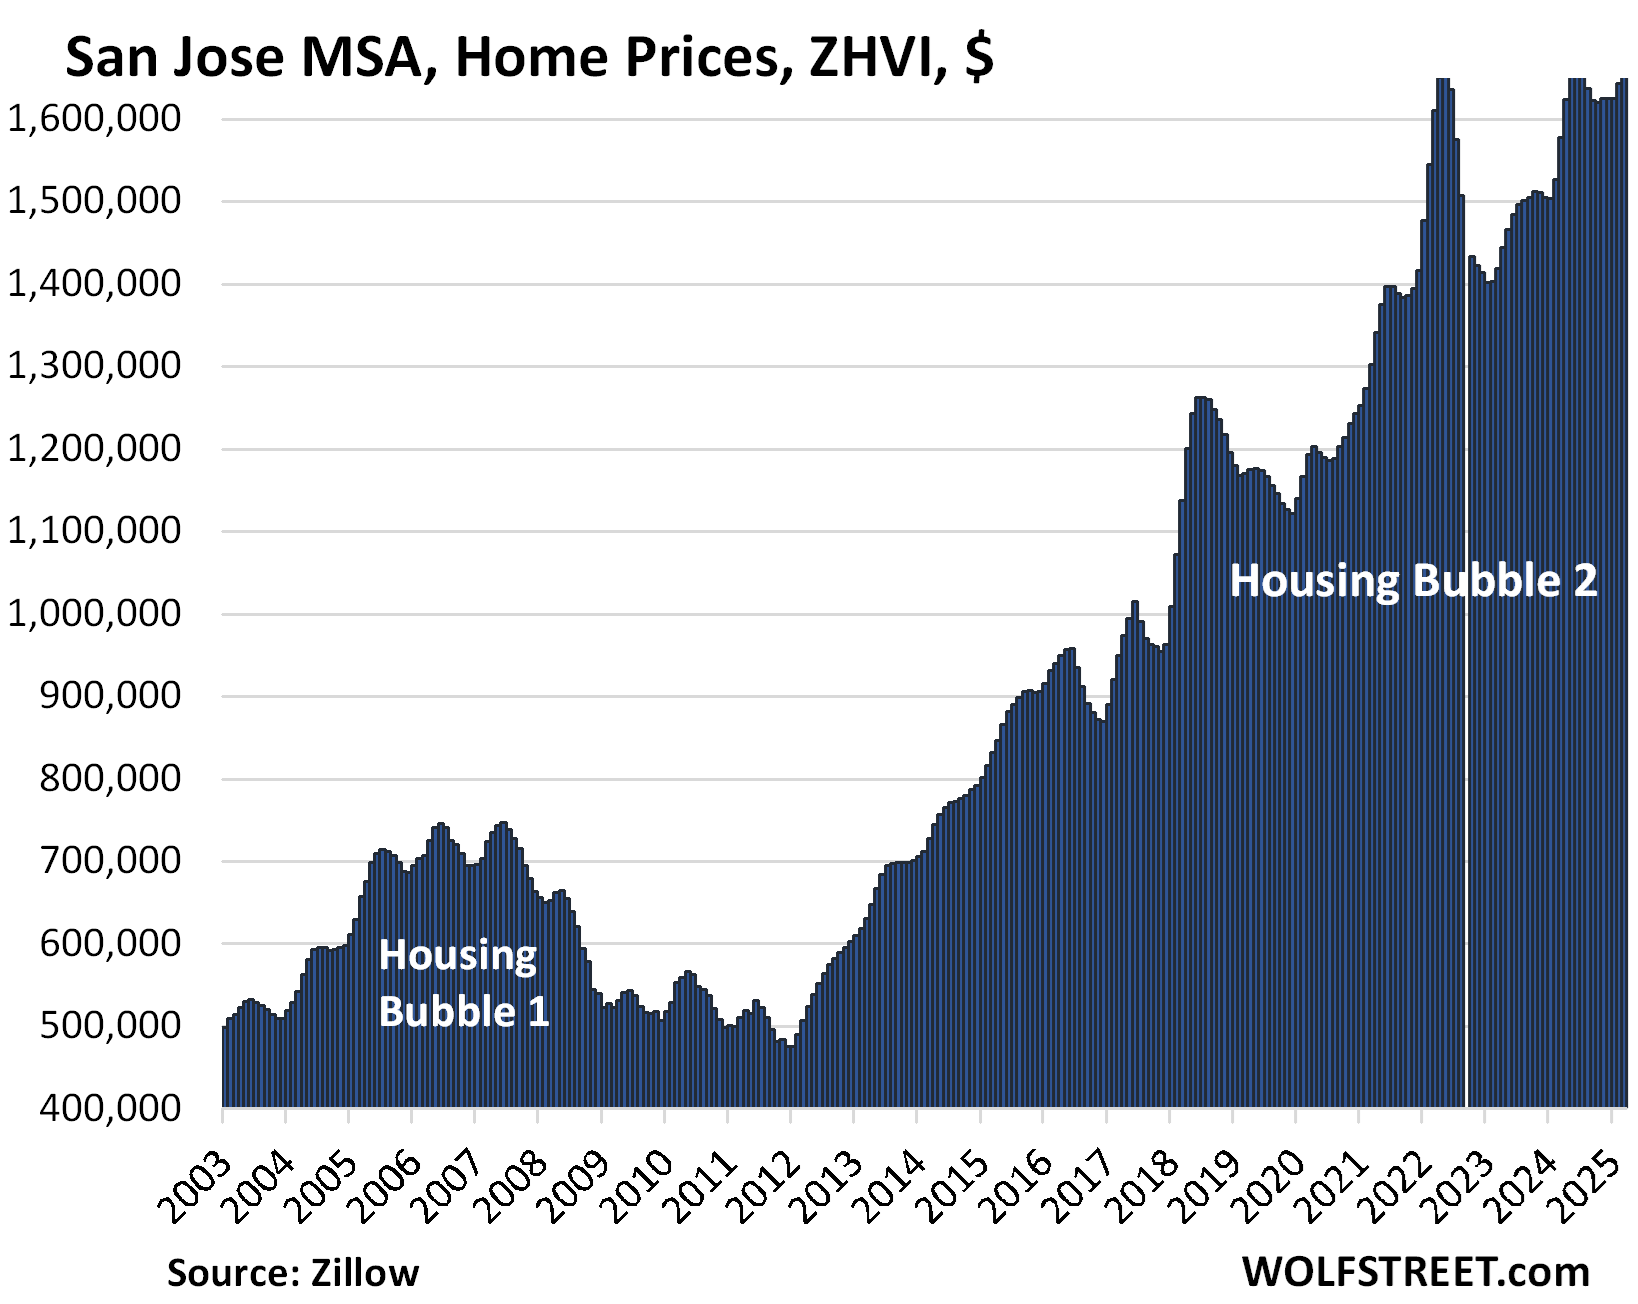
| San Jose MSA, Home Prices | |||
| MoM | YoY | Since 2000 | |
| 1.3% | 5.5% | 348% | |
In February, the YoY gain was +7.6%. The index is roughly level where it had first been in May 2022. Some crazy action:
Enjoy reading WOLF STREET and want to support it? You can donate. I appreciate it immensely. Click on the mug to find out how:

![]()
The post The Most Splendid Housing Bubbles in America, March 2025: The Price Drops & Gains in 33 of the Largest Housing Markets appeared first on Energy News Beat.
“}]]
