
 [[{“value”:”
Student loans are loans again, OOPS.
By Wolf Richter for WOLF STREET.
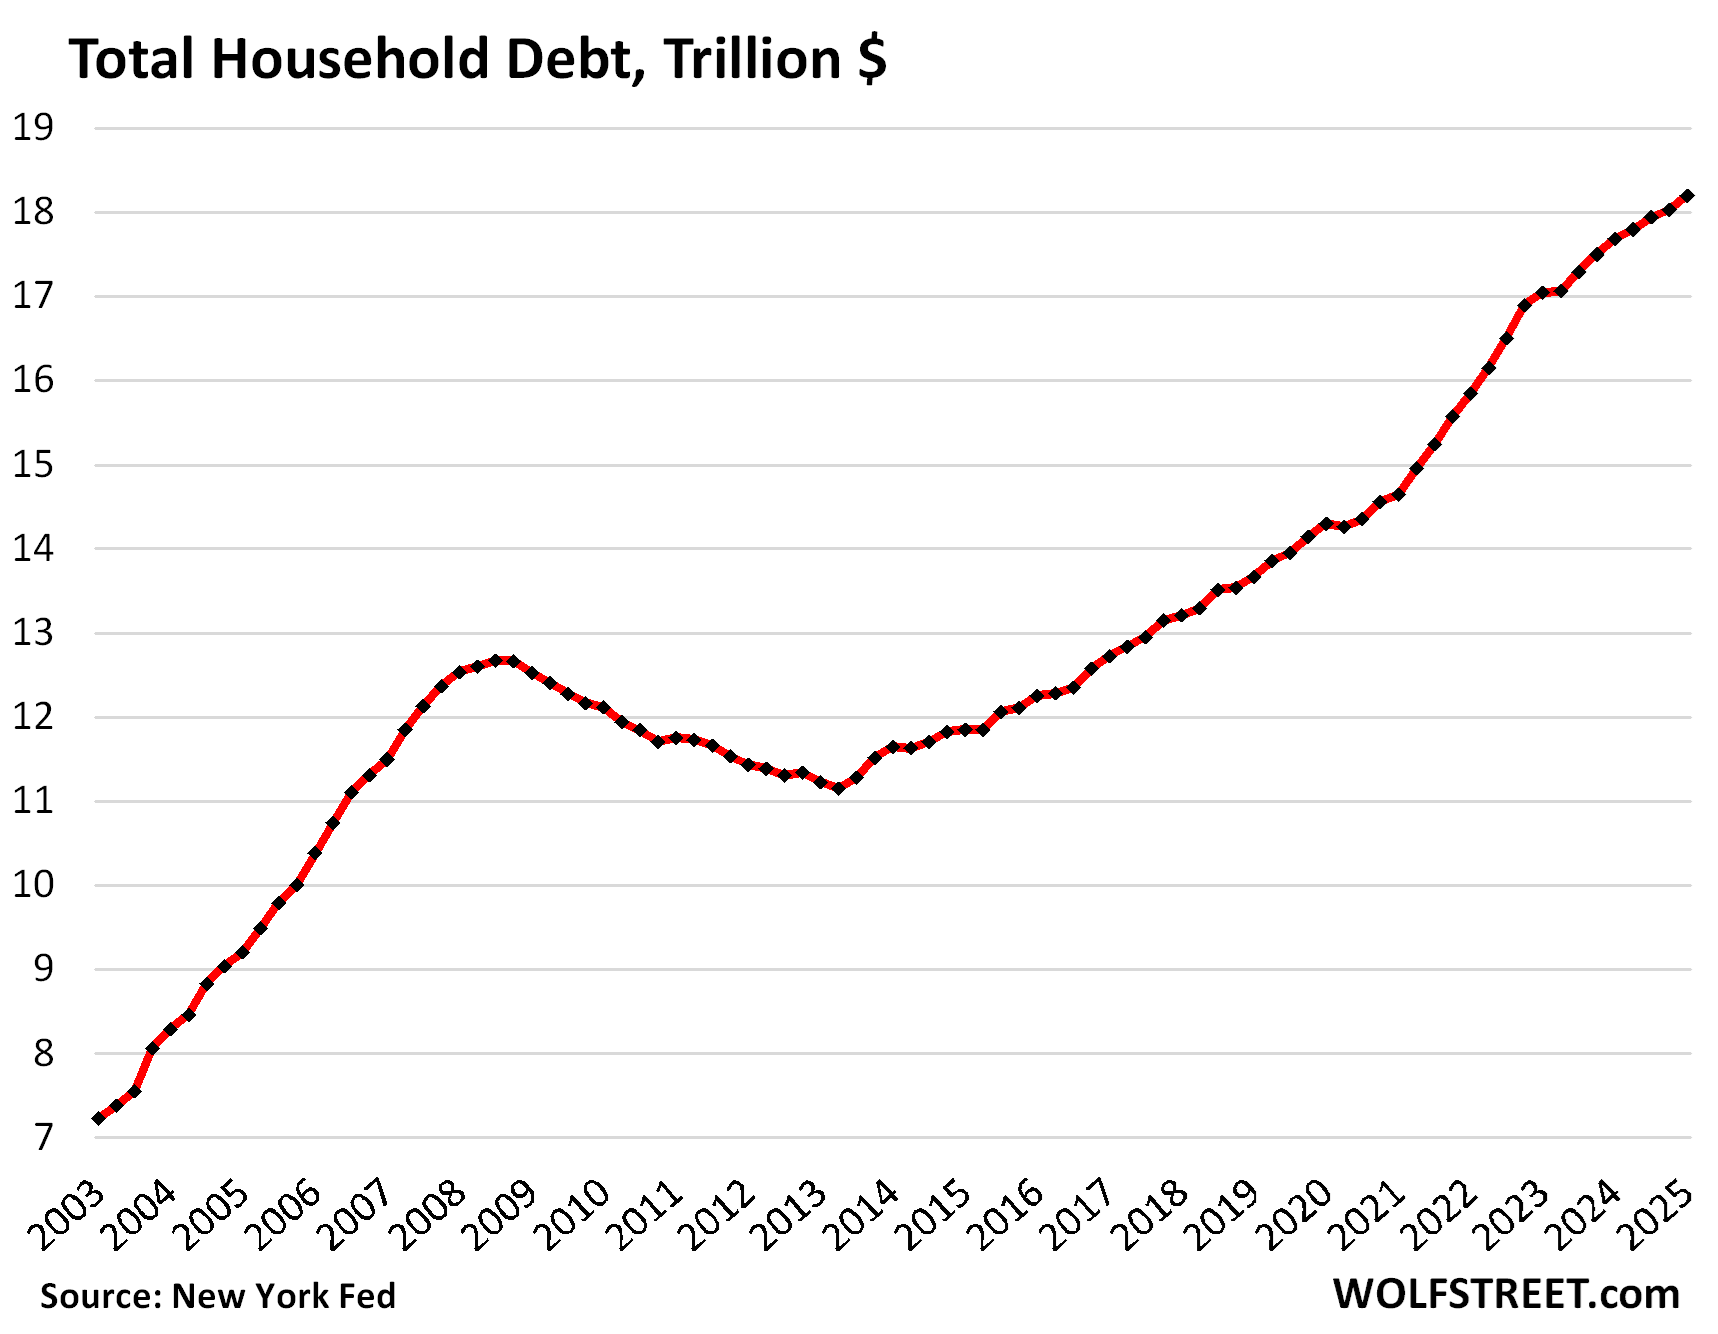
Total household debt outstanding rose by $167 billion in Q1, or by 0.9%, from Q4, to $18.2 trillion, according to the Household Debt and Credit Report from the New York Fed today. Year-over-year, total household debt grew by $516 billion, or by 2.9%, the smallest growth rate since Q1 2021.
And spread over 2.08 million more workers (+1.3%) year-over-year, amid higher wages that helped boost disposable income by 4.0% year-over-year, the overall burden of their debts in terms of their income (the debt-to-income ratio) declined even further; more in a moment.
Balances declined quarter over quarter in the categories of auto loans, credit cards, and “other” revolving credit (personal loans, BNPL loans, etc.). Balances increased in the other three: mortgages, HELOCs, and student loans. We’ll get into housing debt, auto loans, and credit cards each in a separate article over the next few days. Today, we’ll look at the overall debt, its burden, delinquencies, collections, foreclosures, and bankruptcies.
The burden of household debt: Debt-to-income ratio.
A classic way of looking at the burden of household debt is the debt-to-disposable-income ratio, which accounts for more workers and higher incomes.
Disposable income, released by the Bureau of Economic Analysis, is household income from all sources except capital gains, minus payroll taxes: So income from after-tax wages, plus income from interest, dividends, rentals, farm income, small business income, transfer payments from the government, etc. This is essentially the cash that consumers have available to spend on housing, food, toys, debt payments, etc. And what they don’t spend, they save.
Disposable income rose faster than debt in Q1:
- QoQ: disposable income +1.6%, total debts +0.9%.
- YoY: disposable income +4.0%, total debts +2.9%.
So the debt-to-income ratio declined to 81.9% in Q1, the lowest ratio in the data going back to 2003, except for a brief period during the free-money-stimulus era that had inflated disposable income into absurdity.
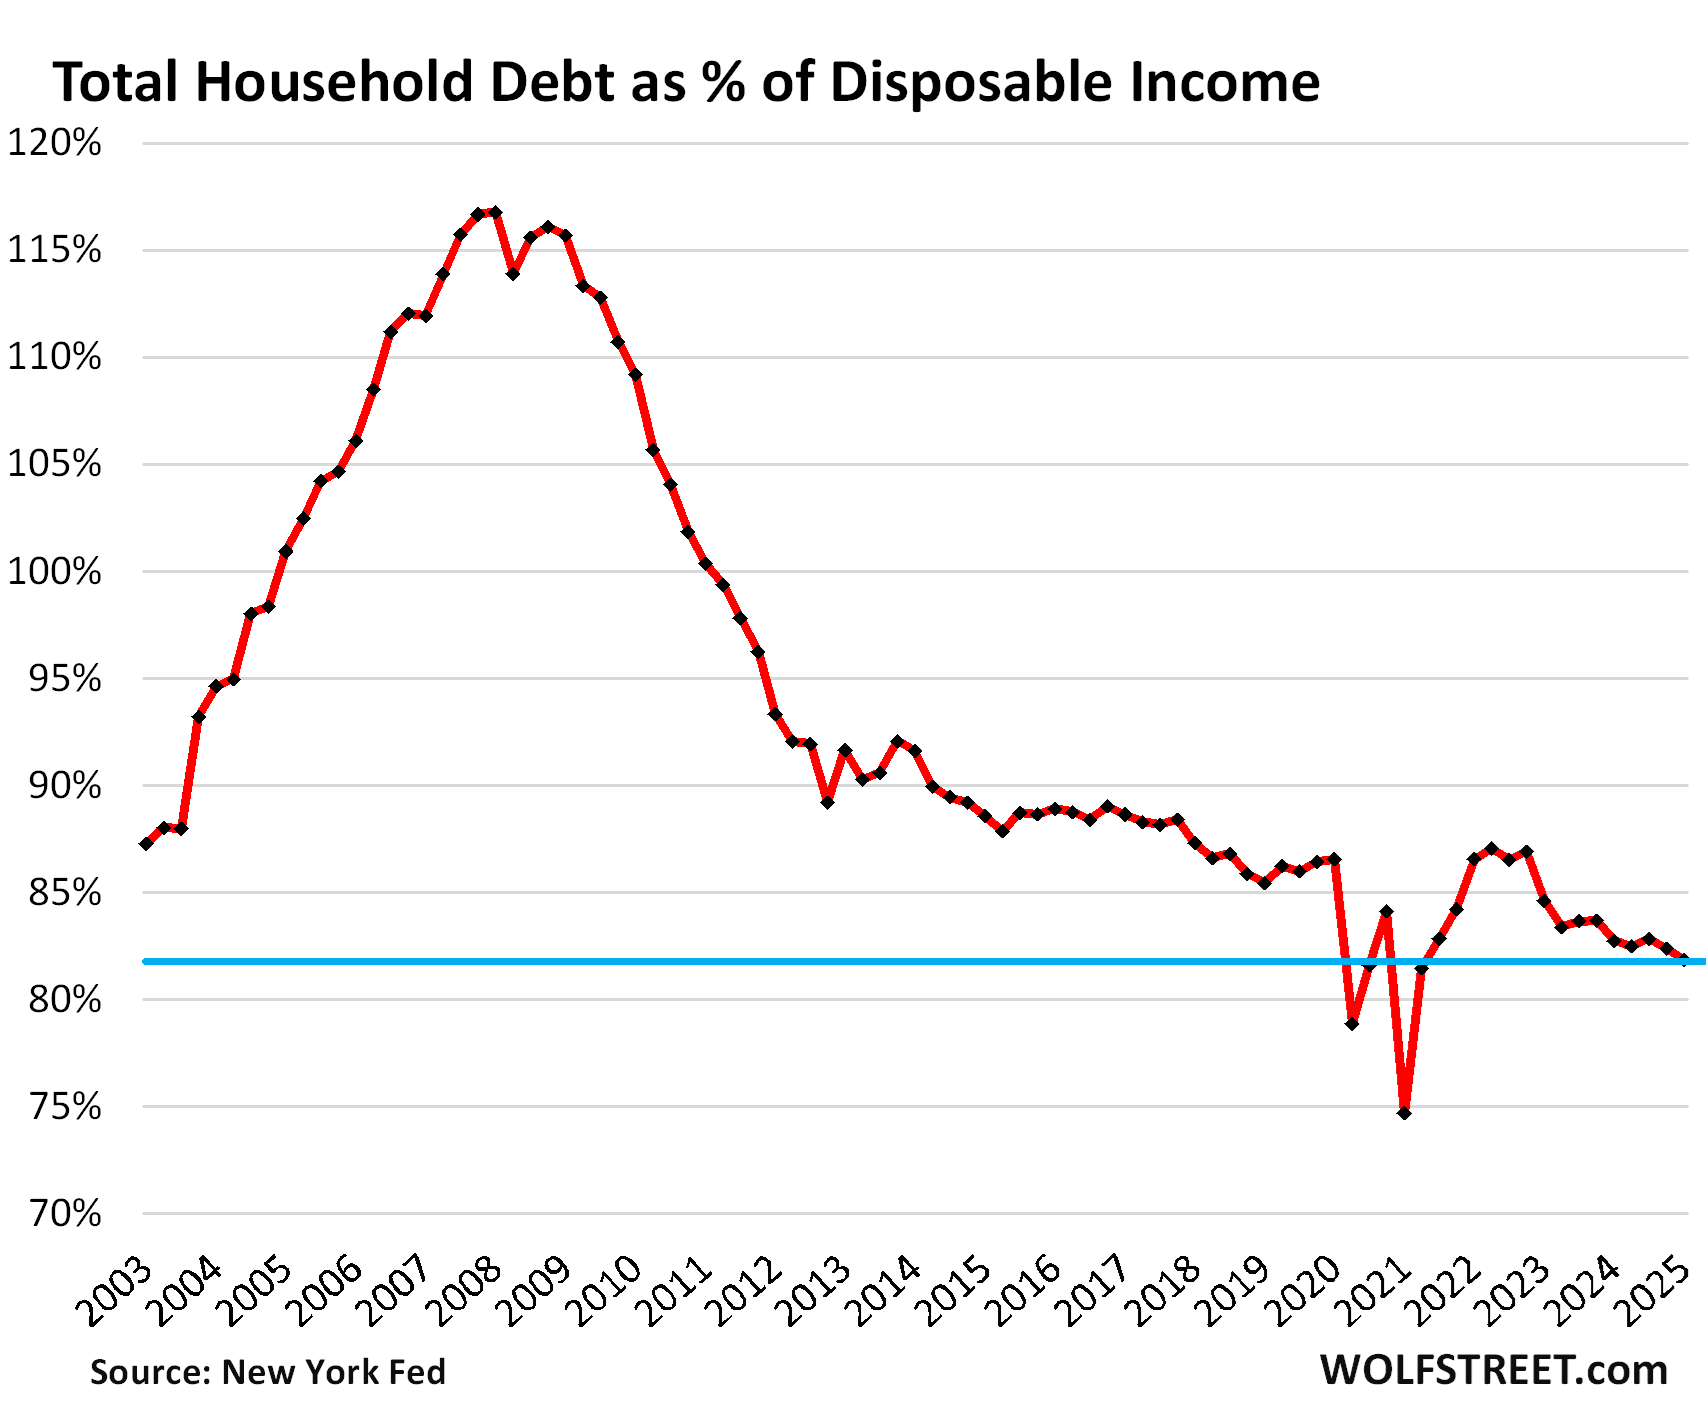
So the aggregate balance sheet of consumers is in good shape. That is not to say that subprime-rated borrowers – a small subset of consumers that’s always in trouble – isn’t in trouble with precariously high debt-to-income ratios and a tangle of bad credit, which is why this segment is called “subprime.”
The heavily leveraged economic entities aren’t consumers. It’s the federal government [we get into the weeds here: US Government Fiscal Mess: Debt, Deficit, Interest Payments, and Tax Receipts]; and many businesses.
This balance-sheet strength of consumers — 65% own their own homes, over 60% hold equities, they sit on $11 trillion in money markets and CDs, and their debt burden is at historic lows — explains in part why growth of consumer spending has held up well, despite higher interest rates.
Our Drunken Sailors, as we lovingly and facetiously call them, learned a lesson and became a sober bunch, most of them, after they blew up their balance sheets in the early 2000s – and in the process, the banks.
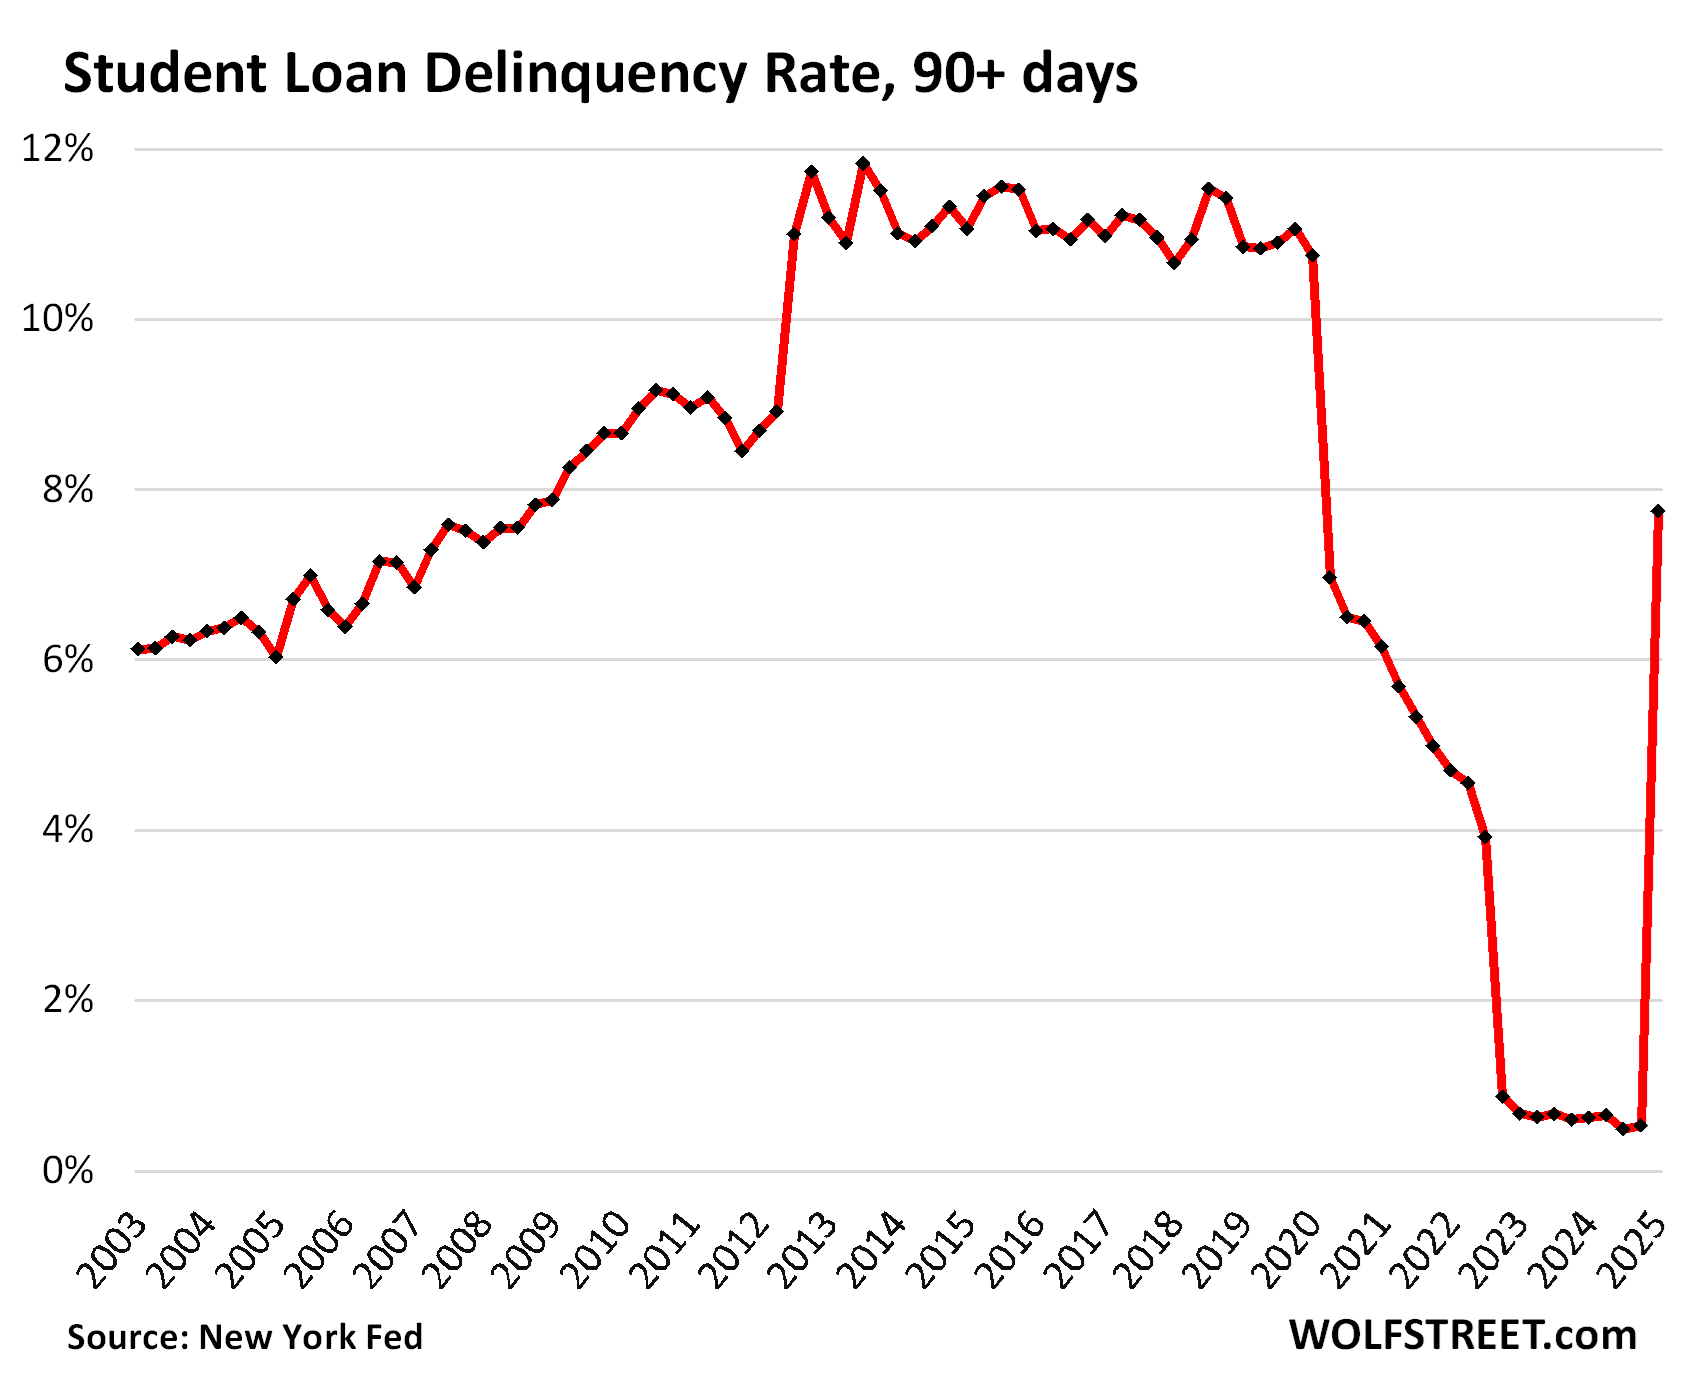
Student loans are loans again. OOPS.
There for a while, student loans weren’t really loans anymore. Borrowers didn’t have to make payments, interest didn’t accrue, nothing was delinquent despite years of not making payments, a bunch of them were forgiven by the Biden administration, and some of those forgiven loans remained forgiven, but other forgiveness strategies lost in court and became unforgiven again, etc. And now this whole mess officially became a mess again when these delinquent balances became officially delinquent again.
So the serious delinquency rate (90 days or more past due), after having been near 0% for over two years, re-spiked to 7.7% in Q1, according to the NY Fed’s report today, based on Equifax data. And it will likely do some more catching up in Q2.
Total student loan balances rose to $1.63 trillion in Q1, and $126 billion of it was 90 days or more delinquent. In fact, much of it was years delinquent suddenly again.
This chart looks obviously funny. Student loans are now largely a creature of government, and government can do funny things, such as trying to forgive student loans (this was taxpayer money they were trying to give away) but not getting away with it:
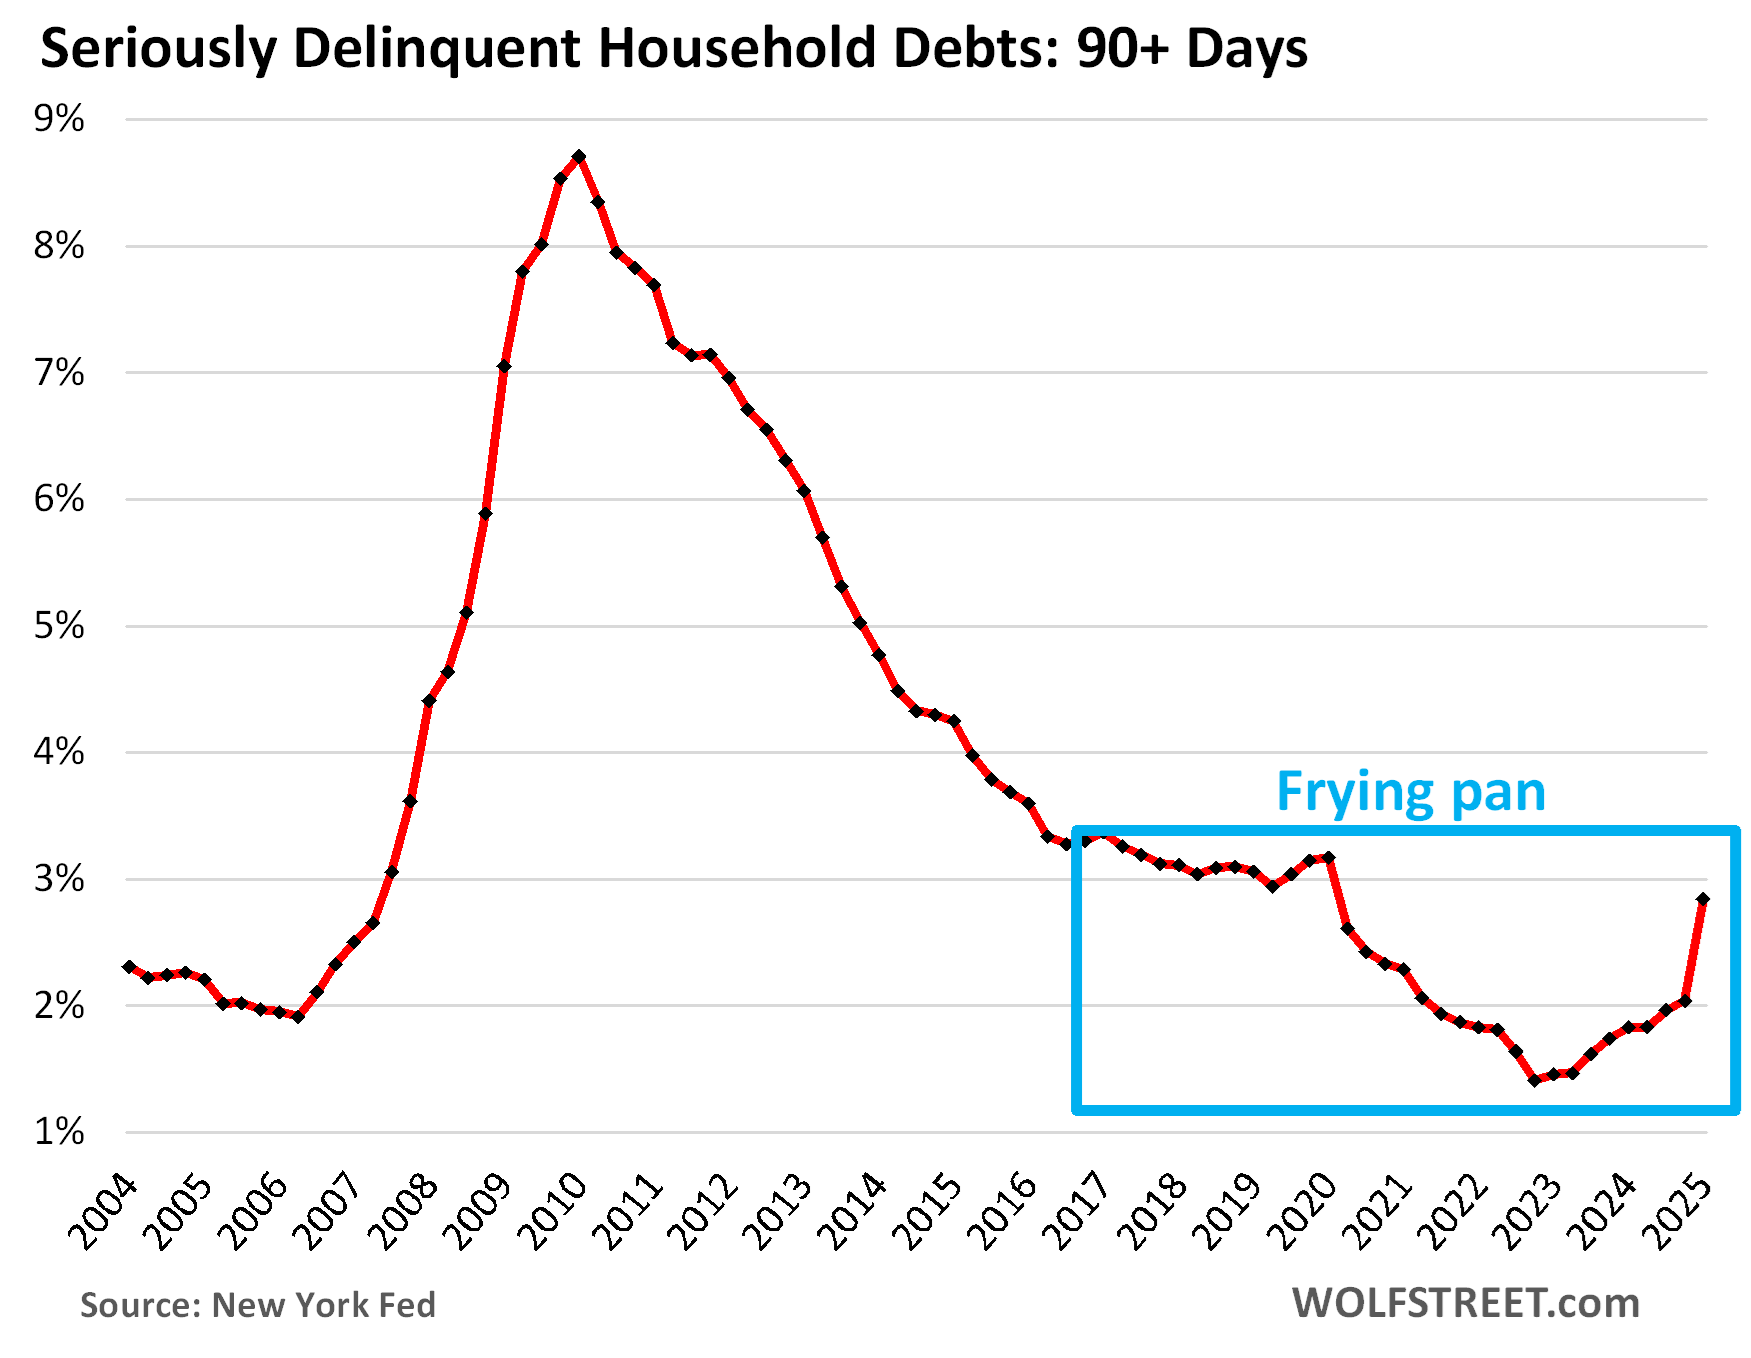
The overall delinquency rate got whacked by the sudden student loan delinquencies and spiked to 2.8% in Q1 from 2.0% in Q4. But even 2.8% was still below prepandemic levels.
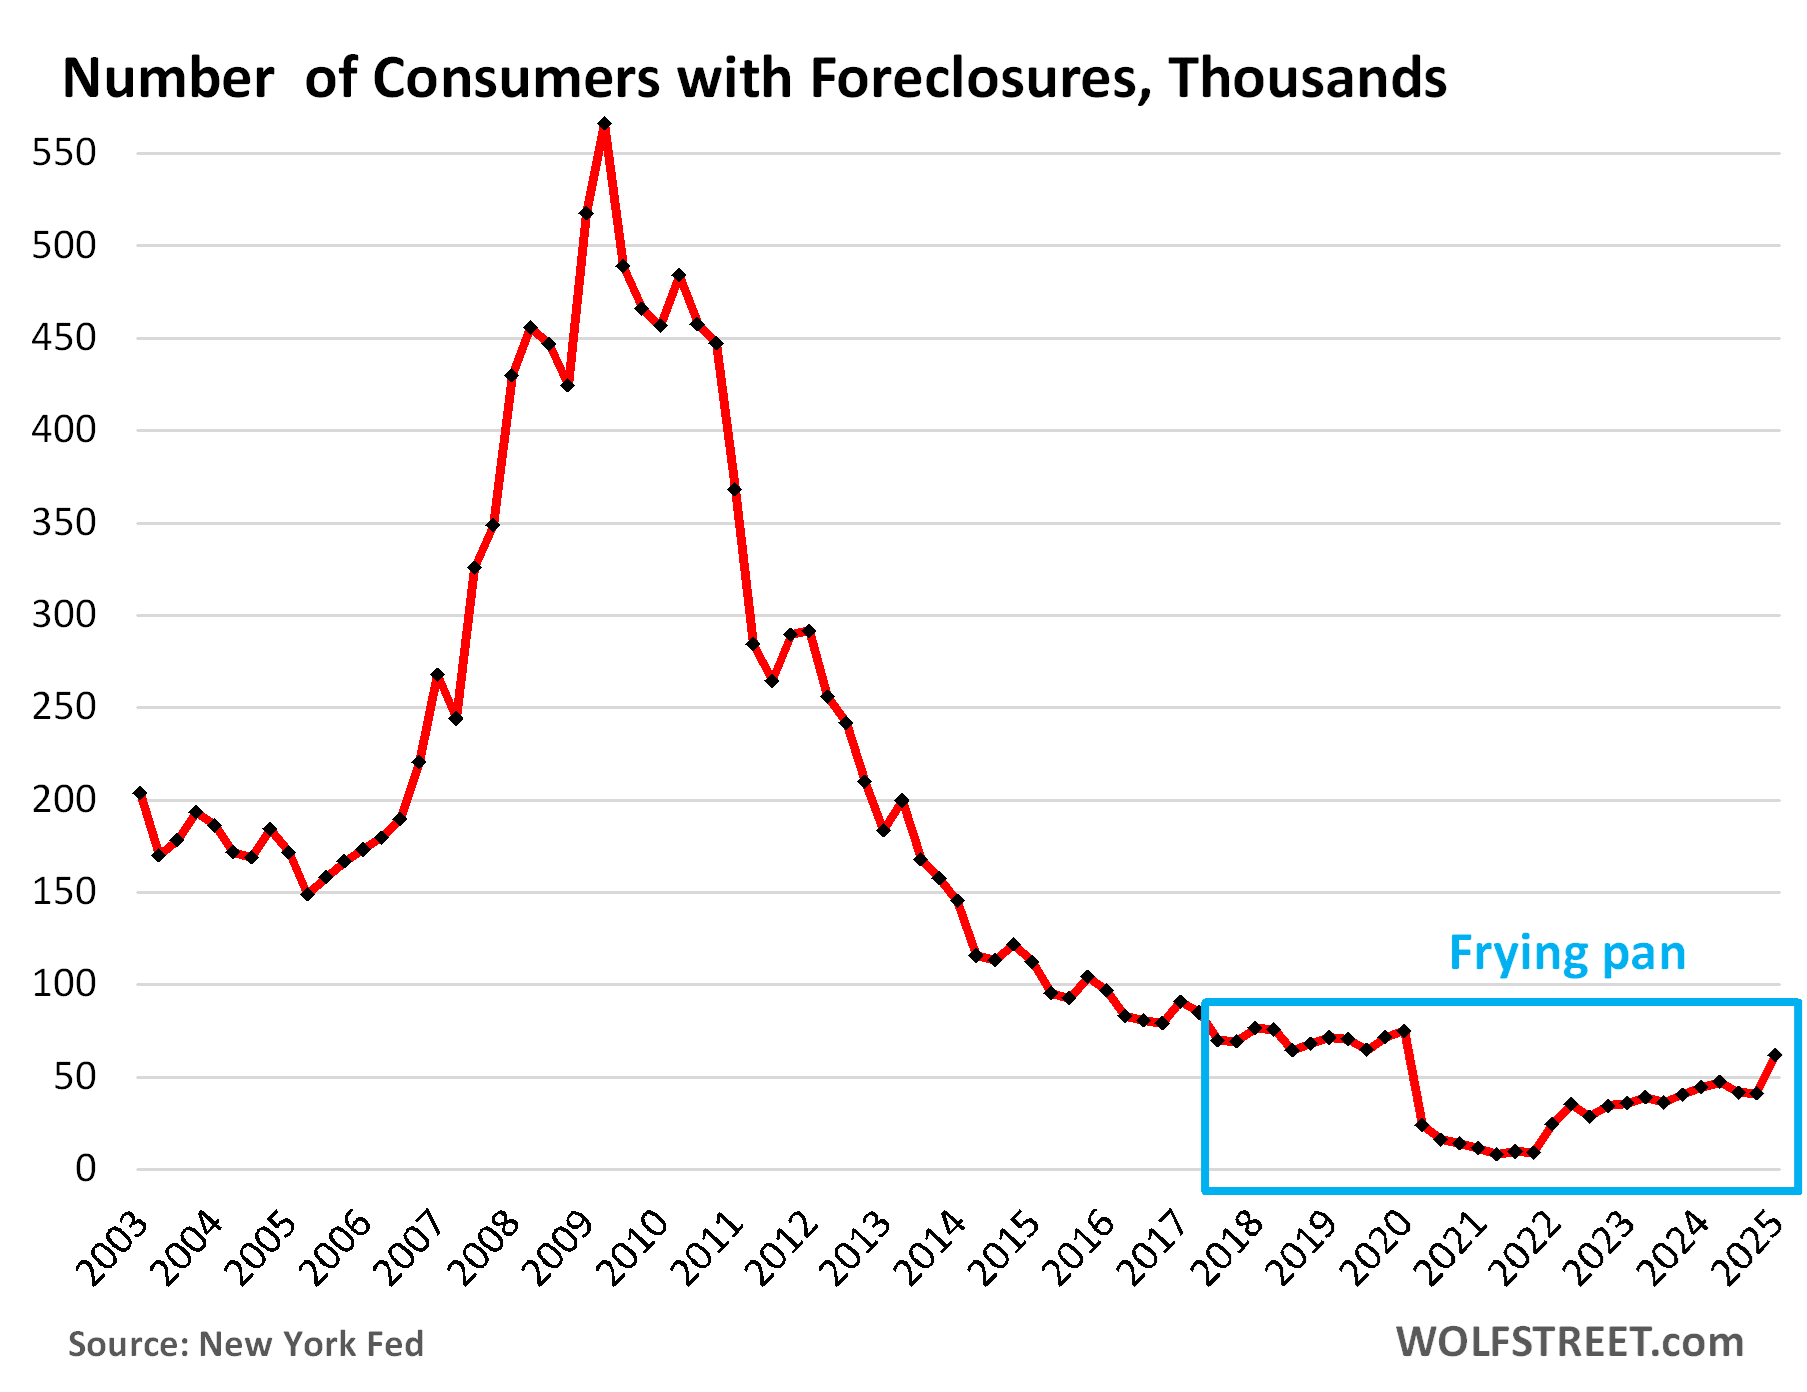
The infamous “frying pan pattern” – so dubbed right here some time ago – is now forming, where the panhandle represents the prepandemic level, the pan represents the free-money level, and the other edge of the pan represents the post-free-money return to prepandemic levels:
The foreclosures frying-pan pattern. The number of consumers with foreclosures in Q1 rose to 61,660, still below the range of the Good Times in 2018-2019 between 65,000 and 90,000.
During the Free-Money era, which included government-sponsored mortgage-forbearance programs under which foreclosures were essentially impossible, the number of foreclosures fell to near zero.
What is keeping foreclosures still low currently is that home prices exploded during the free-money era, by 50%, 60%, or more in many markets, so most strung-out homeowners can sell their home for more than they owe on it, pay off the mortgage, and walk away with some cash, and their credit intact.
It’s only when home prices spiral down for years, which they started to do in some markets – here is a look at condos in 15 big markets with price declines of 10% or more – that foreclosures can become a problem.
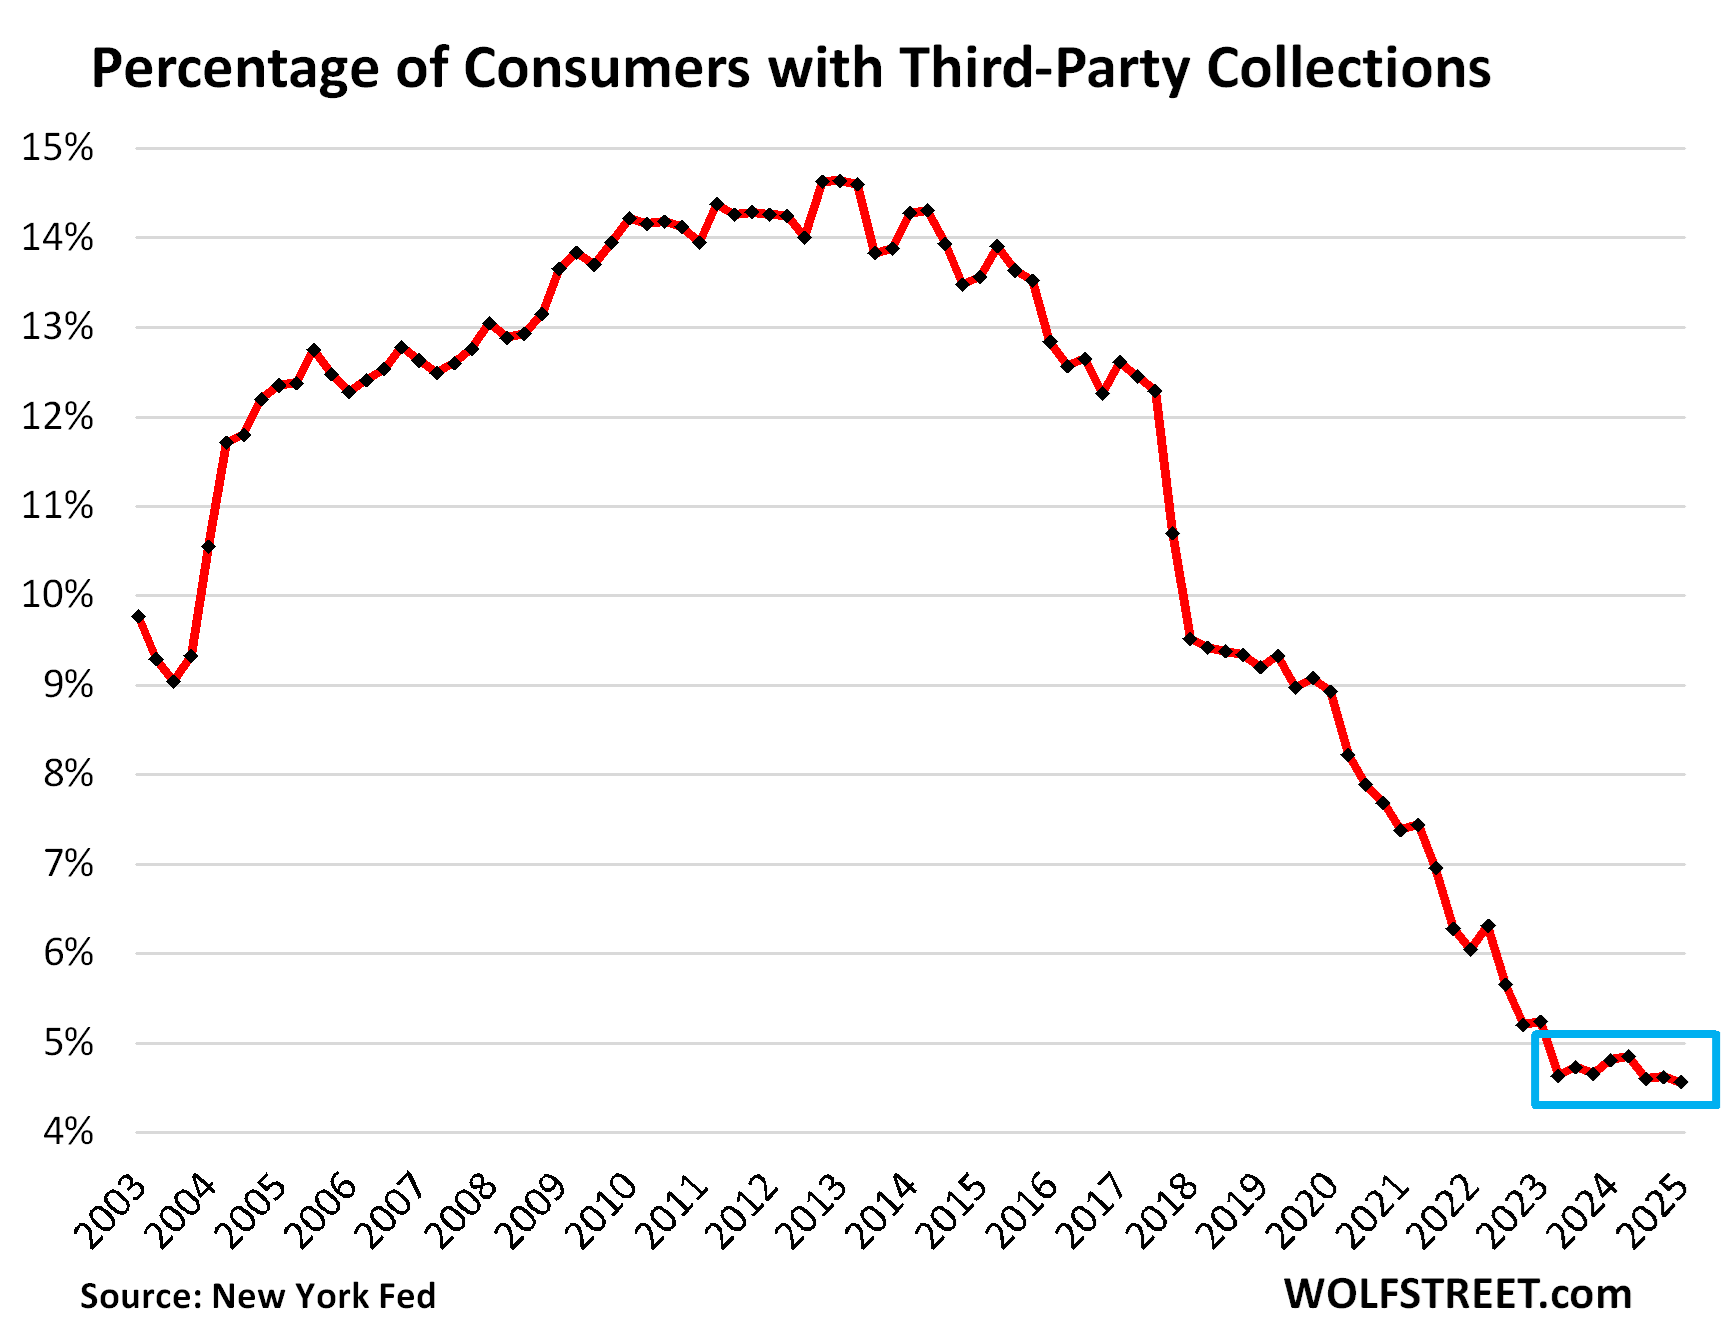
Third-party collections crawl along rock bottom. A third-party collection entry is made into a consumer’s credit history when the lender reports to the credit bureaus, such as Equifax, that it sold the delinquent loan, such as credit card debt, to a collection agency for cents on the dollar. The New York Fed obtained this data on third-party collections in anonymized form through its partnership with Equifax.
The percentage of consumers with third-party collections has hobbled from record low to record low since the advent of free money in Q2 2020, and even after the free money vanished, third-party collections continued to hit record lows and in Q1 edged down to a new record low of 4.56%:
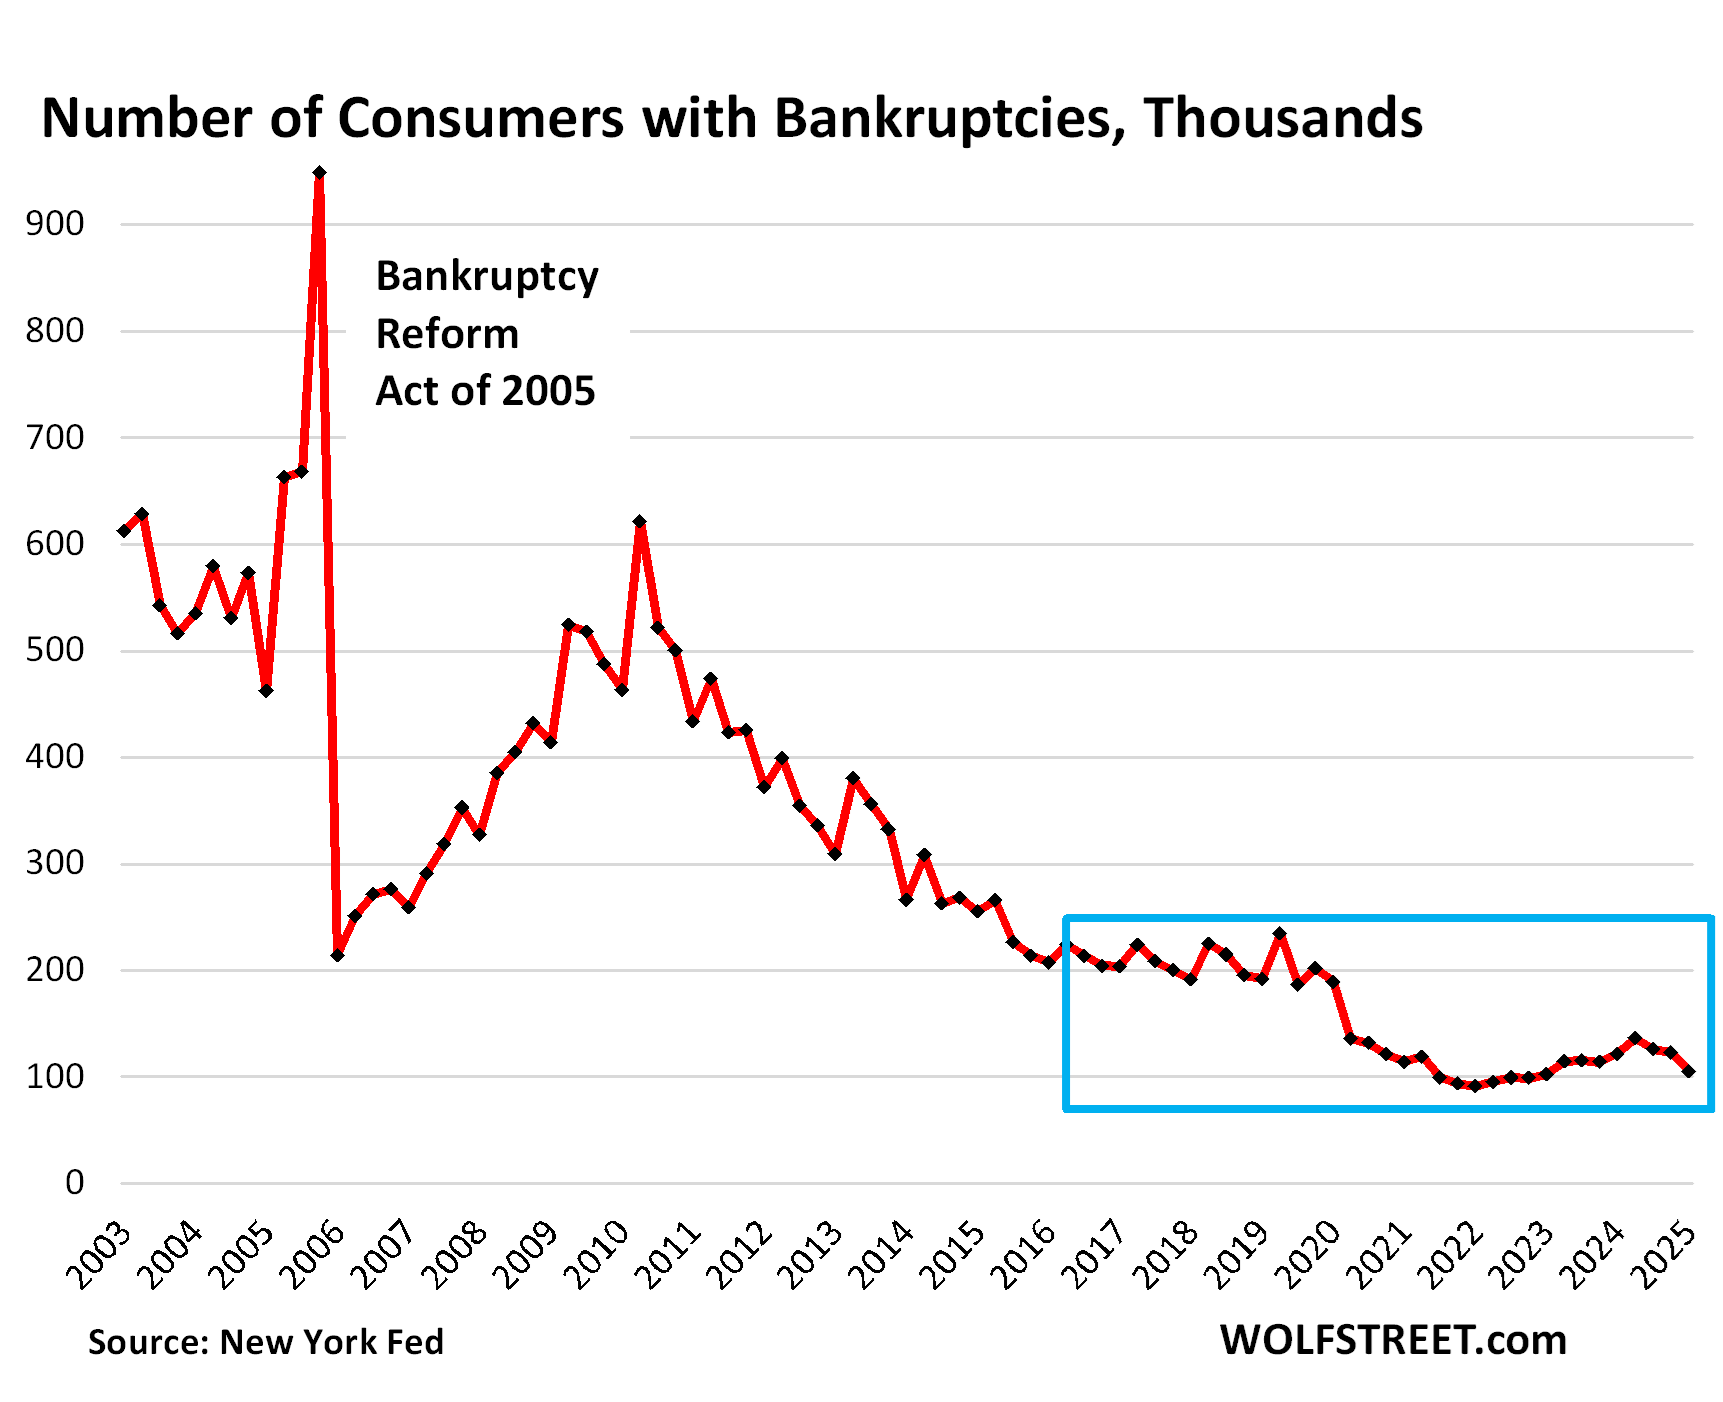
Bankruptcies form a “broken frying-pan pattern,” a new phenomenon here. The number of consumers with bankruptcy filings dipped to 104,860 in Q1, the third quarter in a row of declines, and now just a hair above the all-time free-money low in Q4 2021.
During the Good Times before the pandemic, the number of consumers with bankruptcy filings ranged from 186,000 to 234,000, which had also been historically low.
This decline in bankruptcy filings broke the side of the pan that is opposite to the handle and forms an odd-looking broken frying-pan pattern.
We’re going to wade into housing debt, credit card debt, and auto debt in separate articles over the next few days. Next one up is housing debt.
Enjoy reading WOLF STREET and want to support it? You can donate. I appreciate it immensely. Click on the mug to find out how:

![]()
The post Household Debts, Debt-to-Income Ratio, Serious Delinquencies, Collections, Foreclosures, Bankruptcies: Our Drunken Sailors’ Debts in Q1 2025 appeared first on Energy News Beat.
“}]]
