
 [[{“value”:”
Our Drunken Sailors may be in a crappy mood, but that doesn’t stop them.
By Wolf Richter for WOLF STREET.
The big thing – from a data-geek point of view – in today’s retail sales report by the Census Bureau was that the entire data series was rejiggered for several factors, including two massive changes going back to Adam and Eve, well, back to the beginning of the data series in 1992:
- The shift to the 2017 North American Industry Classification System (NAICS) from the 2012 NAICS, which altered how retailers are categorized and shifted retailers (and their sales) between major categories.
- Removal from the data of mom-and-pop retailers that don’t have employees. The current employer-only retail sales are obviously lower than the prior version that included sales by non-employer retailers.
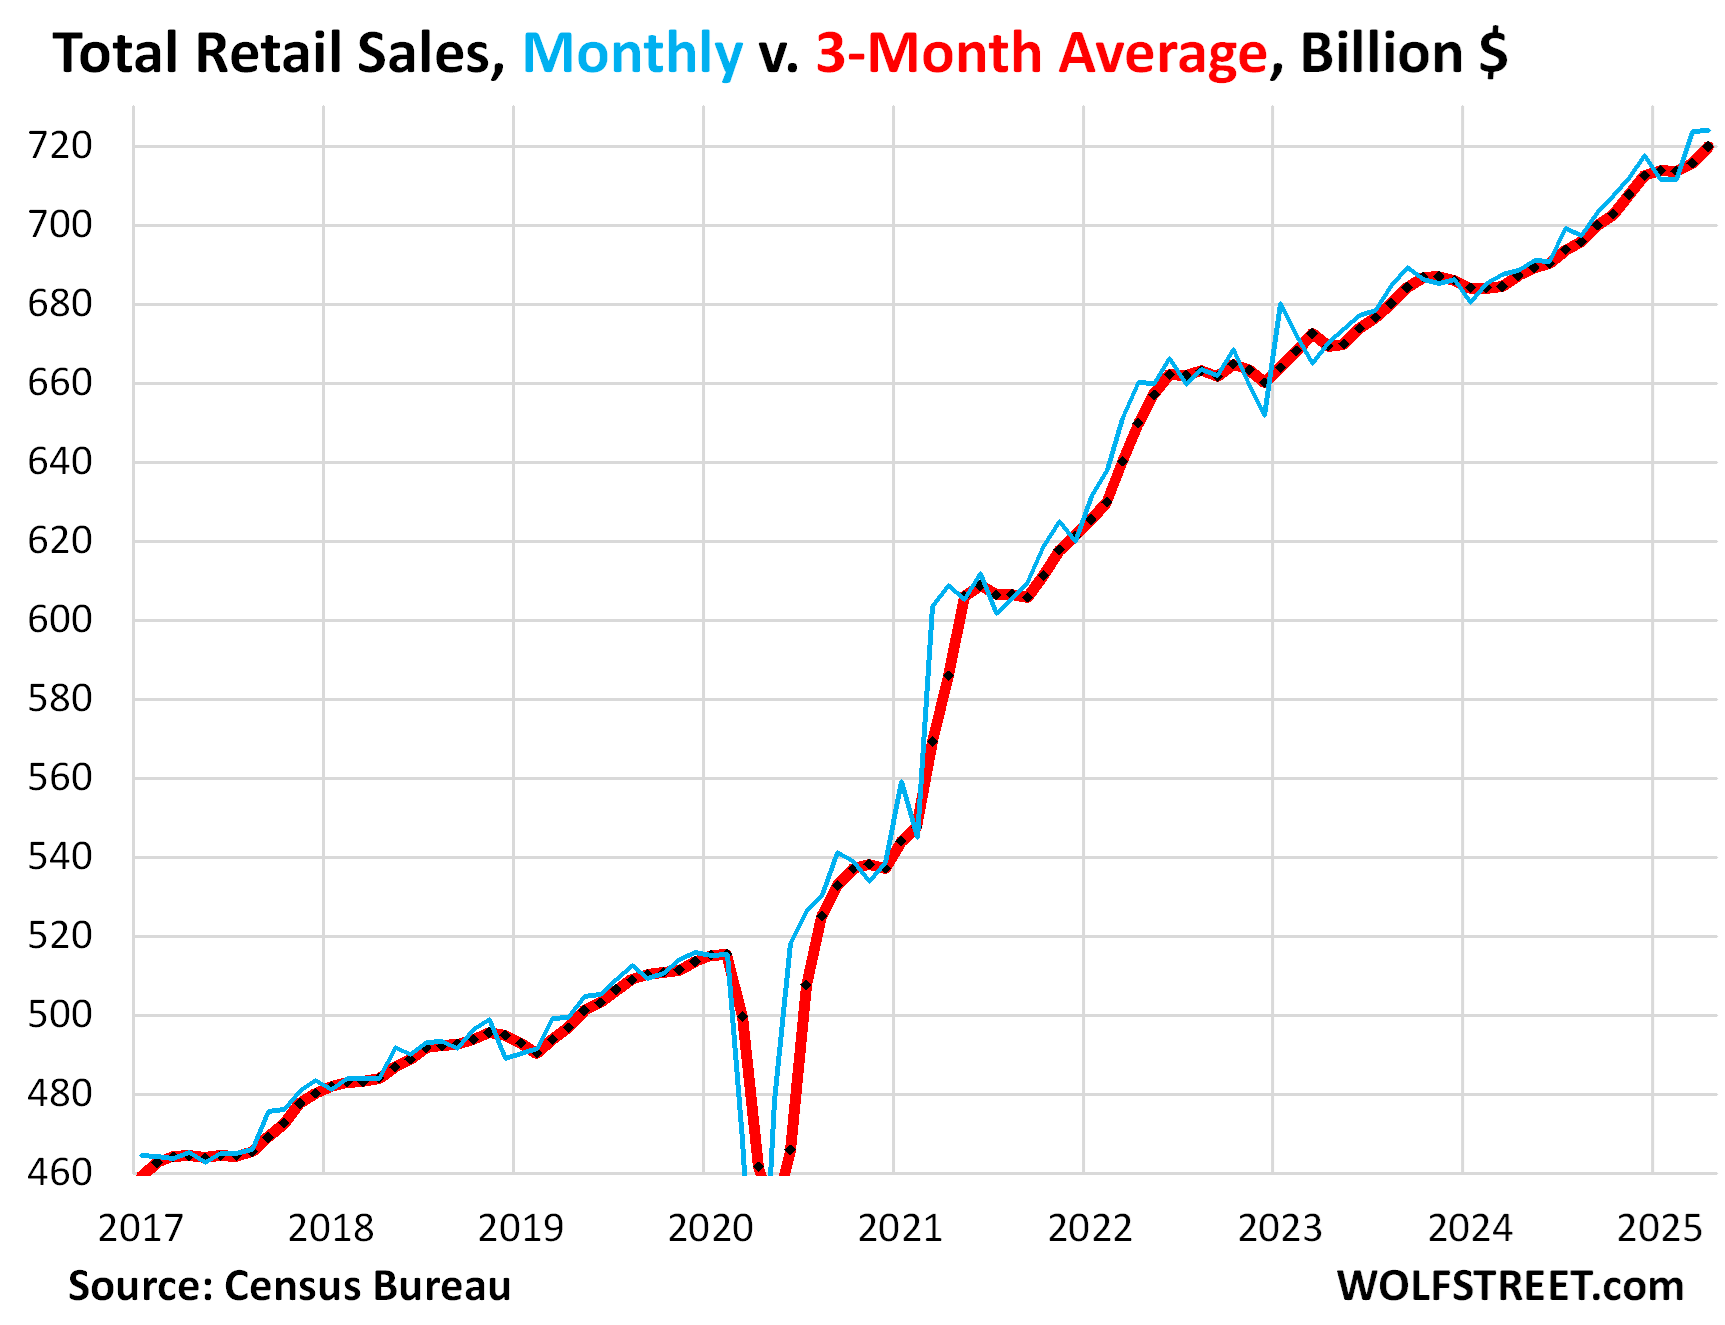
Drunken Sailors: Within this new data series, retail sales growth in March was revised up to a gigantic +1.7% gain (+22% annualized) from the already huge +1.4% gain reported a month ago, seasonally adjusted. In April, sales rose 0.1% on top of the jump in March, to a record $724 billion, and were up by a substantial 5.2% year-over-year, peppered by the continued spike in sales at restaurants and bars, the ultimate discretionary spending.
The three-month average retail sales, which irons out the month-to-month squiggles, rose by 0.6% (+7.3% annualized) in April from March. People have been in a foul mood in sentiment surveys because they hate high prices and inflation, and because the media and social media whack them over the head on a constant basis with clickbait nonsense. But they’re still out there spending money and having fun (month-to-month in blue, three-month average in red):
Retail sales by the largest categories of retailers.
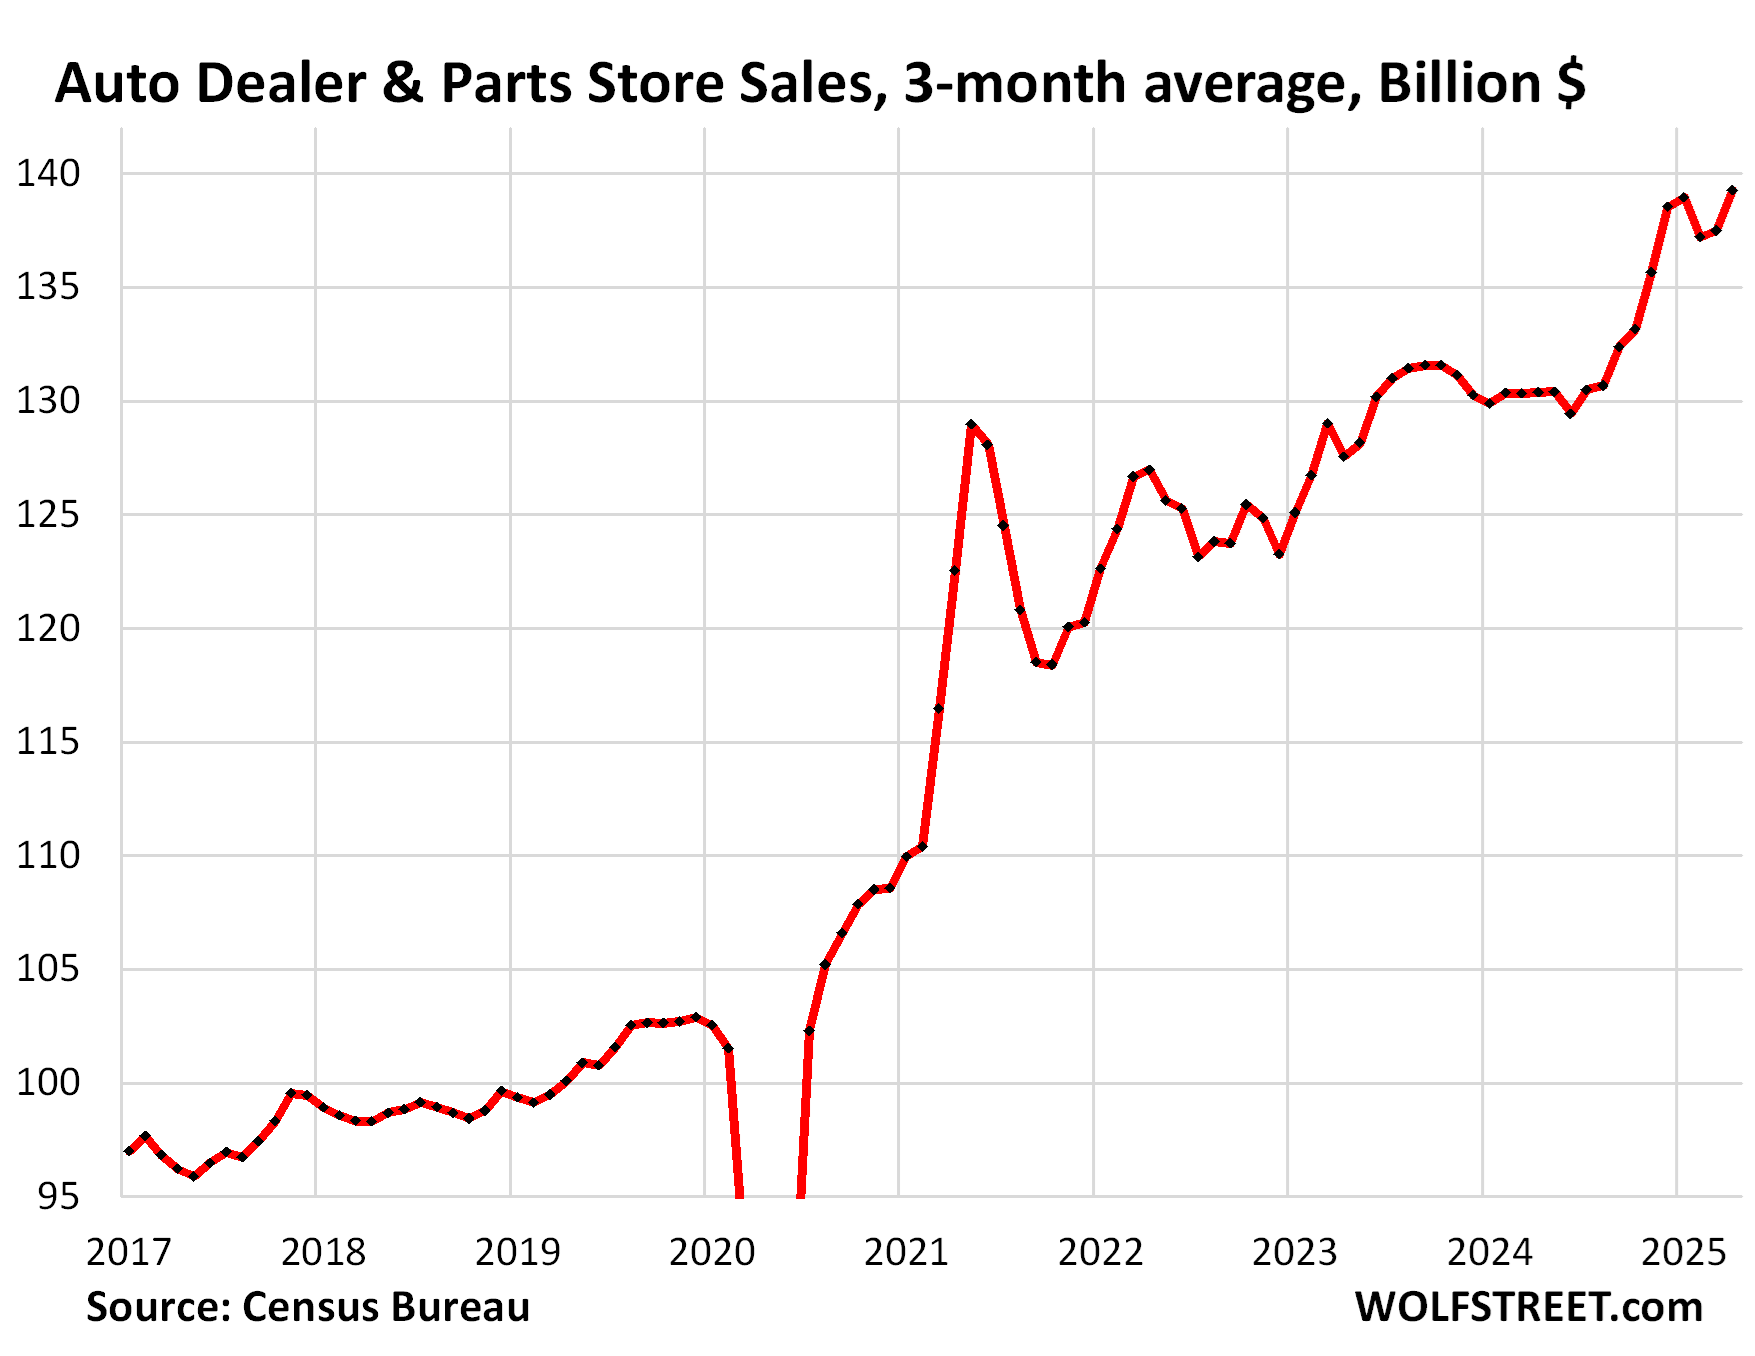
New and used vehicle dealers and parts stores (#1 retailer category, 19% of total retail sales): Sales dipped a hair from the huge record March, to $142 billion, seasonally adjusted, but jumped 9.4% year-over-year.
The three-month average sales jumped by 1.3% in April from March and was up by 6.8% year-over-year. We can see the spike in the second half of 2025, the drop early this year, and the next step higher to a new record:
Ecommerce and other “nonstore retailers” (ecommerce retailers, ecommerce operations of brick-and-mortar retailers, and stalls and markets, #2 category, 17% of total retail sales), seasonally adjusted:
- Sales: $124 billion
- Month-to-month: +0.2%
- Year-over-year: +7.5%
- 3-month average: +0.6%

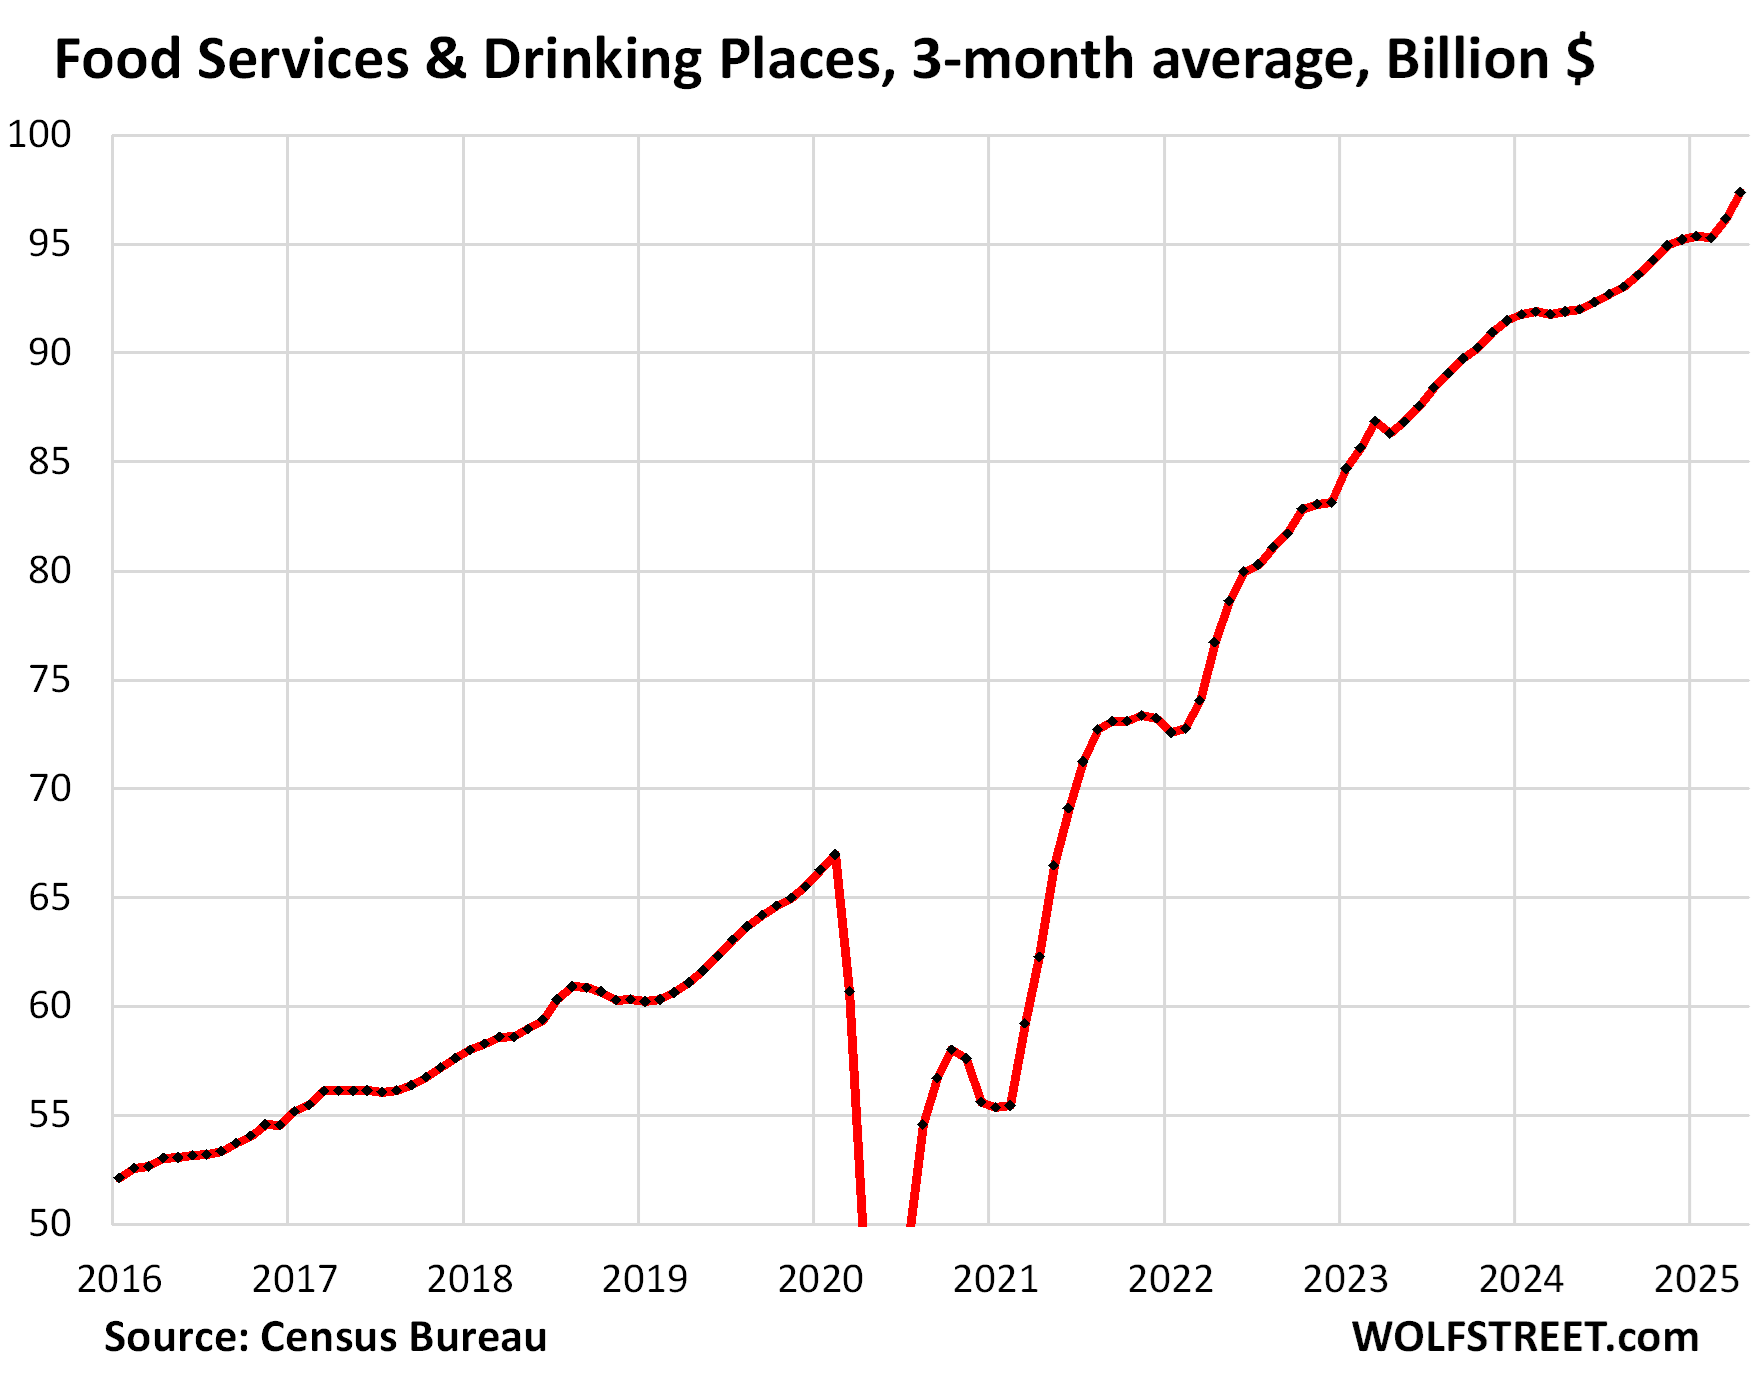
Food services and drinking places (#3 category, everything from cafeterias to restaurants and bars, 13% of total retail sales). Most of it is discretionary spending – money that consumers want to spend.
Our Drunken Sailors, as we’ve come to call them facetiously and lovingly, are back on track. Maybe widespread bad weather kept them at home in early 2025, but they splurged in March and April:
- Sales: $99 billion
- Month-to-month: +1.2%
- Year-over-year: +7.8%
- 3-month average: +1.3%
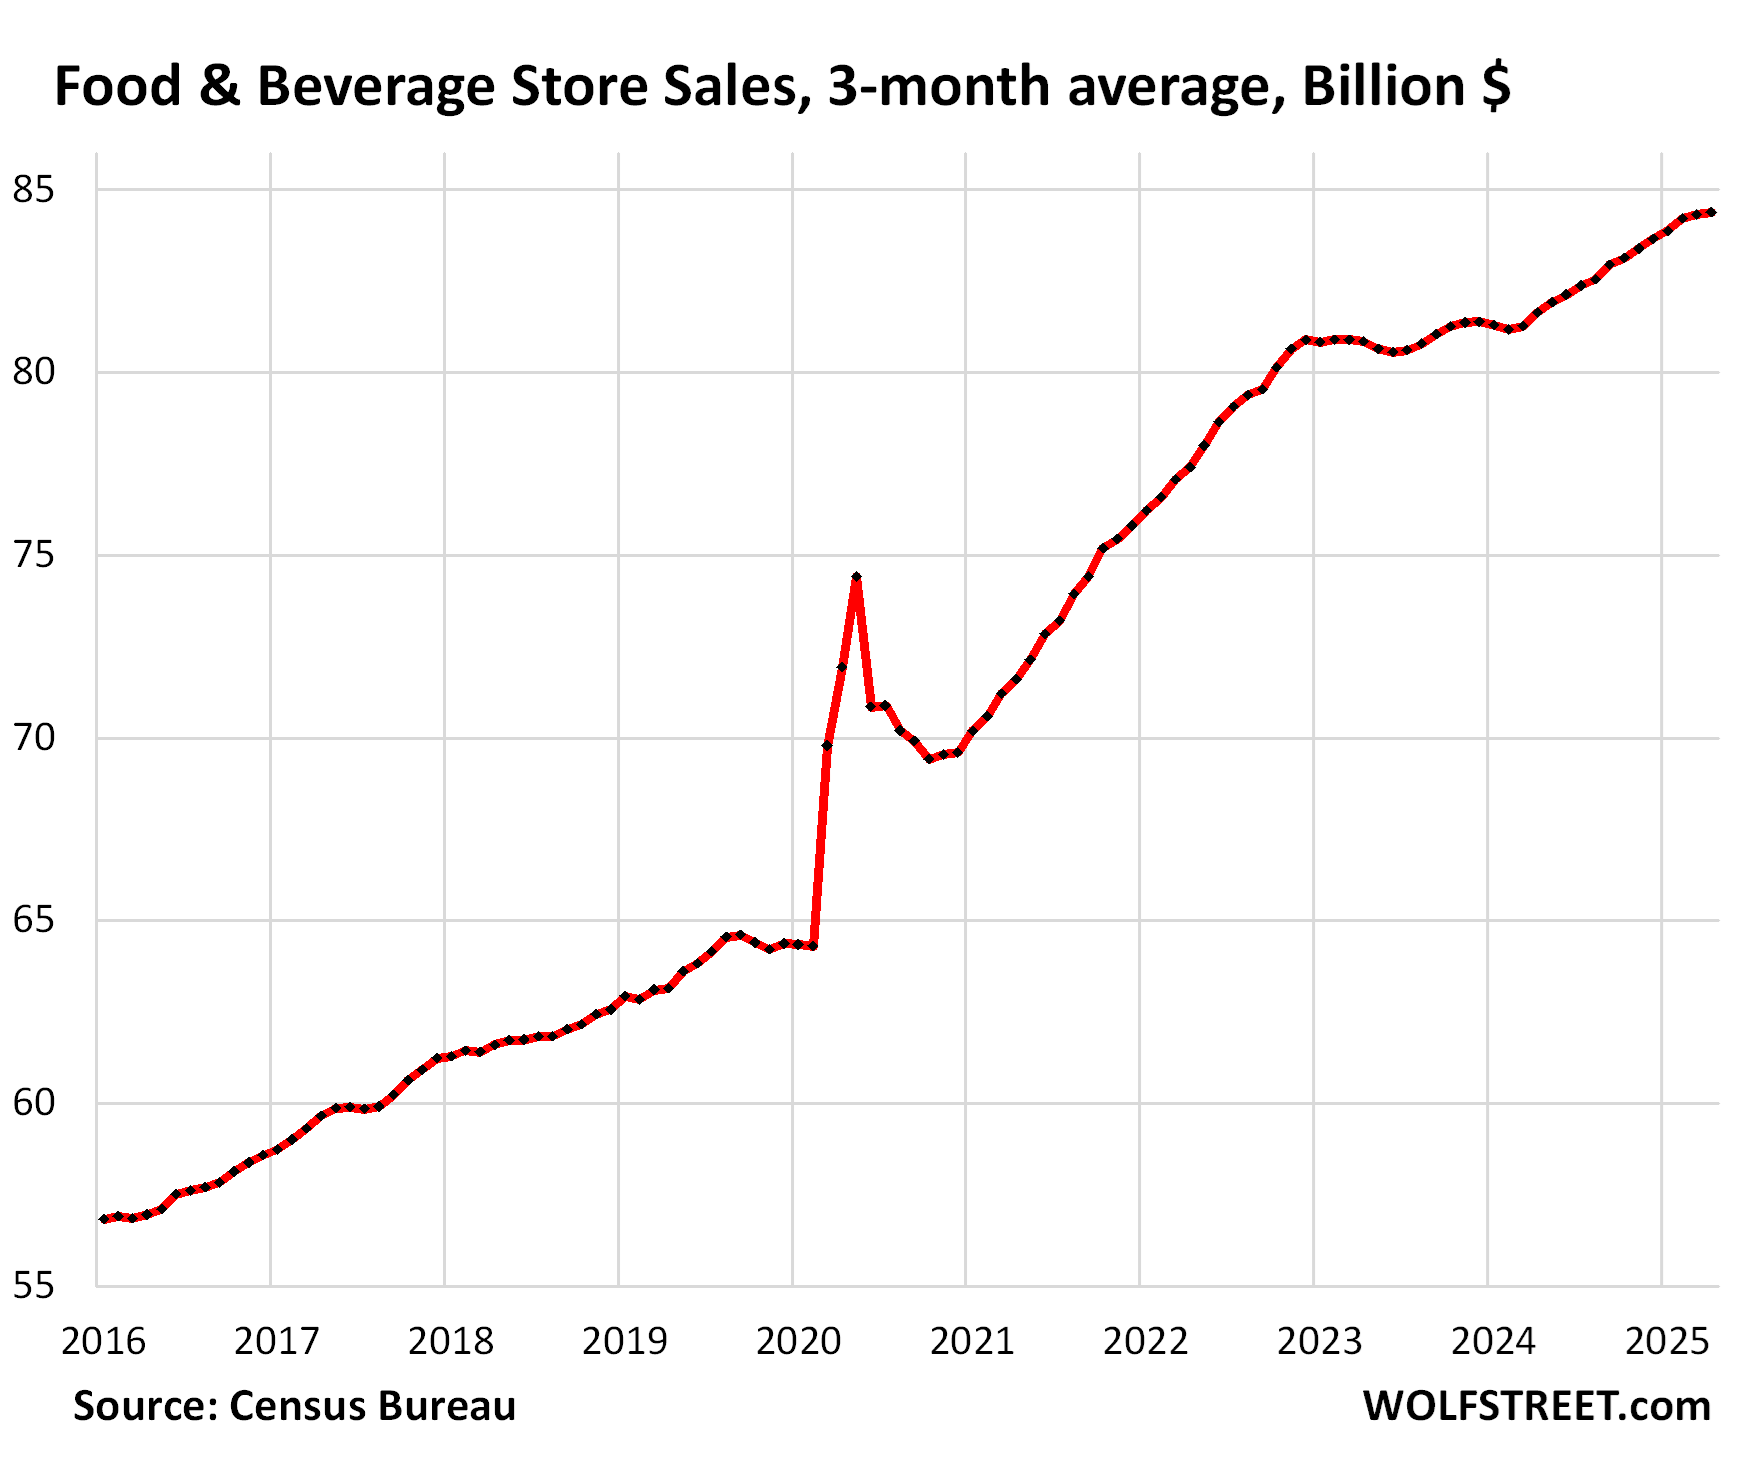
Food and Beverage Stores (#4 category, 12% of retail sales).
- Sales: $84 billion
- Month-to-month: unchanged
- Year-over-year: +2.7%
- 3-month average: +0.1%
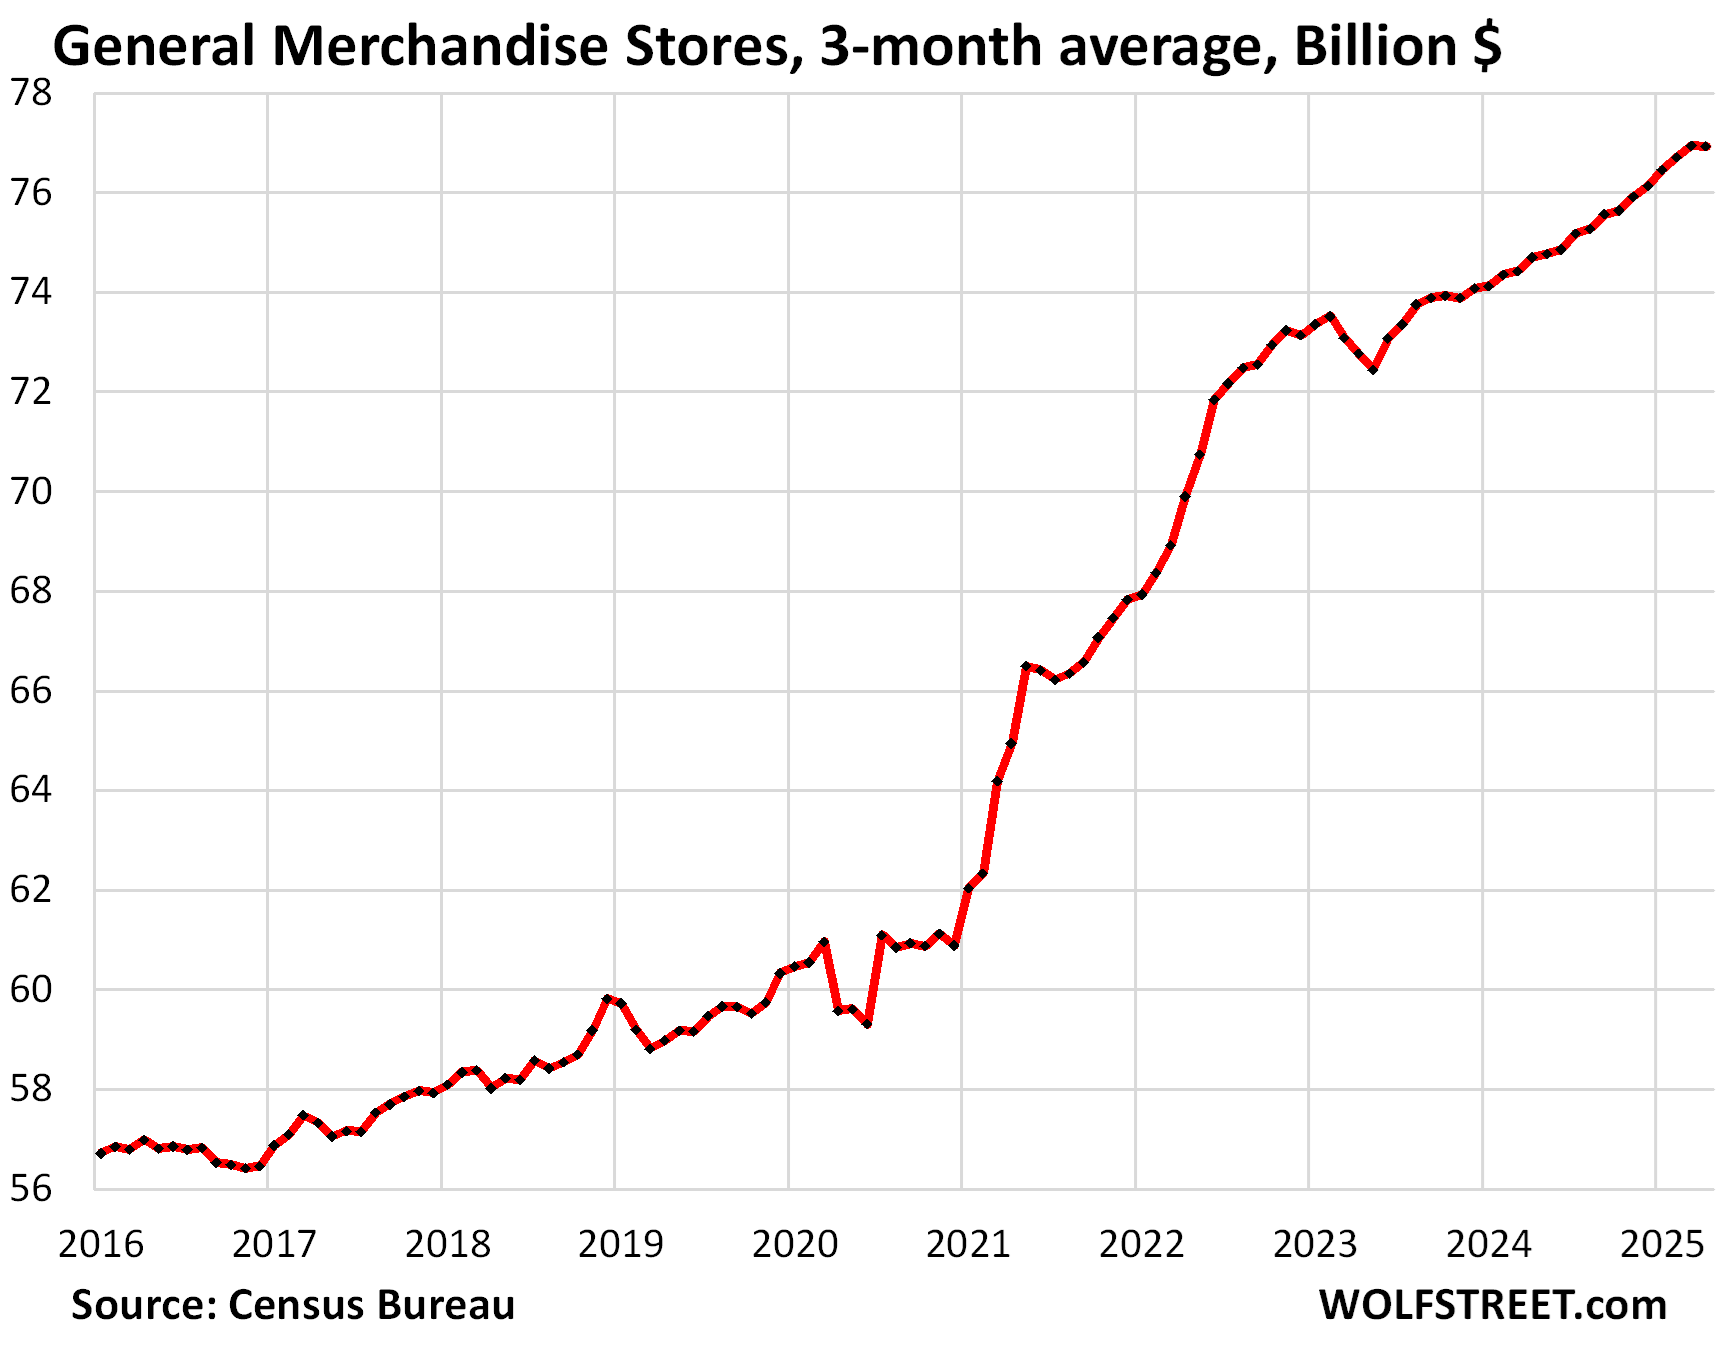
General merchandise stores (#5 category, 11% of retail sales), including retailers such as Walmart, which is also the largest grocer in the US, but not including their huge ecommerce sales; they’re included in “nonstore sales” above.
- Sales: $77 billion
- Month-to-month: -0.2%
- Year-over-year: +2.8%
- 3-month average: unchanged
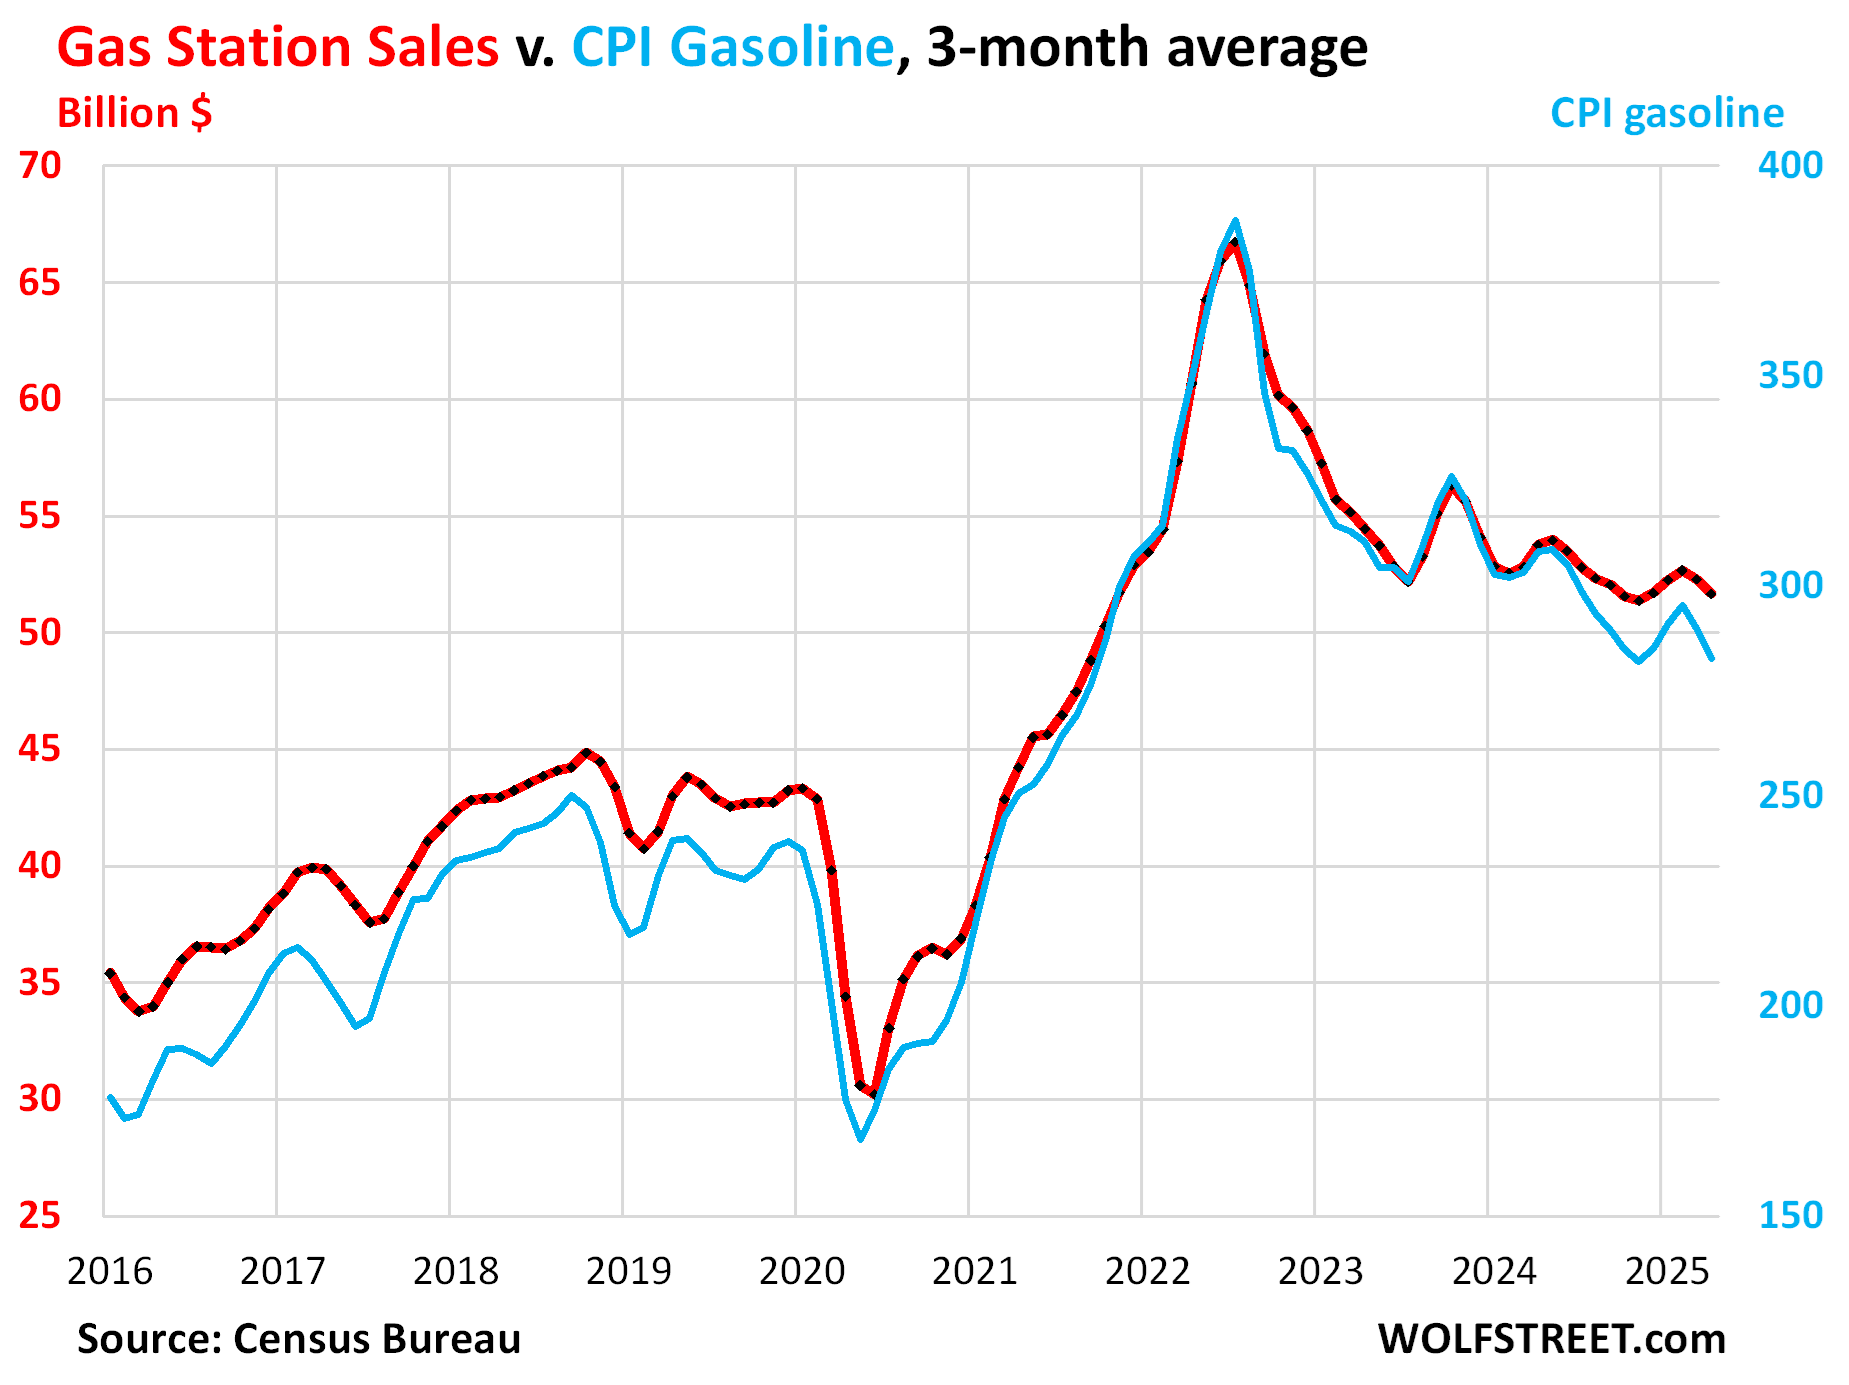
Gas stations (#6 category, 7% of retail sales). Dollar-sales at gas stations move in near-lockstep with the price of gasoline. The price of gasoline started heading lower in mid-2022. The price declines pushed down dollar-sales at gas stations. Sales at gas stations also include all the other merchandise gas stations sell:
- Sales: $51 billion
- Month-to-month: -0.5%
- Year-over-year: -6.8%
- 3-month average: -1.2%
Sales in billions of dollars at gas stations (red, left axis); and the CPI for gasoline (blue, right axis):
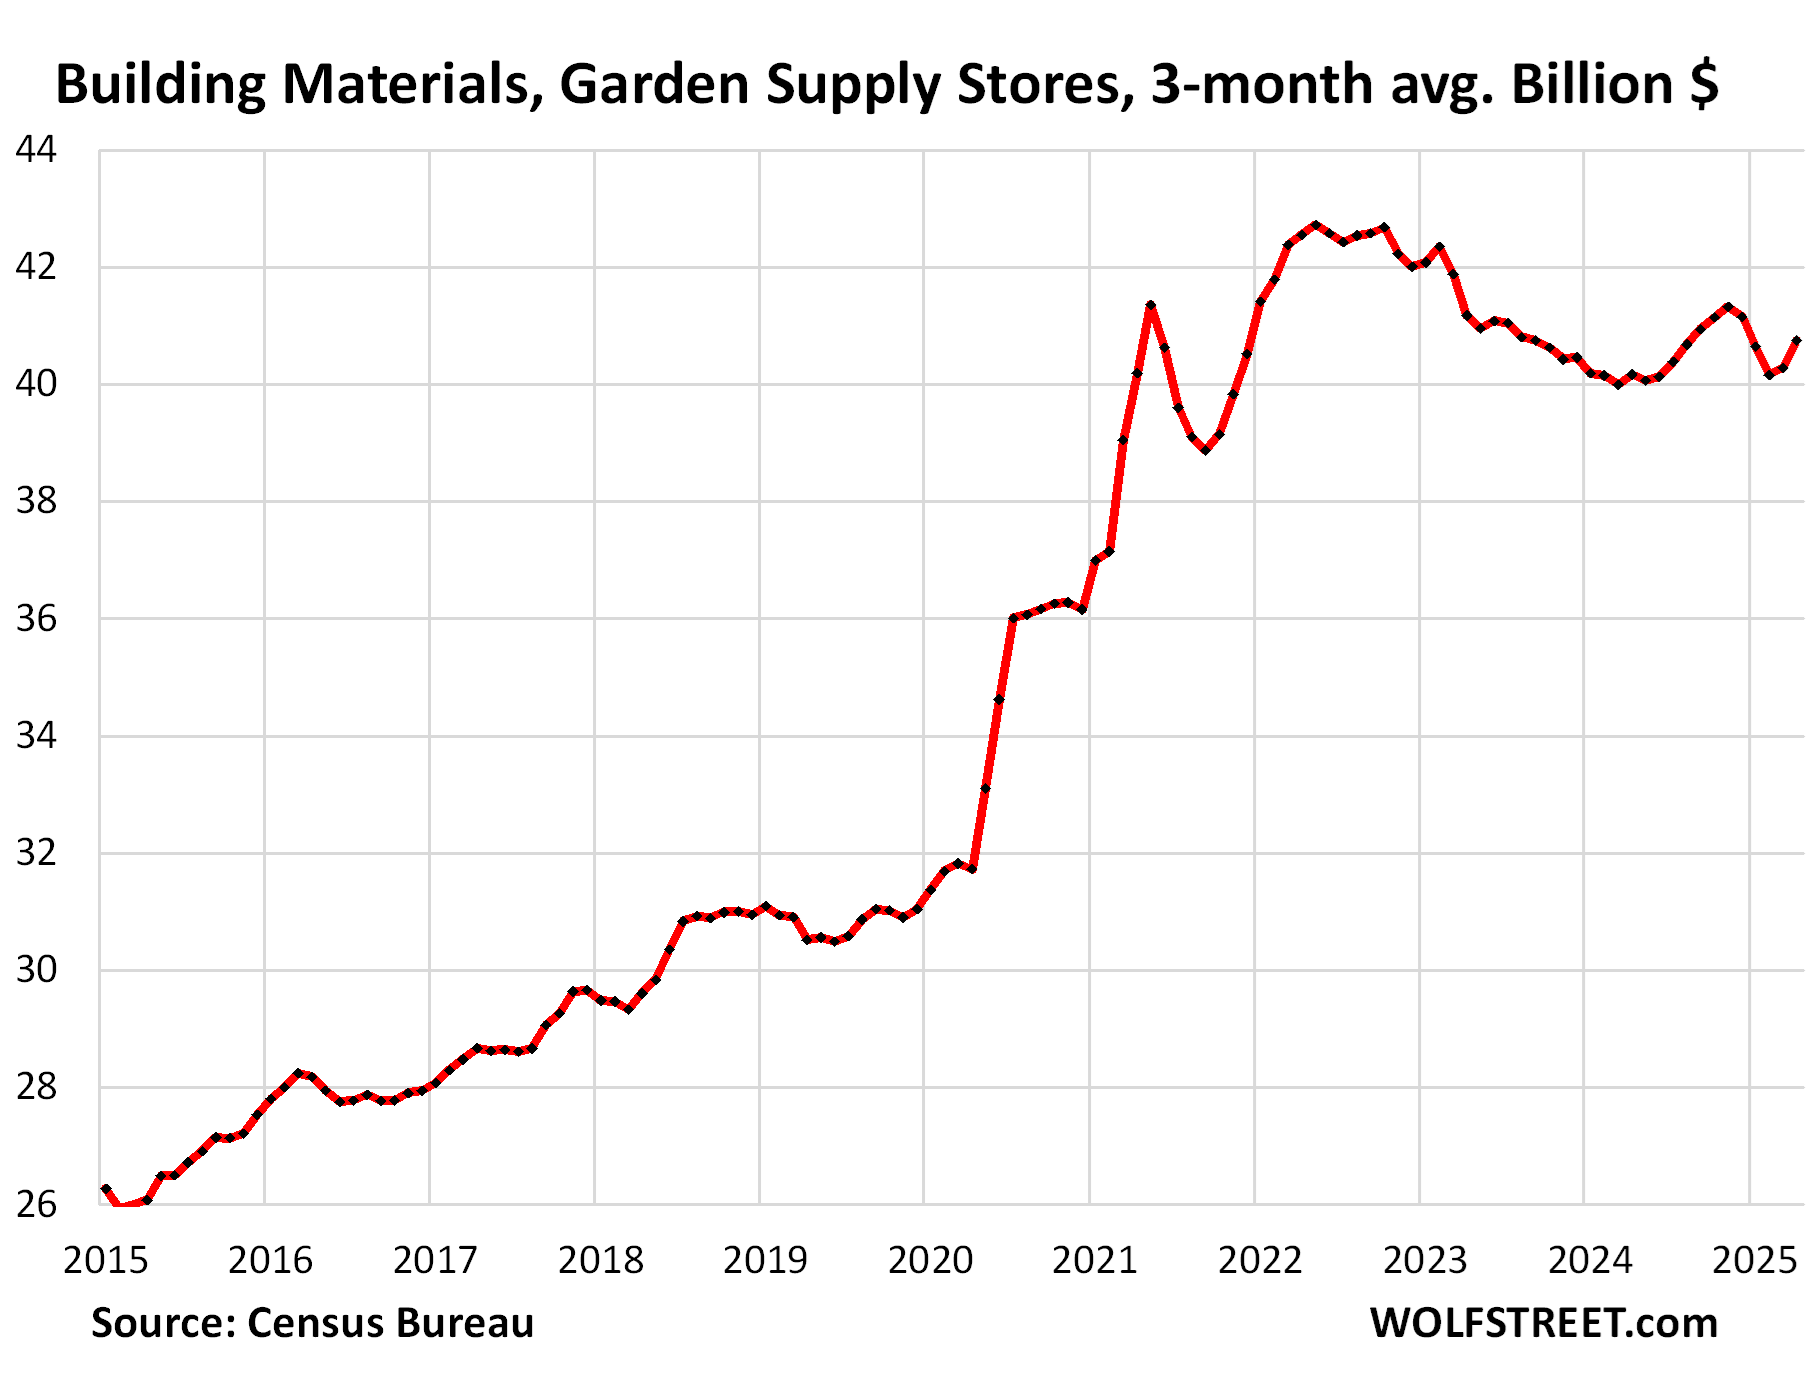
Building materials, garden supply and equipment stores (#7 category, 6% of total retail):
- Sales: $41 billion
- Month-to-month: +0.8%
- Year-over-year: +3.2%
- 3-month average: +1.2%
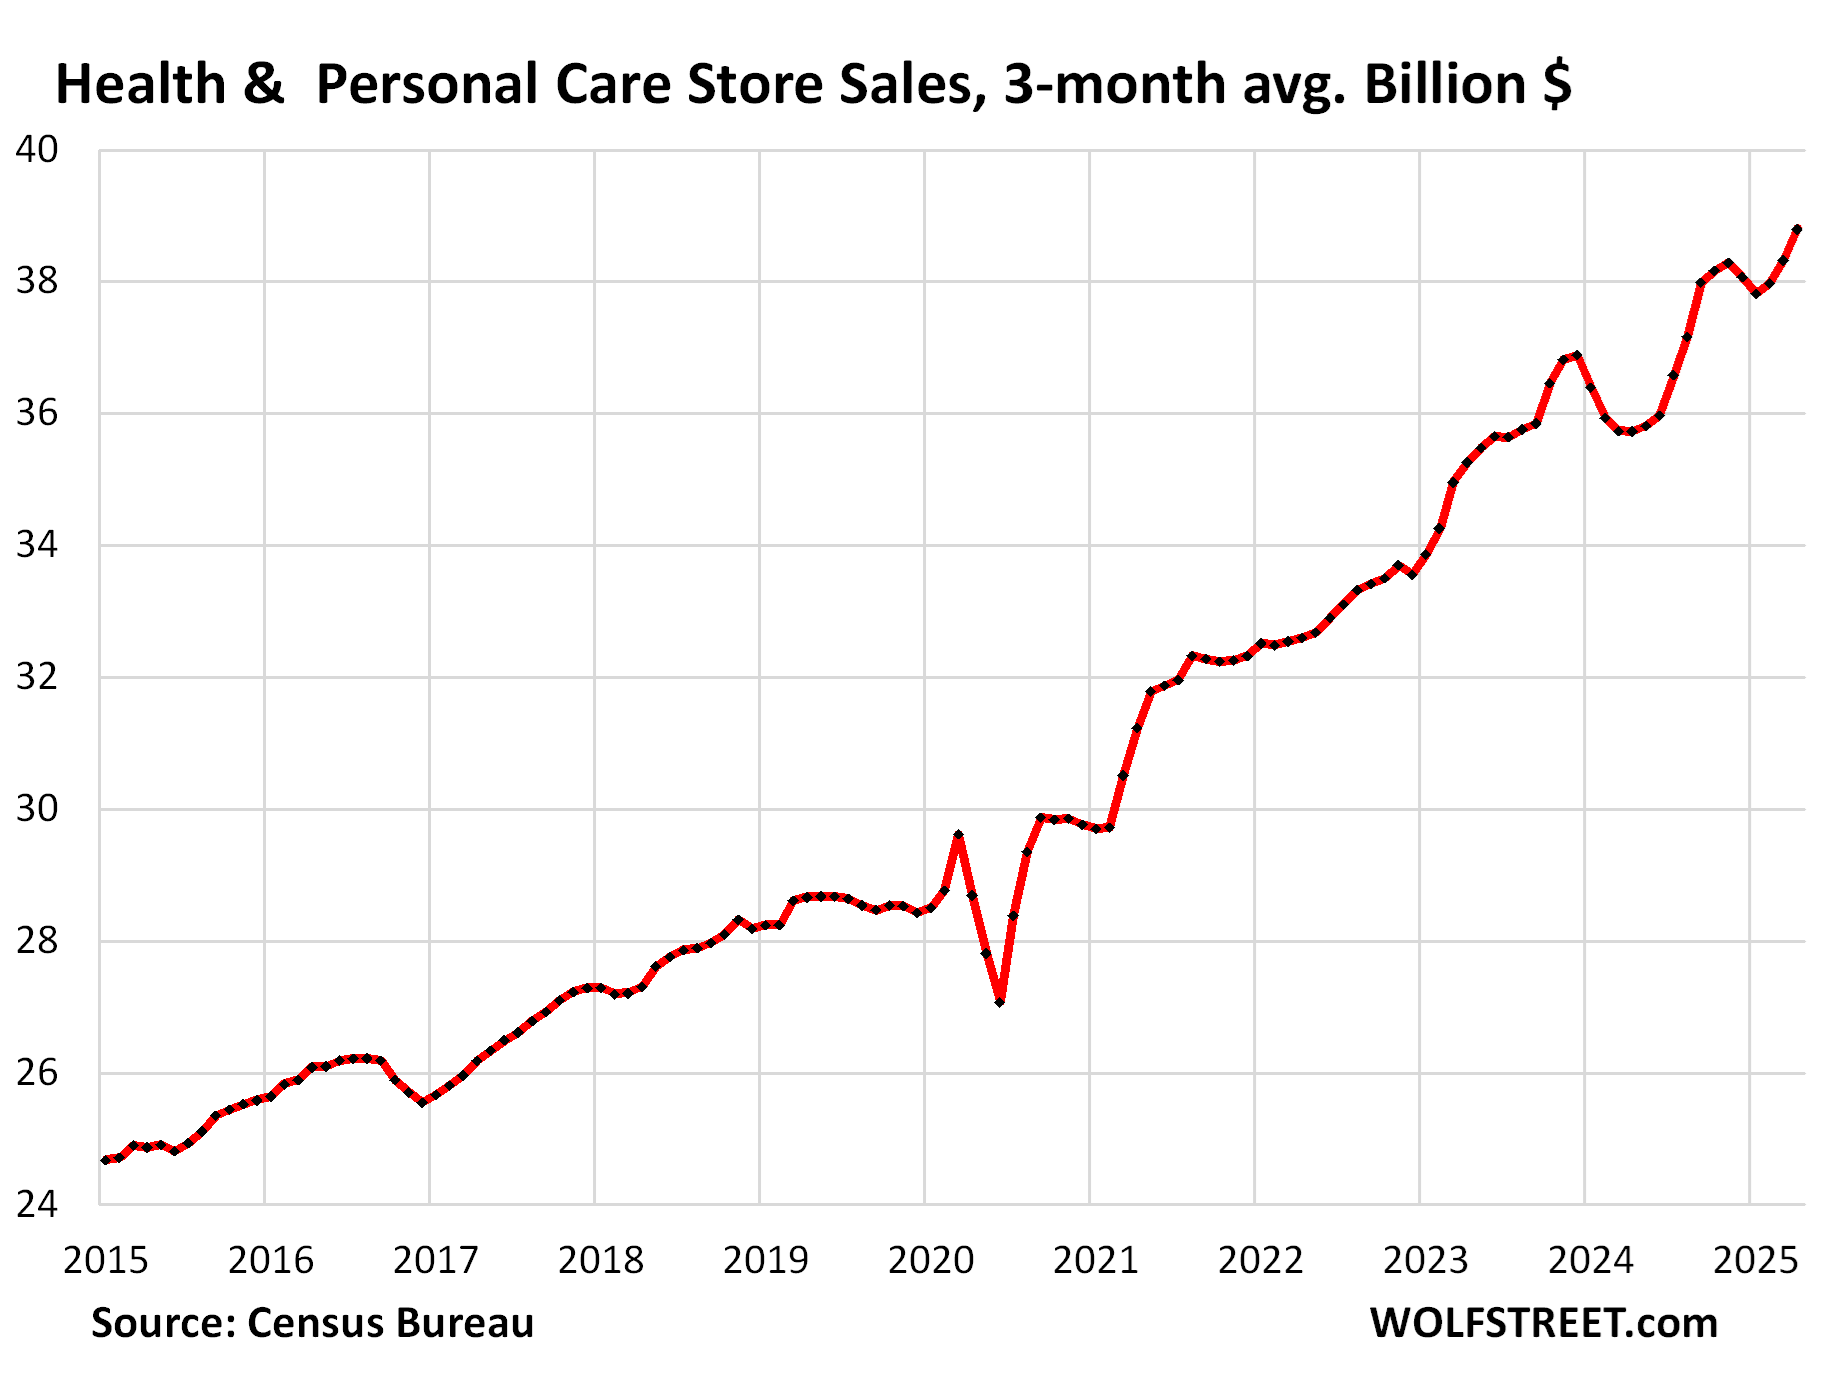
Health and personal care stores (#8 category, 5% of total retail:
- Sales: $39 billion
- Month-to-month: -0.2%
- Year-over-year: +8.5%
- 3-month average: +1.2%
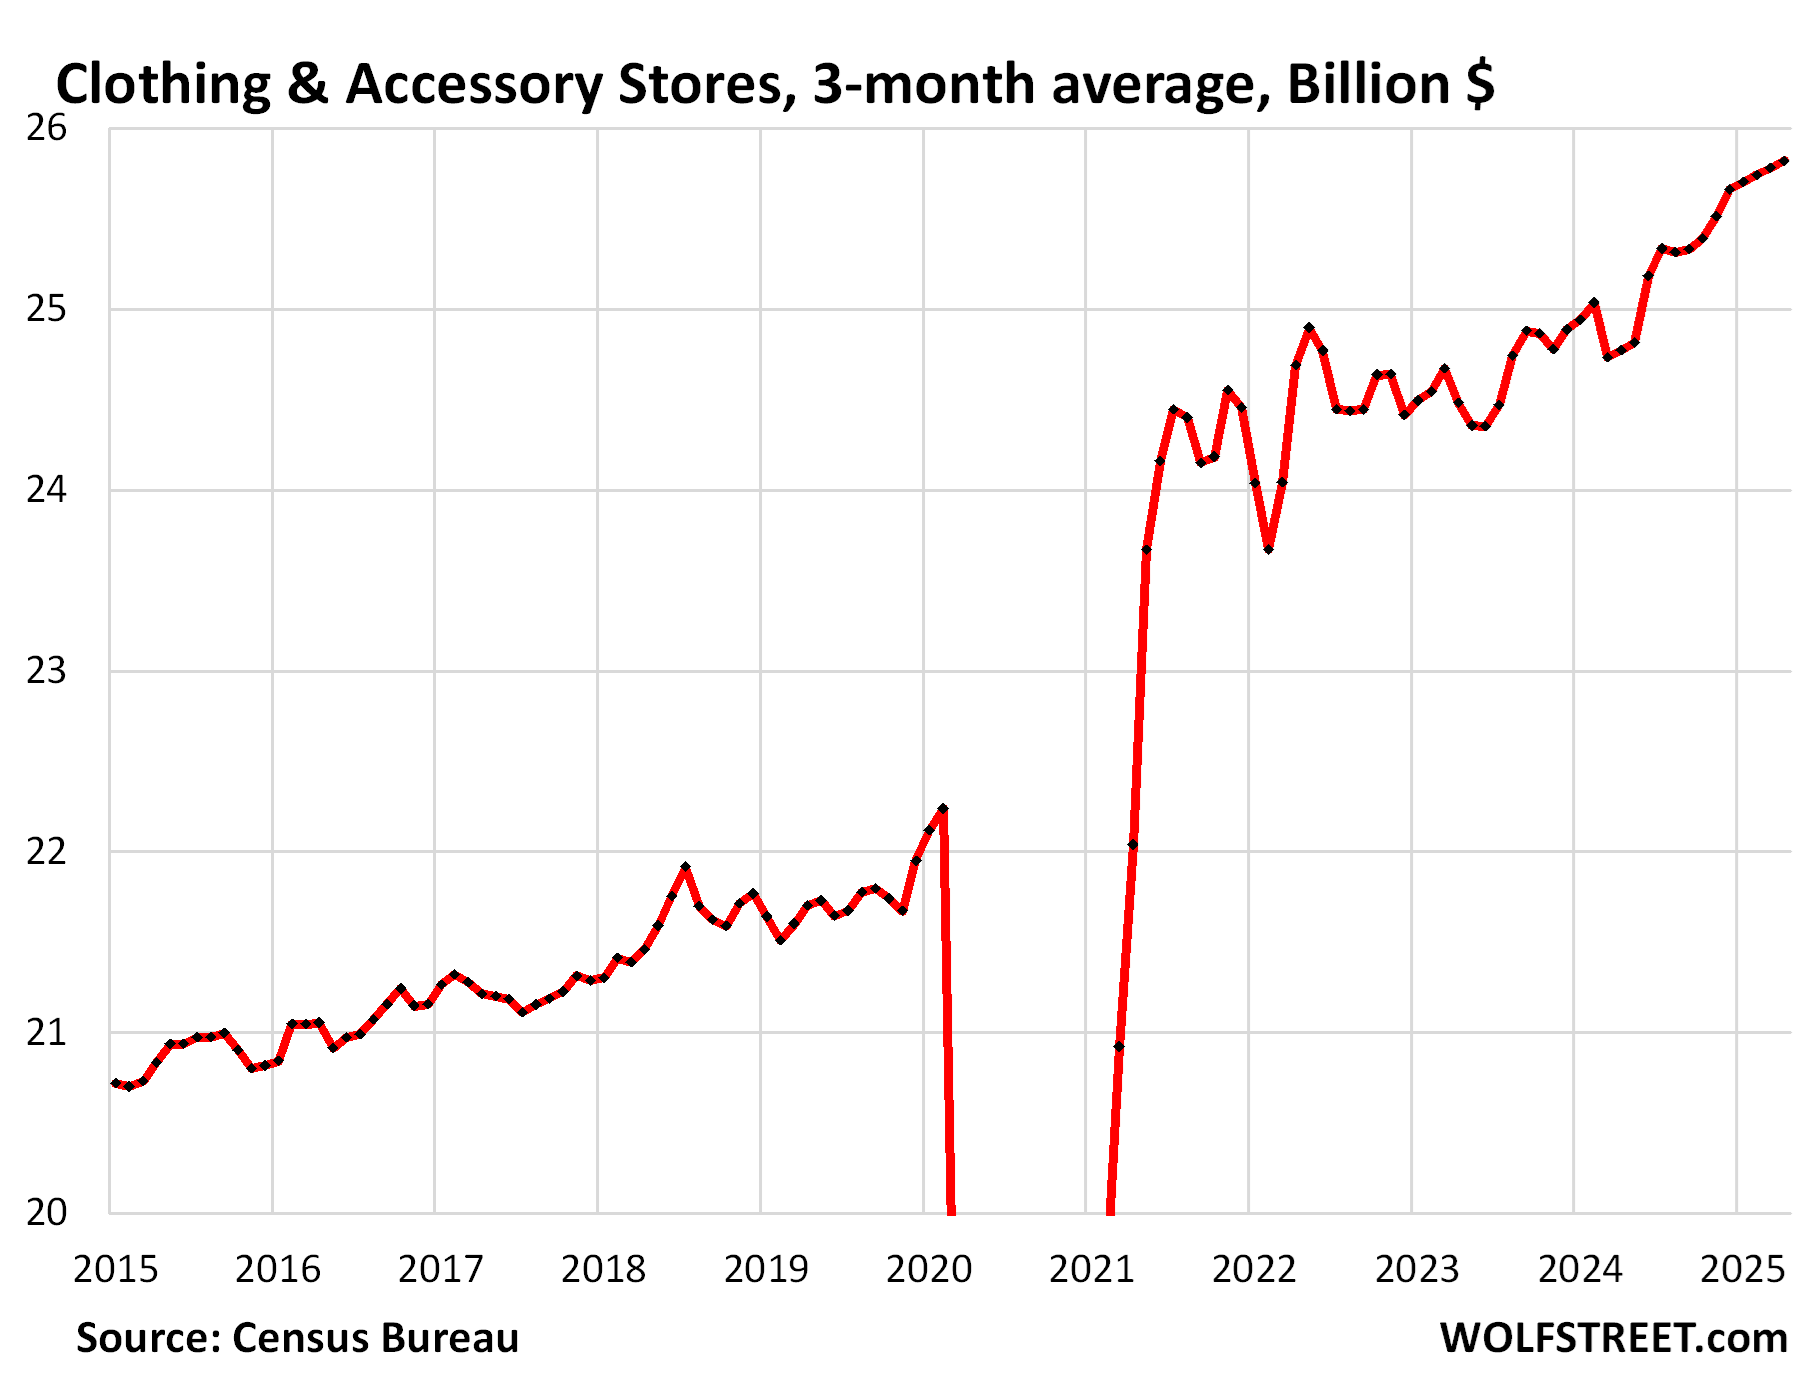
Clothing and accessory stores (#9 category, 4% of retail):
- Sales: $26 billion
- Month-to-month: -0.4%
- Year-over-year: +3.5%
- 3-month average: +0.2%
Enjoy reading WOLF STREET and want to support it? You can donate. I appreciate it immensely. Click on the mug to find out how:

![]()
The post Beyond the Squiggles in Retail Sales appeared first on Energy News Beat.
“}]]
